
31. Explain the architecture and data flow of a project you built.
Choose a substantial project and draw its architecture and end-to-end data flow. Explain component responsibilities, interfaces, storage choices, scaling limits, failure modes, and the most important tradeoffs.
At a high level, this project is a real-time analytics platform. The main challenge is processing continuous event traffic quickly while keeping reports useful and reliable. I would explain it in three flows: ingestion, processing, and serving. Data enters through the API Gateway and Kafka. Flink and Spark prepare it for the Data Lake, Data Warehouse, and Redis cache. APIs, dashboards, and alerts then use the results. The main trade-off is freshness versus completeness.
The goal is to collect data from several sources and turn it into useful analytics. The difficult part is handling continuous events while also supporting larger batch jobs. The diagram organizes the solution into ingestion, processing, storage, serving, and shared platform services.
- Which user flows and system capabilities are required for the first version?
- What traffic, data volume, latency, and availability targets should I design for?
- Which consistency, security, geographic, and cost constraints matter most?
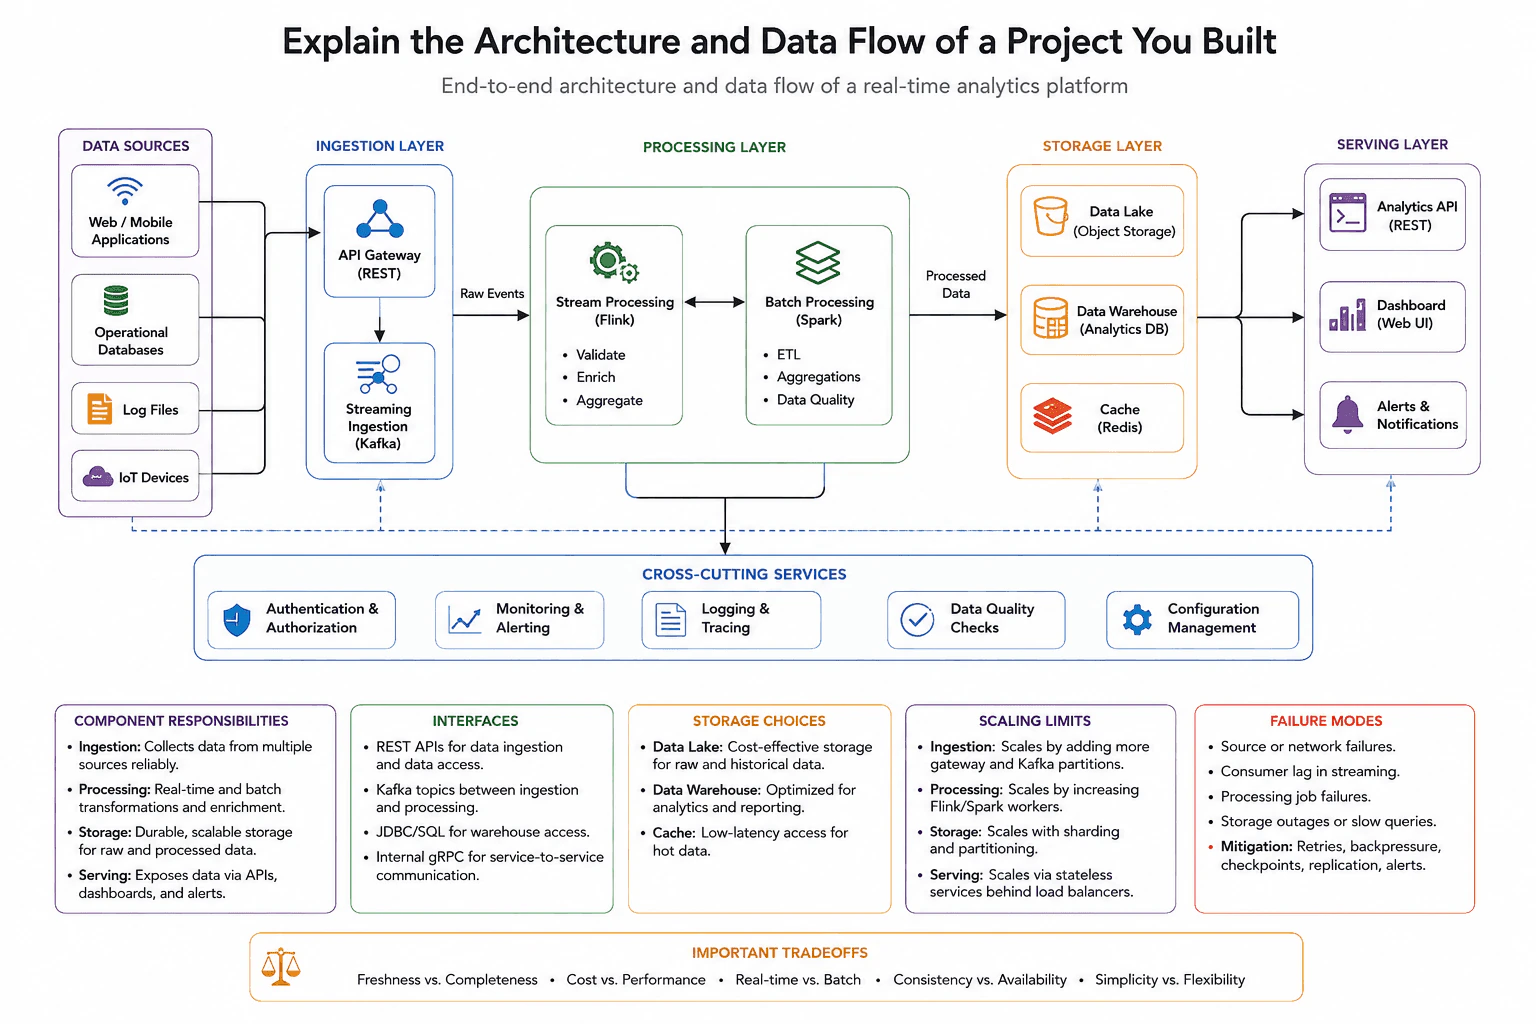
I would start by saying this platform supports real-time and historical analytics. Web and mobile applications, operational databases, log files, and IoT devices produce the input data.
The main path moves from left to right. Data is accepted, processed, stored, and then exposed through APIs, dashboards, and alerts.
For ingestion, web and mobile applications send data through the API Gateway using REST. The gateway provides one entry point for incoming requests.
The gateway sends raw events to Streaming Ingestion, which uses Kafka. Kafka buffers events and separates data producers from processing jobs. This helps the system handle short traffic spikes.
Authentication and Authorization protect access to the platform. Configuration Management keeps shared settings in one place.
Stream Processing uses Flink for live events. It validates records, enriches them with useful details, and creates quick aggregations.
Batch Processing uses Spark for ETL, larger aggregations, and Data Quality work. ETL means reading data, changing it, and loading the result somewhere else. The two processing paths can exchange data when a job needs both live and historical information.
Data Quality Checks find missing or invalid records. Monitoring and Alerting watch job health and delays. Logging and Tracing help engineers follow data through the system.
Processed data moves into the Storage Layer. The Data Lake uses object storage for raw and historical data. The Data Warehouse stores analytics data for SQL queries and reporting.
Redis works as a cache for hot data. Hot data means results that users request often. This reduces repeated work and makes common reads faster.
The serving layer exposes results through the Analytics API, Dashboard, and Alerts and Notifications. JDBC or SQL is used for warehouse access. Internal services can use gRPC for service-to-service communication.
The ingestion layer scales by adding API Gateway capacity and Kafka partitions. Flink and Spark scale by adding more workers. Storage scales through sharding and partitioning. Serving services stay stateless and run behind load balancers.
Important failures include source outages, network problems, Kafka consumer lag, processing job failures, and slow storage. Retries handle temporary errors. Backpressure slows incoming work when downstream systems cannot keep up. Checkpoints help processing jobs restart safely. Replication and alerts improve recovery.
The main trade-off is freshness versus completeness. Live processing gives fast results, while batch processing can produce more complete results. The design also balances cost versus performance, real-time versus batch work, consistency versus availability, and simplicity versus flexibility.
The benefit is that the platform supports both fast updates and deeper batch reports. Flink gives quick results, while Spark handles larger jobs. The downside is that two processing systems are harder to operate. Redis makes common reads faster, but cached results may be slightly old. The Data Lake stores history at lower cost, while the Data Warehouse supports faster reporting. Using both increases cost. We accept these trade-offs because dashboards need speed, while business reports often need more complete data.
Interviewers ask this question to see how you explain a real system from start to finish. They want to know whether you understand data flow, component responsibilities, storage choices, and system limits. They also test how you handle failures and scaling. A strong answer shows practical judgment and explains important trade-offs without hiding behind complex words.