121. Tell me how you would diagnose and fix a slow Python endpoint or background job.
Explain how you would measure latency, profile CPU and memory, inspect database queries and network calls, find blocking work, test changes under load, and verify that an optimization improves the real bottleneck.
I would start by defining what slow means with a measurable target, such as p95 latency for an endpoint or total processing time and queue delay for a background job. Then I would capture a baseline using application metrics, logs, and distributed traces so I can see whether time is spent in Python code, database queries, network calls, queue waits, locks, or resource pools. After narrowing the problem, I would use the right profiler, such as py spy or cProfile for CPU work and tracemalloc for Python memory allocations. I would make one change that targets the measured bottleneck, run the same representative load again, compare the same metrics, verify correctness, and check that the bottleneck did not move to another dependency. The main tradeoff is that profiling and tracing can add overhead, so I would use controlled runs, sampling, or a limited production rollout.
I would begin by defining the symptom and the success metric. For an endpoint, I would usually inspect p50, p95, and p99 latency, throughput, error rate, request queue time, and resource saturation. For a background job, I would separate queue wait time from worker execution time and also inspect retry rate, failure rate, throughput, and completion time. This creates a baseline and prevents me from optimizing code that is not responsible for the real delay.
- What user-visible symptom and measurable performance target define success?
- What workload, environment, data size, and concurrency level should I assume?
- What profiling evidence is available, and which tradeoffs or system changes are allowed?
Next, I would reproduce the problem with representative requests, job payloads, data sizes, dependency behavior, and concurrency. A single fast local request is not enough because production delays may appear only with a large database, multiple workers, connection pool pressure, or many concurrent requests. I would keep the workload stable so that the before and after results are comparable. I would also keep worker count, data state, cache state, warmup period, test duration, and dependency conditions consistent between runs.
I would then break down the execution path using metrics, logs, and distributed tracing. For an endpoint, I would inspect request queue time, middleware, application code, database calls, external network calls, serialization, and response time. For a background job, I would inspect queue delay, worker startup, task code, retries, database calls, external services, locks, batching, and result publication. This helps separate active CPU time from time spent waiting.
If the evidence points to CPU work, I would normally prefer low overhead metrics, tracing, and a sampling profiler such as py spy for a running production process. I would use cProfile and pstats in a controlled environment because deterministic profiling can materially change execution timing. I would look for hot functions, repeated work, inefficient loops, expensive serialization, and algorithms whose cost grows badly with input size. A sampling profiler can miss very short events, so I would treat every profiler result as evidence rather than absolute proof.
If memory is the problem, I would inspect process memory trends and use tracemalloc snapshots to compare Python allocations over time. I would look for retained objects, large temporary objects, allocation churn, unbounded caches, growing queues, and data loaded fully into memory. I would compare tracemalloc results with process level resident memory because native extensions, allocator behavior, and child processes may increase memory without appearing fully in Python allocation snapshots.
If database time is high, I would inspect query logs, query count, execution plans, indexes, result size, transaction contention, and connection pool wait time. Common issues include repeated queries, missing indexes, selecting too much data, long transactions, and a pool that is too small or already saturated. If network time is high, I would inspect timeout values, connection reuse, payload size, retries, remote service latency, and whether independent calls can be safely combined or run concurrently.
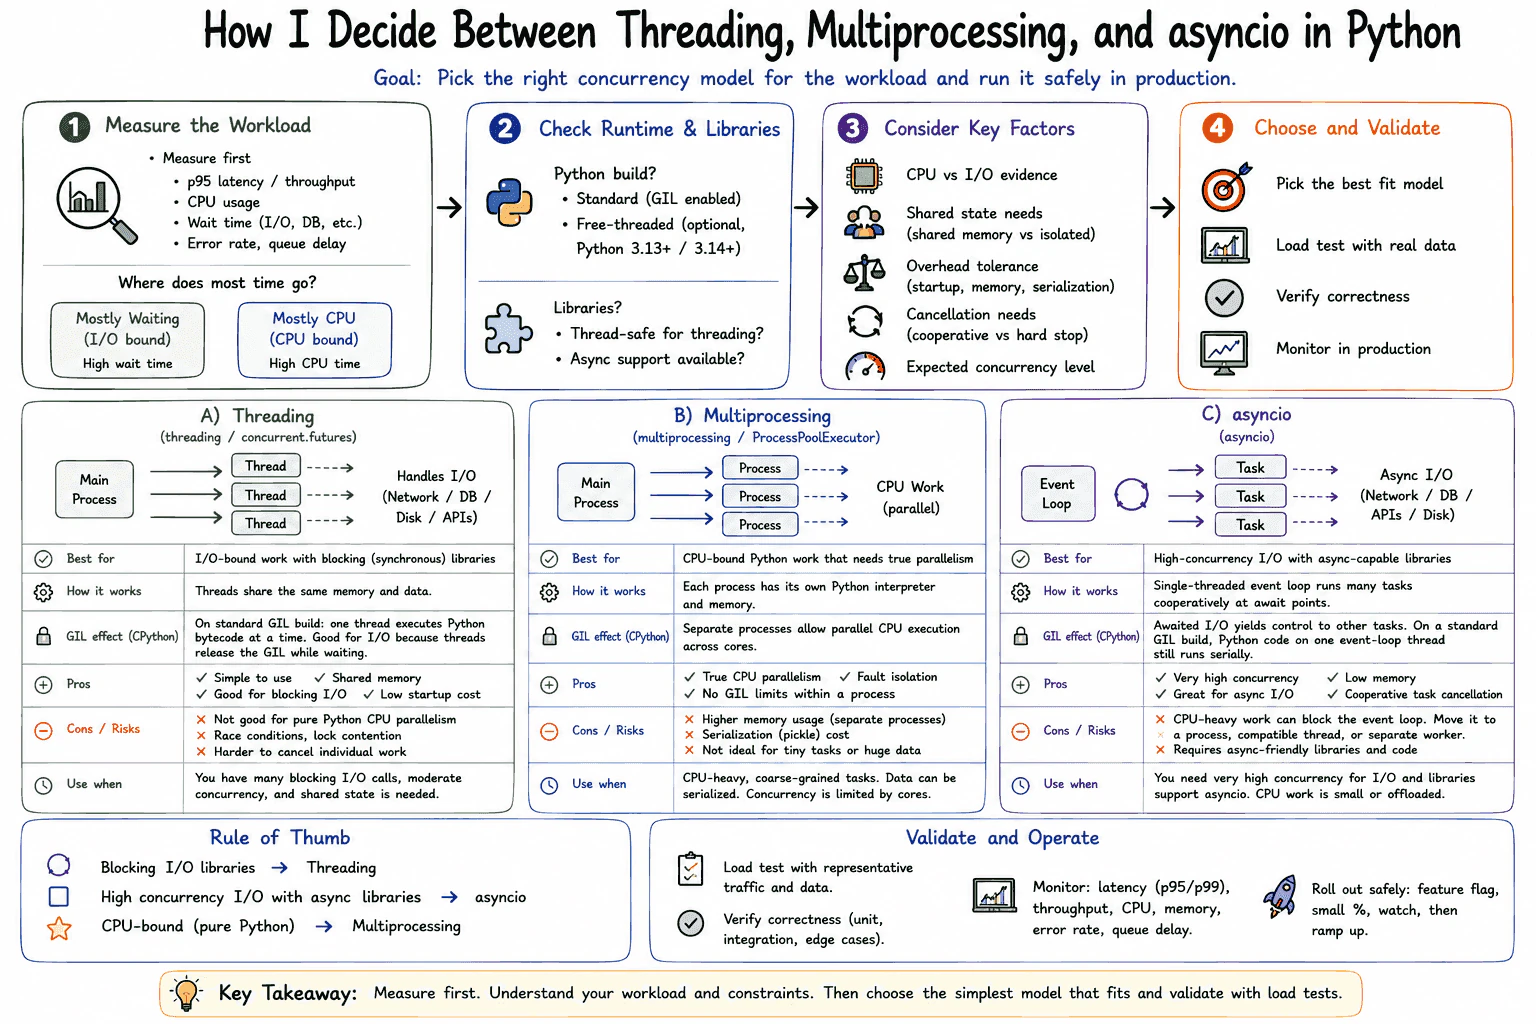
I would also look for blocking work. In synchronous code, this may appear as thread pool starvation, lock contention, or long blocking calls. In asyncio code, a synchronous database driver, blocking file operation, CPU heavy loop, or time.sleep call can block the event loop and delay unrelated requests. An awaited asyncio.sleep normally yields control and does not block the event loop. Event loop lag and task timing can help confirm this. The fix may be an async compatible library, moving CPU work to a process, using an executor for controlled blocking work, or reducing the work itself.
After identifying the bottleneck, I would make one evidence based change. Examples include improving a query, removing repeated calls, batching operations, reducing serialization, streaming large results, changing an algorithm, adding a bounded cache, tuning a connection pool, or moving CPU intensive work to a process. I would not add more threads, workers, caching, or concurrency without checking resource limits and failure behavior because those changes can increase memory use, create contention, or overload a dependency.
I would verify the change by running the same representative workload and comparing the same baseline metrics. I would check latency percentiles, throughput, CPU, memory, queue delay, errors, pool waits, and dependency timing as relevant. I would also run correctness tests because a faster result is not useful if it is stale, incomplete, duplicated, reordered, or incorrect. Finally, I would check whether the original bottleneck was reduced or simply moved to the database, network, queue, or another worker.
For production validation, I would prefer a staged rollout, canary release, or feature flag when the risk justifies it. I would monitor the same metrics after deployment and be ready to roll back if errors, saturation, memory use, or tail latency become worse. The key idea is to measure first, optimize the proven bottleneck, and verify with the same workload.
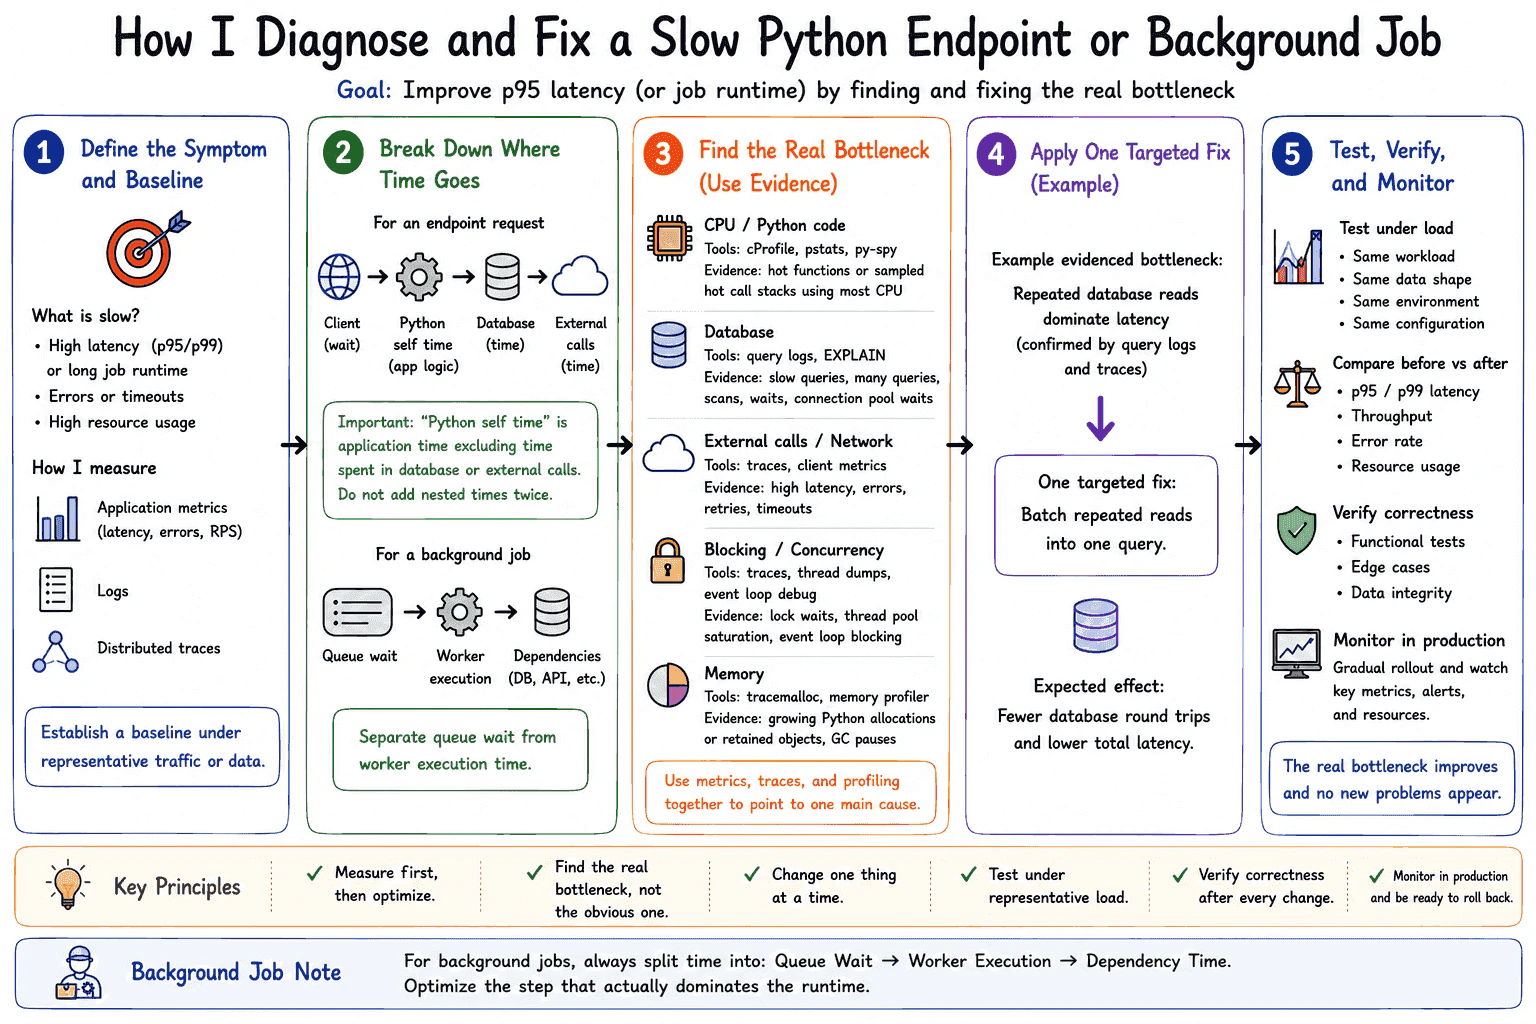
- Define the symptom and success metric. Measure endpoint latency or job queue and execution time.
- Capture a baseline with percentiles, throughput, errors, CPU, memory, saturation, and dependency timing.
- Reproduce the issue with representative requests, data, dependency behavior, and concurrency.
- Use traces, logs, metrics, and query information to divide total time into application work and waiting time.
- Classify the bottleneck as CPU, memory, database, network, disk, queue, lock, pool, or event loop related.
- Use a focused profiler or diagnostic tool that matches the suspected problem.
- Make one evidence based change that directly addresses the measured bottleneck.
- Repeat the same load test and compare the same metrics.
- Verify functional correctness and check whether the bottleneck moved elsewhere.
- Release carefully and monitor the original success metric in production.
There is no single algorithmic complexity for this investigation because the cost depends on the endpoint, job, data size, and dependency behavior. Profiling adds some CPU and timing overhead. Distributed tracing adds instrumentation and storage cost. Load testing uses compute, database connections, network capacity, and engineering time. Some fixes also introduce new costs. Caching uses memory and can serve stale data. More concurrency uses additional connections and can overload downstream systems. Multiprocessing increases process startup, serialization, and memory costs. The correct choice is the smallest change that improves the measured bottleneck without creating an unacceptable reliability or maintenance cost.
Interviewers ask this question to see whether the candidate measures a real production symptom before changing code. They want evidence that the candidate can separate CPU work from waiting on databases, networks, queues, locks, and other dependencies. They also want to know whether the candidate can choose suitable profiling tools, test a change under realistic load, preserve correctness, and verify that the original bottleneck was actually reduced.
A common mistake is changing code before defining the symptom and baseline. Another is using average latency only and missing slow p95 or p99 requests. Candidates may profile unrealistic input, treat a timeit result as proof of service performance, or confuse CPU time with time spent waiting for a database or network call. Other mistakes include ignoring query count and connection pool waits, blocking the asyncio event loop with synchronous input and output, CPU work, or time.sleep, adding unbounded threads or tasks, comparing different workloads before and after the change, and assuming more workers will fix every problem. It is also a mistake to trust one profiler as complete proof, ignore profiler overhead, skip correctness checks, or improve one component while moving the bottleneck to another dependency.
Explain the investigation as a measured sequence. Start with the symptom and baseline, show how you divide total time into CPU and waiting, name the tool that confirms the suspected bottleneck, describe one targeted fix, and finish with the same load test, correctness checks, and production monitoring.