This interview guide is for educational and informational purposes only. It is designed to help readers prepare, but it does not guarantee any interview result, hiring decision, offer, or outcome. Interview questions, hiring criteria, and preferred answers can vary by employer, interviewer, industry, location, and time. All answers, examples, and explanations in this guide are suggested examples for interview preparation, not definitive answers or instructions for professional practice. They are based on research and judgment, are provided without warranties of any kind, and should be adapted to the question, role, and applicable laws and professional requirements. Diagrams are simplified illustrations intended to highlight the main concepts and their relationships; actual situations, systems, and practices may be more complex. Alternative approaches may be equally valid or better suited to a particular question, context, or interviewer. To the fullest extent permitted by applicable law, the contributors and publisher are not liable for decisions made, actions taken, or losses incurred based on this guide.
State Laws and Professional Responsibilities
Laws and requirements governing an occupation vary by state and jurisdiction. You are responsible for checking the current laws, licensing requirements, and scope-of-practice rules that apply to your location and role, and for ensuring that your answers and actions comply with them. Adapt examples in this guide to those requirements. This guide is not legal advice.
Identity, Image, and Privacy Notice
To respect individual privacy, some names, profile photographs, avatars, biographical details, and other identifying information displayed in this guide may be replaced with pseudonyms, licensed stock images, illustrative avatars, composite images, or representative descriptions. Unless a person is expressly identified as an actual contributor, a displayed name, image, or profile should not be understood as depicting or identifying a specific candidate, interviewer, employee, or other real individual. These representations are provided for editorial and illustrative purposes only and do not imply endorsement, employment, participation, or affiliation with this guide or any company mentioned in it. Any resemblance to an actual person is coincidental.
Company Notice
This guide is an independent educational resource and is not affiliated with, endorsed by, sponsored by, or approved by the company named in this guide. Company names identify reported interview experiences or the employer context of clearly labeled original practice exercises. Interview practices can change without notice, and inclusion of company-specific content does not mean these questions are official, complete, or guaranteed to be asked. To the fullest extent permitted by law, the author, contributors, and publisher are not responsible for outcomes related to use of this material.
Content Accuracy and Verification
To the fullest extent permitted by applicable law, we do not represent or warrant that interview guides, questions, answers, examples, or diagrams are accurate, complete, current, error-free, or suitable for any particular purpose. You are responsible for independently reviewing and verifying the information before relying on it.
Questions or comments?
Contact us for general questions, or share feedback, technical corrections, and comments with the community.
1. What is value_counts(), and why do you use it?Data AnalysisEasyAccenture
Short Interview Answer (30-60 seconds)
value_counts() is a pandas method that counts how many times each unique value appears in a Series, such as a DataFrame column. I use it to understand category distributions, find common or rare values, and detect unexpected labels during exploratory analysis. By default, it sorts the counts from most frequent to least frequent and excludes missing values. I can use normalize=True for proportions or dropna=False when I want missing values included.
Detailed Explanation
value_counts() is a pandas method that summarizes how often each distinct value appears in one-dimensional data, such as a DataFrame column selected as a Series. It gives an analyst a quick frequency table without manually grouping and counting rows. This is useful for understanding category distributions, finding dominant or rare values, checking unexpected labels, and spotting possible data-quality issues. By default, Series.value_counts() sorts counts from highest to lowest and excludes missing values. You can include missing values with dropna=False or return proportions instead of counts with normalize=True.
Useful Questions to Ask the Interviewer
Are you asking specifically about pandas Series.value_counts()?
Should missing values be included in the frequency summary?
Do you want raw counts, proportions, or both?
How to Explain It in an Interview
Think of value_counts() as a quick frequency table. If a Series contains repeated values, the method reports each unique value and the number of times it appears. For a DataFrame column, a common pattern is df["column"].value_counts().
The main reason to use it is descriptive analysis. It can quickly answer questions such as which categories are most common, whether one category dominates the data, whether rare categories exist, and whether unexpected values may indicate data-quality problems. For example, if a field is supposed to contain a small set of valid labels, a frequency table can reveal misspellings, inconsistent capitalization, or unusual categories that deserve investigation. I would validate suspicious values against the underlying records before changing or excluding them.
Missing values require deliberate handling. By default, Series.value_counts() uses dropna=True, so missing values are excluded from the returned counts. If missingness itself is important to the analysis, I would use dropna=False so that missing values are visible. That prevents me from accidentally treating a frequency table as a complete description of the column when some observations were omitted.
If percentages are more useful than raw counts, normalize=True returns relative frequencies instead of integer counts. This is especially useful when comparing distributions across populations of different sizes. I would still make the denominator clear because interpretation depends on which observations are included, particularly when missing values are excluded.
By default, the result is sorted by frequency with the most frequent value first. Options such as sort, ascending, normalize, bins, and dropna can change how the result is produced. For numeric data, bins can group values into intervals, although for broader numerical-distribution analysis I would also consider tools designed for continuous data rather than relying only on individual-value counts.
The important analytical distinction is that value_counts() describes what is present in the data; it does not explain why the distribution exists. A high or low frequency can identify a pattern worth investigating, but it is not causal evidence. If the pattern affects a business decision, I would confirm the row grain, population, filtering rules, missingness, and relevant segments before drawing a conclusion.
Technical Approach
Select the Series or DataFrame column whose distribution you want to inspect.
Confirm what one row represents and what population is included.
Decide whether missing values should be counted.
Run value_counts() for raw frequencies.
Use dropna=False if missing values should be visible.
Use normalize=True if proportions are more useful than counts.
Review common, rare, missing, and unexpected values.
Validate suspicious values against the source data before making a business conclusion.
Practical Insights
value_counts() must examine the observations being counted, so more rows require more work. It also needs space to track distinct values. When sorting is enabled, pandas also sorts the resulting frequency table, which adds work when there are many unique values. For ordinary categorical columns it is concise and practical, but a very high-cardinality column can produce a large result that is harder to interpret.
Why Interviewers Ask This
The interviewer is checking whether you understand a common pandas profiling method and whether you can explain how simple frequency counts support exploratory analysis and data-quality validation rather than just recalling syntax.
Common interview mistakes
Common mistakes include forgetting that missing values are excluded by default, interpreting counts without confirming the row grain or population, comparing raw counts across groups of very different sizes when proportions would be clearer, overlooking inconsistent labels such as spelling or capitalization differences, and treating a frequency pattern as proof of its cause.
Interview tip
Start with a one-sentence definition, then explain two practical uses such as understanding distributions and checking data quality. Mention normalize=True and dropna=False to show that you understand both the basic method and important interpretation details.
Interviewer may ask next
How would you include missing values and show percentages instead of raw counts?
I would use value_counts(dropna=False, normalize=True). dropna=False includes missing values in the result, while normalize=True returns relative frequencies instead of raw counts. I would also state clearly which observations form the denominator so the percentages are interpreted correctly.
When might value_counts() be less useful, and what would you do instead?
It is less useful as a standalone summary when a column has very high cardinality, because the result may contain many unique or nearly unique values and become difficult to interpret. I would return to the analytical question and consider grouping meaningful categories, examining only the most frequent values, binning appropriate numeric data, or using a targeted groupby or segmentation. Any grouping should be validated so it does not hide important distinctions.
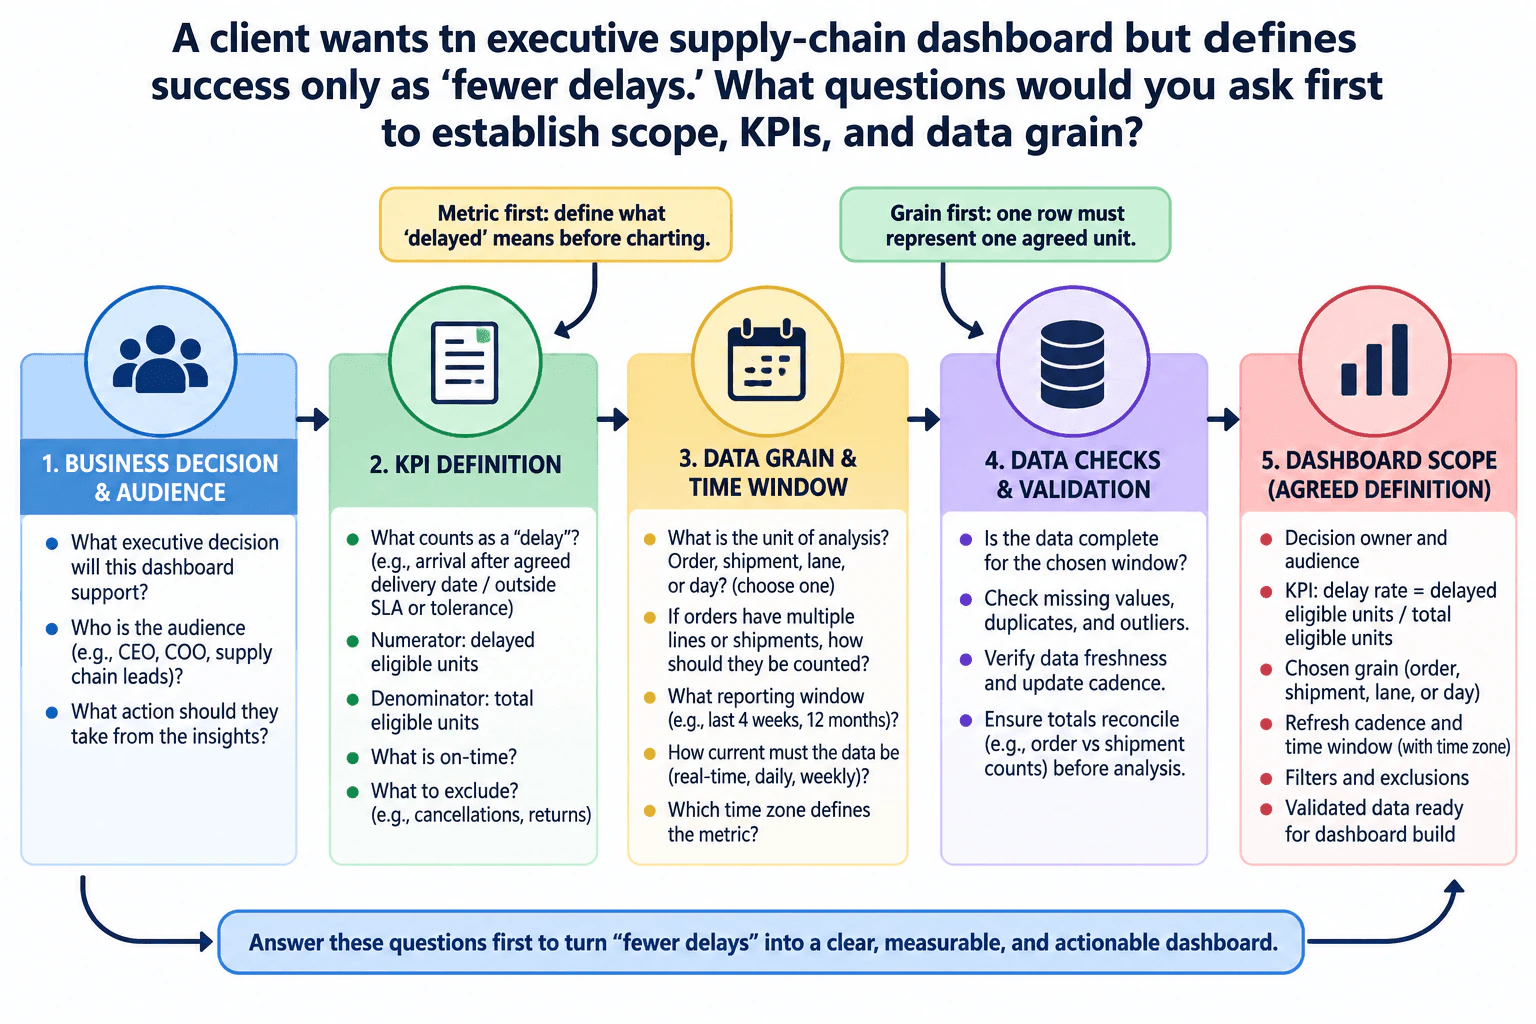
2. A client wants an executive supply-chain dashboard but defines success only as “fewer delays.” What questions would you ask first to establish scope, KPIs, and data grain?Data AnalysisEasyAccenture
i Question Details
Cover the business decision, audience, refresh cadence, KPI numerator and denominator, exclusions, time window, and whether the grain is order, shipment, lane, or day.
Short Interview Answer (30-60 seconds)
I would start with the business decision, not the dashboard tool. I would ask what executive decision the dashboard should support, who will use it, and what action they should take. Then I would define exactly what counts as a delay, including the eligible population, numerator, denominator, on-time rule, and exclusions. Next I would agree on the grain—order, shipment, lane, or day—the reporting window, time zone, and refresh cadence. Finally, I would check completeness, missing values, duplicates, outliers, freshness, and reconciled totals before building the dashboard.
Detailed Explanation
The main problem is that “fewer delays” is not yet a measurable dashboard requirement. Before building anything, I need to understand what decision executives will make and turn “delay” into a precise KPI. I would define the eligible population, numerator, denominator, on-time rule, and exclusions. I would also agree on the analytical grain, reporting window, time zone, and refresh cadence. Finally, I would validate completeness, missing values, duplicates, outliers, freshness, and reconciled totals so every dashboard view uses one consistent, trusted definition.
Useful Questions to Ask the Interviewer
What executive decision should this dashboard support?
Who is the audience, and what action should they take from the dashboard?
What exactly counts as a “delay,” such as arrival after an agreed delivery date or outside an agreed service tolerance?
What is the eligible population for the KPI?
What belongs in the numerator: delayed eligible units at the agreed grain?
What belongs in the denominator: all eligible units from the same population and reporting window?
What counts as “on time”?
What should be excluded, such as cancellations, returns, or other agreed exceptions?
What should the analytical grain be: order, shipment, lane, or day?
If an order contains multiple lines or shipments, how should it be counted so the KPI does not mix grains or double-count business events?
What reporting window should the dashboard cover?
Which time zone defines the reporting boundary and delay calculation?
How current must the data be, and what refresh cadence is required: near real time, daily, weekly, or another agreed interval?
Is the data complete for the selected window, and are missing values, duplicates, outliers, or stale records present?
Can control totals be reconciled across relevant levels, such as order and shipment counts, before the KPI is published?
How to Explain It in an Interview
I would organize the analysis into the same five-step flow shown in the diagram.
First, I would clarify the business decision and audience. The dashboard should support a specific executive decision rather than simply display supply-chain data. I would ask who owns the decision, who will use the dashboard, and what action they are expected to take from the insight.
Second, I would define the KPI before charting it. “Fewer delays” is ambiguous until the business defines what counts as delayed and on time. I would identify the eligible population, the numerator of delayed eligible units, the denominator of total eligible units, and any exclusions. If the chosen KPI is a delay rate, its conceptual definition is delayed eligible units divided by total eligible units for the same population, grain, and reporting window.
Third, I would establish the data grain and time window. Grain means the level represented by one agreed analytical unit. The client must choose whether the dashboard measures orders, shipments, lanes, or days. This matters because an order can contain multiple shipments, so mixing levels can create double counting or misleading rates. I would also define the reporting window, the time zone used for date boundaries, and how often the data must refresh.
Fourth, I would perform data checks and validation. I would confirm that the selected reporting window is complete, check missing values, duplicates, and outliers, verify data freshness and update cadence, and reconcile totals across relevant levels before analysis. These checks protect both the numerator and denominator from incomplete or duplicated records.
Fifth, I would document the agreed dashboard scope. That definition should include the decision owner and audience, the exact delay KPI, the chosen grain, refresh cadence, reporting window and time zone, filters and exclusions, and the validation checks required before publication.
The key Finding Logic is that “fewer delays” cannot be interpreted reliably until the business fixes the metric definition, eligible population, grain, denominator, window, and exclusions. Different valid definitions can produce different results, so those choices must be explicit rather than assumed. Once the definitions and data checks are stable, trend analysis or drill-down views can be added without changing the meaning of the executive KPI.
Technical Approach
Clarify the executive decision, decision owner, audience, and expected action.
Define what counts as delayed and on time for an agreed eligible population.
Define the KPI numerator, denominator, and exclusions using the same population and reporting window.
Choose one consistent analytical grain: order, shipment, lane, or day, and define how multi-line or multi-shipment cases are counted.
Agree on the reporting window, time zone, and refresh cadence.
Validate completeness, missing values, duplicates, outliers, freshness, and reconciled totals.
Document the final dashboard scope before interpreting trends or publishing the KPI.
Practical Insights
There is no meaningful algorithmic time or space complexity because this is a requirements and measurement-design task rather than a coding problem. The main tradeoff is detail versus simplicity: a finer grain supports better drill-down and diagnosis but requires more careful counting and data-quality controls, while a coarser executive view is easier to read but can hide important differences. A faster refresh cadence also creates more operational and validation work, especially when source systems update at different times.
Why Interviewers Ask This
The interviewer is testing whether I can turn a vague business goal into a precise, measurable dashboard requirement before analyzing or visualizing data. They want to see whether I clarify the decision and audience, define the KPI population and calculation, choose a consistent analytical grain, establish the reporting window and refresh cadence, identify exclusions, and verify that the underlying data is trustworthy.
Common interview mistakes
Common mistakes are starting with charts or tools before clarifying the decision; treating “delay” as self-explanatory; defining a numerator without an eligible denominator; mixing order and shipment grain; counting multi-shipment orders inconsistently; ignoring exclusions; comparing periods that use different definitions; omitting the reporting window or time zone; choosing a refresh cadence without checking data freshness; and publishing the KPI before checking missing records, duplicates, outliers, and reconciliation totals.
Interview tip
Present the answer in this order: business decision and audience, KPI definition, data grain and time window, data checks, then agreed dashboard scope. Explicitly say that you would define the metric before charting it and use one agreed grain throughout the analysis.
Interviewer may ask next
What would you do if one order has several shipments and only one shipment arrives late?
I would first confirm whether the KPI is defined at order grain or shipment grain. At shipment grain, each eligible shipment can be evaluated against its own agreed timing rule. At order grain, stakeholders must define how shipment outcomes roll up to the order, such as whether any late shipment makes the order late or whether another documented rule applies. I would use only the agreed rule, test multi-shipment cases, and reconcile order and shipment counts so the numerator and denominator never mix grains.
What if executives want a near-real-time dashboard but some source data updates only once per day?
I would make the source limitation explicit rather than presenting the KPI as more current than the data allows. I would identify the effective data timestamp, confirm whether daily freshness is acceptable for the executive decision, and align the dashboard refresh cadence with the available source data. If near-real-time data is truly required, the source process must change first. Until then, I would display or document the latest completed update and avoid comparing incomplete current-period data with fully settled historical periods without a comparable cutoff.
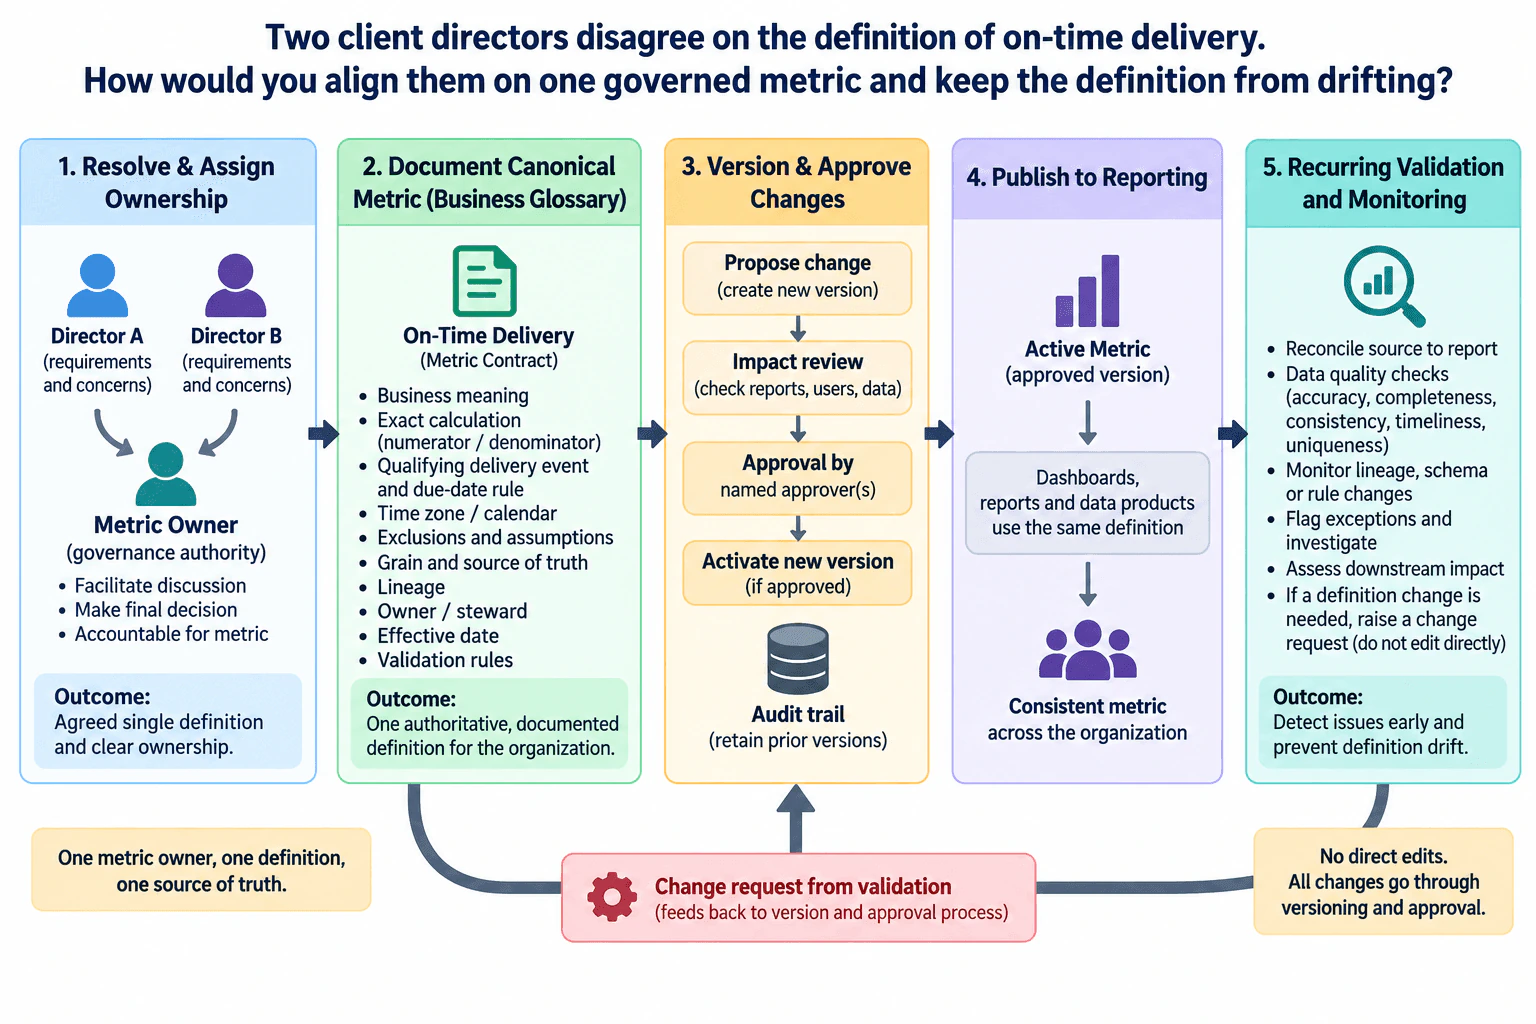
3. Two client directors disagree on the definition of on-time delivery. How would you align them on one governed metric and keep the definition from drifting?Data Quality And ValidationMediumAccenture
I would first make the decision process explicit: both directors provide requirements and concerns, but one named metric owner has governance authority and is accountable for the final definition. I would document on-time delivery as a metric contract covering the business meaning, exact numerator and denominator, qualifying delivery event, due-date rule, time zone and calendar, exclusions, assumptions, grain, source of truth, lineage, owner or steward, effective date, and validation rules. Any change creates a new version, goes through impact review and named approval, and leaves an audit trail. Only the approved version is published to reports. Then I would run recurring reconciliation, data-quality, lineage, and exception checks, and route any needed definition change back through the same approval process rather than editing it directly.
Detailed Explanation
The task is to turn a disagreement about on-time delivery into one governed metric that everyone uses the same way. I would give one metric owner clear decision authority, bring both directors together to agree the business meaning, and document the definition as a metric contract. That contract should state the calculation, qualifying delivery event, due-date rule, time zone, calendar, exclusions, assumptions, grain, source of truth, lineage, owner, effective date, and validation rules. Then I would control every change through versioning, approval, an audit trail, publication of only the active version, and recurring validation.
Useful Questions to Ask the Interviewer
Who has final decision authority for this metric if the directors cannot agree?
What business event counts as delivery, and what event or commitment defines the due date?
What population belongs in the denominator, and which exclusions are legitimate?
Which source system is authoritative for the delivery event and due-date information?
What row grain should the metric use, and what time zone and business calendar apply?
Which reports, dashboards, decisions, or downstream users would be affected by a definition change?
Who must approve a new metric version, and how should effective dates and prior versions be retained?
What recurring validation cadence and alerting process already exists, if any?
How to Explain It in an Interview
I would use one end-to-end governance flow.
1. Resolve the disagreement and assign ownership. I would facilitate a working session with both directors and the relevant data or operational stakeholders. The goal is not to average two definitions. It is to expose the decision points: what event counts as delivered, what commitment date is compared against it, which records are in scope, how boundary dates are handled, and which time zone or calendar applies. Both directors contribute requirements and risks, but one named metric owner must have final governance authority. That avoids a permanent two-definition compromise and creates accountability.
2. Write one canonical metric contract. The agreed definition becomes the single source of truth in governed documentation. I would record the business meaning; exact numerator and denominator; qualifying delivery event and due-date rule; time zone and calendar; exclusions and assumptions; row grain; source of truth; data lineage; owner or steward; effective date; and validation rules. I would also record known data limits. This makes the definition reproducible instead of dependent on memory or a dashboard author's interpretation.
3. Make calculation and boundary rules explicit. I would not invent the actual on-time-delivery formula before the stakeholders agree it. Once agreed, I would state exactly which records can enter the numerator and denominator and how null dates, duplicates, late-arriving records, cancelled or excluded records, and boundary timestamps are treated. If a record violates a documented rule, it should not be silently dropped, overwritten, imputed, or repaired. It should follow an auditable exception or quarantine rule with a recorded reason.
4. Version every definition change. Direct edits to the active definition should be prohibited. A proposed change creates a new version. The change request should state the reason, affected logic, effective date, impacted reports or users, data implications, and migration need. Prior versions remain available so historical results can be explained and reproduced.
5. Require impact review and named approval. Before activation, I would assess which dashboards, reports, data products, decisions, and downstream calculations use the metric. The named approver or approval group then accepts or rejects the version. The audit trail should show what changed, who approved it, and when it became effective. Only an approved version becomes active.
6. Publish only the approved version to reporting. Dashboards, reports, and data products should use the same governed definition rather than recreating local logic. If different business contexts genuinely require different metrics, they should receive different names and contracts instead of silently changing the meaning of "on-time delivery."
7. Validate the metric from source to report. Recurring validation checks whether the published metric still behaves as documented. I would reconcile source and report row counts or control totals where meaningful, profile nulls, duplicates, ranges, and unexpected categories, validate keys and referential integrity where applicable, and compare the output with the authoritative source. Reconciliation means confirming that records and key totals carried through the transformation agree with the source within the documented boundary.
8. Use data-quality dimensions as diagnostic checks. Completeness asks whether required records or fields are present. Accuracy asks whether values reflect the authoritative source. Consistency asks whether the same rule produces the same meaning across reports. Validity asks whether values satisfy allowed formats and business rules. Uniqueness checks that records expected to be unique are not duplicated. Timeliness checks whether data arrives within the agreed reporting window. These checks support the governed metric; they do not redefine it.
9. Trace failures through lineage. If the metric changes unexpectedly, I would trace the lineage from the report back through transformations to the source system. That helps separate a source defect from a transformation defect or an unauthorized definition change. Schema changes, rule changes, broken joins, or altered source fields should trigger investigation rather than silent adaptation.
10. Handle exceptions and downstream impact. Failed quality rules should create an exception record or report with the reason, owner, and affected metric or report. I would assess whether the issue could change a business decision. If the metric cannot be trusted, the safe response is to flag or pause the affected output rather than publish a number that looks authoritative.
11. Prevent definition drift. I would monitor lineage, schema changes, rule changes, recurring quality results, and metric usage. If validation shows that the definition itself must change, the request loops back to versioning, impact review, and approval. No one edits the active metric directly. This preserves one accountable owner, one canonical definition, one approved active version, and a controlled feedback loop.
The main tradeoff is governance speed versus stability. Strong change control adds review work, but it prevents silent metric drift, conflicting executive reports, and unexplained historical changes. The process should therefore be strict enough to protect decision quality while keeping the approval path clear and practical.
Technical Approach
Name one metric owner with final governance authority.
Facilitate agreement on the business event, due-date rule, scope, grain, source of truth, time zone, calendar, exclusions, and denominator.
Document the agreed metric contract, lineage, ownership, effective date, assumptions, and validation rules.
Require each proposed change to create a new version.
Perform impact review across reports, users, data products, and downstream decisions.
Obtain named approval and retain an audit trail and prior versions.
Publish only the approved active version to reporting.
Run recurring source-to-report reconciliation, data profiling, key and integrity checks, and lineage monitoring.
Record and investigate exceptions and assess downstream decision impact.
Route any needed definition change back through versioning and approval instead of direct editing.
Practical Insights
This is mainly a governance and validation cost rather than a coding-complexity problem. The upfront work is stakeholder alignment, documentation, lineage review, and impact analysis. Recurring cost comes from quality checks, reconciliation, exception investigation, and approval of changes. More control adds process overhead, but it reduces the larger risk of inconsistent reports, silent definition drift, and historical results that cannot be explained.
Why Interviewers Ask This
This tests whether the analyst can resolve a business-definition conflict, establish clear decision ownership, turn the agreed definition into governed documentation, control changes, and validate the metric repeatedly so dashboards do not drift into inconsistent versions.
Common interview mistakes
Common mistakes are letting both directors keep separate definitions under the same metric name; choosing a formula before resolving the business meaning and denominator; leaving ownership ambiguous; documenting only the formula but not grain, source, time zone, exclusions, lineage, or effective date; overwriting a definition without version history; allowing dashboard authors to make local edits; approving a change without checking downstream impact; validating only the final number instead of reconciling source-to-report data; silently dropping or repairing bad records; and treating a schema or lineage change as harmless without investigation.
Interview tip
Frame the answer as a governance loop: one accountable owner, one canonical metric contract, versioned and approved changes, one active published version, recurring source-to-report validation, and a feedback path that sends any needed change back through approval. That shows both stakeholder judgment and data-quality discipline.
Interviewer may ask next
What would you do if the two directors still cannot agree on whether a specific delivery event belongs in the metric?
I would make the disputed event an explicit decision point rather than hide it in the calculation. I would show how each interpretation changes scope, numerator, denominator, affected reports, and business decisions, then ask the named metric owner to make the final governed decision using the agreed business objective. I would document the chosen rule, the rejected alternative, the rationale, the effective date, and any known limitation. If both interpretations are genuinely needed for different decisions, I would create two clearly named metrics with separate contracts instead of using one ambiguous metric name.
What if validation shows that the source system changed and the current metric can no longer be reproduced exactly?
I would treat that as a governed exception, not silently modify the metric. I would identify the source or transformation break through lineage, determine which reports and periods are affected, flag or pause the output if it is no longer trustworthy, and record the evidence. If a new calculation or source mapping is required, I would raise a change request, create a new metric version, perform impact review and regression validation, obtain named approval, set an effective date, and retain the prior version and audit trail so historical differences remain explainable.
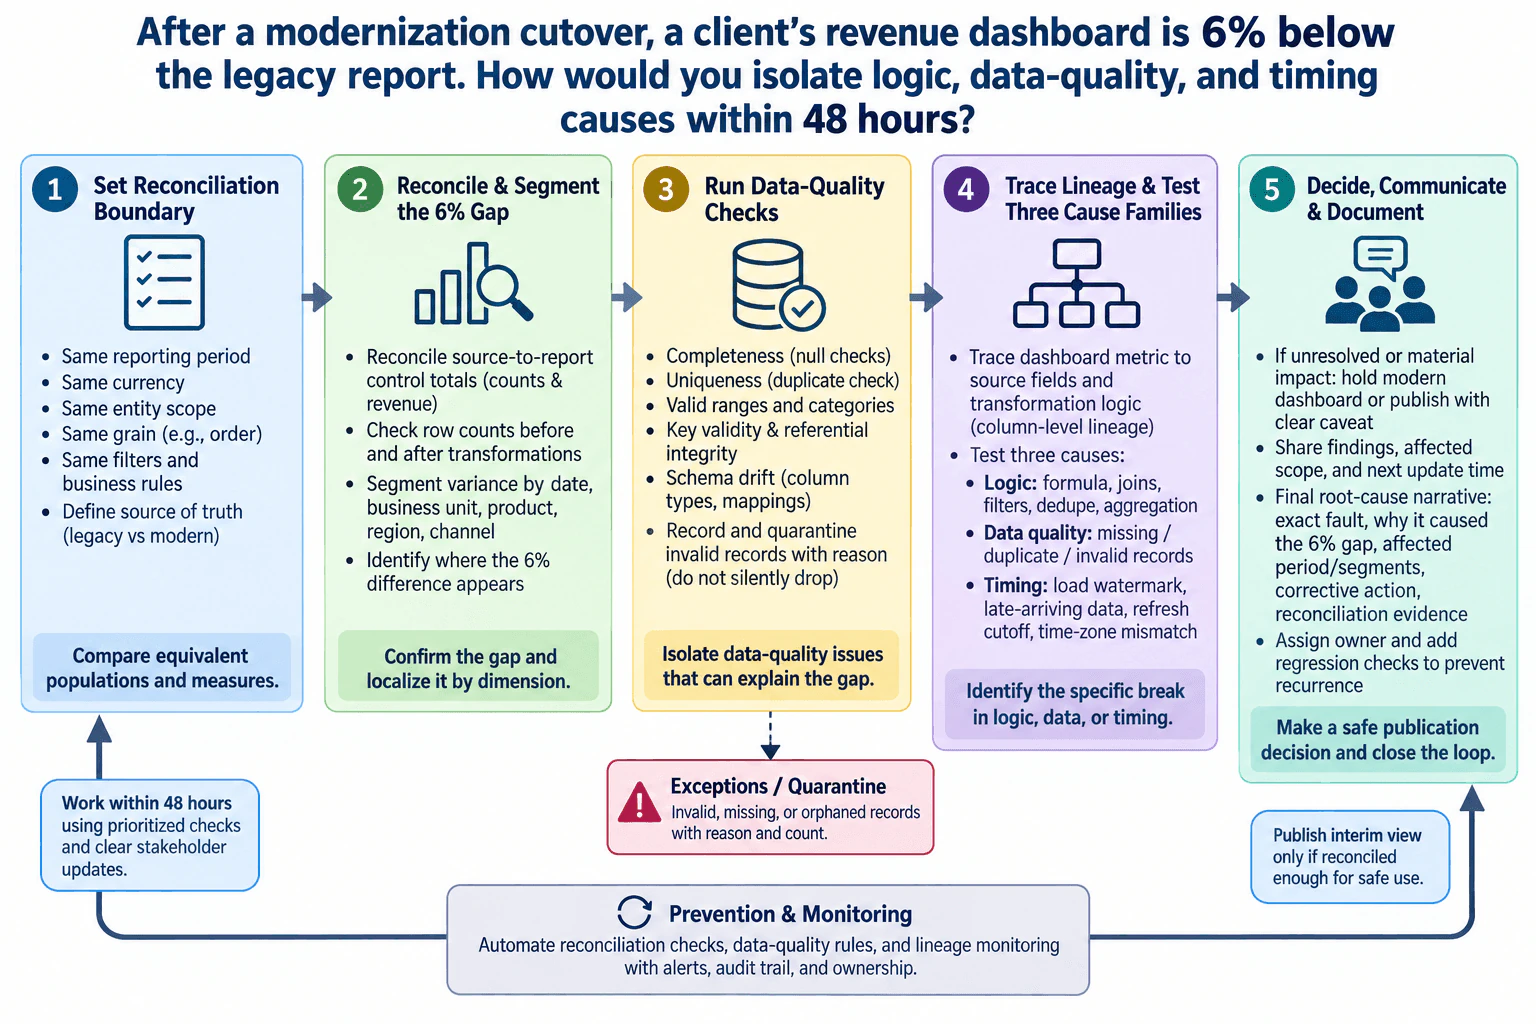
4. After a modernization cutover, a client’s revenue dashboard is 6% below the legacy report. How would you isolate logic, data-quality, and timing causes within 48 hours?Data Quality And ValidationHardAccenture
i Question Details
Describe reconciliation checks, segmentation, lineage review, stakeholder updates, interim publication decisions, and the final root-cause narrative.
Short Interview Answer (30-60 seconds)
I would first make the legacy and modern reports directly comparable: same reporting period, currency, entity scope, grain, filters, business rules, and agreed source of truth. Then I would reconcile row counts and revenue control totals and segment the 6% gap by date, business unit, product, region, and channel to find where it appears. I would profile nulls, duplicates, invalid ranges, categories, keys, referential integrity, and schema drift, quarantining bad records instead of silently dropping them. Next I would trace the affected metric through lineage and test logic, data-quality, and timing causes such as joins, filters, aggregation, late-arriving data, refresh cutoffs, and time zones. I would give stakeholders frequent evidence-based updates, hold or clearly caveat publication if the result is not safe, and finish with the exact root cause, affected scope, corrective action, reconciliation evidence, owner, and prevention checks.
Detailed Explanation
The task is to explain why the modern revenue dashboard is 6% below the legacy report and make a safe reporting decision within 48 hours. I would not assume either report is correct. I would first make both reports comparable, then localize the difference, test data-quality problems, trace the metric through its lineage, and separate logic defects from timing differences. Every conclusion should be supported by reconciliation evidence. Invalid records should be quarantined with reasons rather than silently removed, and stakeholders should receive clear updates about impact, uncertainty, publication status, and next steps.
Useful Questions to Ask the Interviewer
What system or report is the agreed source of truth during the cutover, and is the legacy report authoritative or only a comparison baseline?
Are both reports expected to use the same revenue definition, reporting period, currency, entity scope, row grain, filters, and business rules?
What are the refresh schedules, cutoff times, time zones, and rules for late-arriving or backfilled data in each system?
Can I access source-to-report lineage, transformation logic, schema-change history, quality-rule results, and row-level exception data?
Which business segments and downstream decisions are most sensitive to the discrepancy, and who owns the publication decision?
How to Explain It in an Interview
I would structure the investigation as a five-step validation plan and keep an audit trail of every check, assumption, exception, and decision.
Set the reconciliation boundary. Before comparing numbers, I would confirm that the two outputs represent equivalent populations and measures. That means matching the reporting period, currency, entity scope, row grain, filters, and revenue business rules, and identifying the agreed source of truth. If these boundaries differ, part or all of the 6% variance could come from a comparison mismatch rather than a defect. I would record any unresolved assumption because it limits how strongly I can interpret later comparisons.
Reconcile and segment the 6% gap. Reconciliation means comparing equivalent counts and control totals from source to report. I would reproduce both revenue totals using the same boundary, compare row counts before and after major transformations, and reconcile revenue at progressively finer levels. I would segment the variance by dimensions supported by the data, such as date, business unit, product, region, and channel. The purpose is to identify where the difference first becomes concentrated. A variance isolated to one period or segment provides a much smaller search area than the dashboard-wide 6% difference. I would not infer a cause from the aggregate variance alone.
Run data-quality checks. Data quality asks whether the records are fit for the reporting decision. Completeness asks whether expected records or required values are missing. Accuracy asks whether values correctly represent the intended source facts. Consistency asks whether the same concept is represented compatibly across systems and transformations. Validity asks whether values conform to defined formats, domains, ranges, and rules. Uniqueness asks whether records that should appear once are duplicated. Timeliness asks whether required data arrived and was processed within the expected reporting window.
I would profile nulls, duplicates, valid ranges, unexpected categories, key validity, referential integrity, and schema drift such as changed column types or mappings. I would compare row counts across transformation stages to identify where records appear, disappear, or multiply. Invalid, missing, or orphaned records that matter to the investigation would be recorded in an exception report or quarantine with a reason and count. I would not silently delete, overwrite, or impute them because doing so would hide evidence and weaken the audit trail.
Trace lineage and test the three cause families. Data lineage is the path from the dashboard metric back through transformations to its source fields. I would trace the revenue metric at column and transformation level and identify the first point where the modern path diverges from the validated comparison.
For a logic cause, I would compare formulas, joins, filters, deduplication rules, mappings, and aggregation logic. A changed join type, filter condition, grain, or aggregation can change revenue even when the underlying source records are correct.
For a data-quality cause, I would look for missing, duplicated, invalid, orphaned, or incorrectly mapped records and determine whether their affected totals explain part of the discrepancy. I would distinguish defects already present in the source from defects introduced during ingestion or transformation.
For a timing cause, I would compare load watermarks, refresh cutoffs, processing windows, late-arriving records, backfills, and time-zone treatment. If one report includes transactions that the other has not yet loaded, the reports may temporarily disagree even when both pipelines are logically correct.
The three cause families can coexist, so I would quantify only what the available reconciliation evidence supports rather than forcing the full 6% into one category.
Decide, communicate, and document. I would provide stakeholder updates throughout the 48-hour window that state what has been checked, where the variance is concentrated, what is confirmed, what remains uncertain, which decisions may be affected, and when the next update will arrive. I would clearly separate observations from hypotheses.
For interim publication, I would use a safe-failure approach. If the discrepancy remains material or unexplained for the intended decision, I would recommend holding the modern dashboard. If enough of the output has been reconciled for a clearly bounded use case, I could recommend publishing that view with an explicit caveat describing the affected scope and known limitation. The decision should depend on reconciliation evidence and downstream impact, not simply on the 48-hour deadline.
The final root-cause narrative should state the exact fault or combination of faults, where it occurred in the lineage, why it changed the reported revenue, which periods or segments were affected, what corrective action was taken, and what reconciliation evidence confirms recovery. It should also document assumptions, known limits, and ownership so the conclusion is no stronger than the evidence.
Finally, I would close the loop with prevention and monitoring. I would automate appropriate source-to-report reconciliation checks, row-count controls, data-quality rules, schema-change checks, and lineage monitoring; define alerts and owners; retain exception and recovery evidence; and add regression checks for the failure mode found. That turns the incident into an auditable control rather than a one-time manual correction.
Technical Approach
Freeze the reconciliation boundary: reporting period, currency, entity scope, row grain, filters, business rules, and source of truth.
Reproduce both revenue totals and reconcile row counts and source-to-report control totals.
Segment the 6% variance by supported dimensions such as date, business unit, product, region, and channel to localize the difference.
Profile nulls, duplicates, ranges, categories, keys, referential integrity, and schema drift; record and quarantine invalid records with reasons.
Trace the affected metric through column-level lineage and transformation stages.
Test logic causes including formulas, joins, filters, deduplication, mappings, and aggregation.
Test data-quality causes by identifying missing, duplicate, invalid, orphaned, or incorrectly mapped records and distinguishing source defects from transformation defects.
Test timing causes including watermarks, late-arriving data, refresh cutoffs, backfills, and time-zone differences.
Keep stakeholders updated with confirmed findings, uncertainty, affected scope, and the next update time.
Decide whether to hold the dashboard or publish a bounded interim view with a clear caveat based on reconciliation evidence and downstream impact.
Produce a root-cause narrative with fault, affected scope, corrective action, reconciliation evidence, assumptions, and ownership.
Add automated reconciliation, data-quality rules, lineage monitoring, alerts, regression checks, and an audit trail.
Practical Insights
The main cost is investigation breadth rather than algorithmic complexity. A full row-by-row comparison across a large dataset can be expensive, so I would start with control totals and row counts, then segment the variance to reduce the search space before drilling into individual records. Data profiling and lineage review add compute and analyst time, but they provide stronger evidence than checking only dashboard totals. The 48-hour constraint favors prioritized and parallel checks, while the publication decision trades speed against the risk of exposing decision makers to an unexplained number.
Why Interviewers Ask This
This tests whether the analyst can investigate a material reporting discrepancy quickly without guessing, separate logic, data-quality, and timing causes, protect decision makers from unreliable numbers, communicate uncertainty clearly, and leave behind auditable controls that reduce the chance of recurrence.
Common interview mistakes
Common mistakes are treating the legacy report as automatically correct; comparing different periods, grains, currencies, filters, or business definitions; investigating only the aggregate 6% instead of segmenting it; checking dashboard logic without checking source data and timing; ignoring row-count changes across transformations; silently dropping or repairing invalid records; failing to distinguish source defects from transformation defects; assuming late-arriving data is a logic bug; publishing an unresolved material discrepancy without a clear caveat; giving stakeholders hypotheses as facts; and correcting the incident without adding regression checks, alerts, ownership, and an audit trail.
Interview tip
Present the investigation as a narrowing funnel: make the reports comparable, localize the 6% gap, test data quality, trace lineage to separate logic, data, and timing causes, then make a safe publication decision. Emphasize evidence, stakeholder communication, and prevention rather than guessing the root cause.
Interviewer may ask next
What if the two dashboards reconcile at the daily total but differ for some business segments?
I would treat that as evidence that the overall total is hiding offsetting segment-level differences. I would compare the same dimensions at the same grain and look for mapping changes, joins, filters, duplicates, missing keys, unexpected categories, and allocation logic that move revenue between segments without changing the total. I would also check whether dimensional definitions changed during modernization. The segment discrepancy should remain unresolved until lineage and row-level evidence explain where records were assigned differently, even though top-line revenue reconciles.
What would you do if 48 hours expire and the root cause is still not fully proven?
I would not turn an unproven hypothesis into a final conclusion. I would summarize what is confirmed, what remains uncertain, the affected scope, the checks already completed, and the next tests required. If the unexplained difference could materially affect decisions, I would recommend holding the modern dashboard. If a clearly bounded portion has been reconciled and is safe for a specific use, I could recommend limited publication with an explicit caveat. I would assign an owner and next update time, preserve the audit trail and exceptions, and continue until the root cause and recovery evidence are complete.
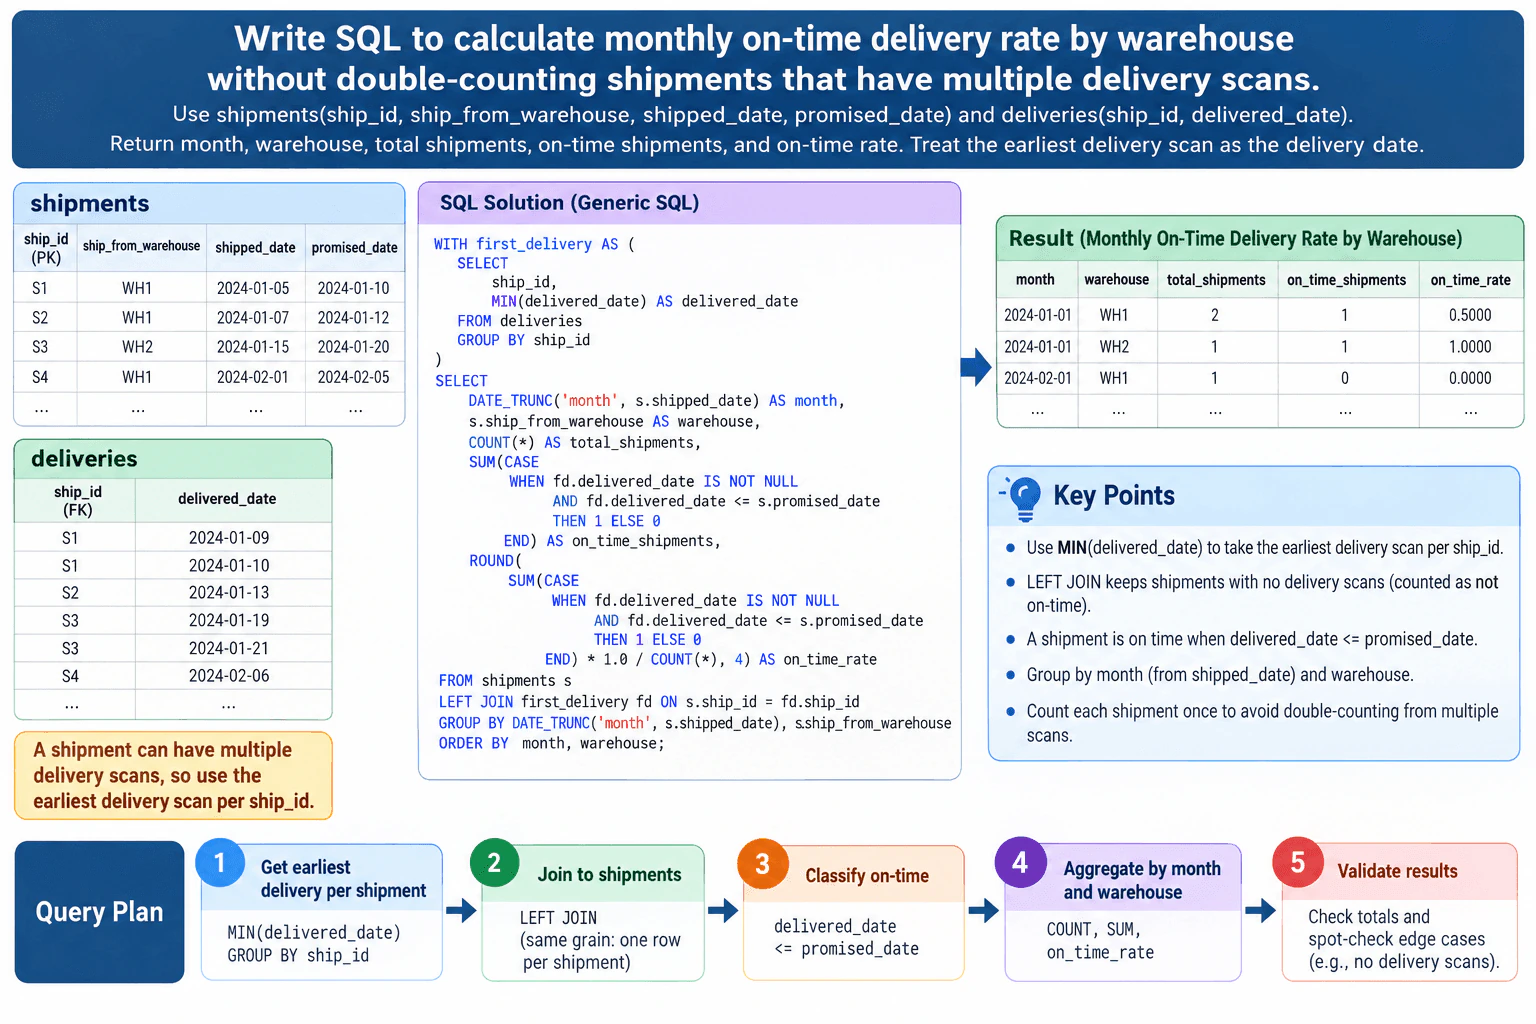
5. Write SQL to calculate monthly on-time delivery rate by warehouse without double-counting shipments that have multiple delivery scans.Sql And DatabasesMediumAccenture
i Question Details
Use shipments(ship_id, ship_from_warehouse, shipped_date, promised_date) and deliveries(ship_id, delivered_date). Return month, warehouse, total shipments, on-time shipments, and on-time rate. Treat the earliest delivery scan as the delivery date.
Short Interview Answer (30-60 seconds)
I would first reduce deliveries to one row per ship_id using MIN(delivered_date), because a shipment can have multiple delivery scans. Then I would LEFT JOIN that result to shipments so shipments with no delivery scan still remain in the denominator. I would group by the month of shipped_date and ship_from_warehouse, count total shipments, use a CASE expression to count shipments whose earliest delivery date is on or before promised_date, and divide on-time shipments by total shipments. I would also verify that the joined row count still matches the shipment count.
The key problem is the data grain. The shipments table represents shipments, while deliveries can contain several rows for the same shipment because of multiple scans. If we join those tables directly, one shipment may appear several times and inflate both counts. The safe approach is to first collapse deliveries to one row per ship_id using the earliest delivered_date. Then join that one-row-per-shipment result back to shipments, classify each shipment as on time or not, and finally aggregate by shipped month and warehouse. Undelivered shipments stay in total shipments but are not counted as on time.
Useful Questions to Ask the Interviewer
Should the reporting month be based on shipped_date, delivered_date, or promised_date? The approved diagram uses shipped_date.
Should shipments with no delivery scan remain in total shipments and count as not on time? The approved diagram uses that rule.
Are shipped_date, promised_date, and delivered_date DATE values or timestamps, and if timestamps are used, which reporting time zone should define the month and date comparison?
Can promised_date be NULL, and if so, should those shipments be treated as not on time, excluded, or reported separately?
Is shipments.ship_id guaranteed to be unique, as represented in the diagram, or should duplicate shipment records be handled separately?
How to Explain It in an Interview
Start with the join grain before writing SQL. The target intermediate grain is one row per shipment. The shipments table is represented as one row per ship_id, while deliveries can contain multiple scans for one ship_id. A direct one-to-many join would multiply shipment rows, so first aggregate deliveries with MIN(delivered_date) GROUP BY ship_id. That produces the earliest delivery scan and at most one delivery row per shipment.
Next, LEFT JOIN that result to shipments. The LEFT JOIN is important because shipments with no delivery scan must remain in the denominator. Those rows receive a NULL delivered_date. They still count toward total_shipments but do not satisfy the on-time condition.
The output grain is one row per shipped month and warehouse. Following the diagram, derive month from s.shipped_date with DATE_TRUNC('month', s.shipped_date) and use s.ship_from_warehouse as warehouse. Because deliveries has already been reduced to one row per ship_id, COUNT() counts shipment rows without multiplication.
Classify a shipment as on time when the earliest delivered_date is not NULL and delivered_date <= promised_date. Equality matters: delivery exactly on the promised date counts as on time. Use SUM(CASE WHEN ... THEN 1 ELSE 0 END) for on_time_shipments.
Calculate on_time_rate as on_time_shipments divided by total_shipments. Multiplying the numerator by 1.0 prevents integer division in this PostgreSQL-style implementation, and ROUND(..., 4) produces a decimal rate with up to four decimal places.
The SQL is:
WITH first_delivery AS ( SELECT ship_id, MIN(delivered_date) AS delivered_date FROM deliveries GROUP BY ship_id ) SELECT DATE_TRUNC('month', s.shipped_date) AS month, s.ship_from_warehouse AS warehouse, COUNT() AS total_shipments, SUM( CASE WHEN fd.delivered_date IS NOT NULL AND fd.delivered_date <= s.promised_date THEN 1 ELSE 0 END ) AS on_time_shipments, ROUND( SUM( CASE WHEN fd.delivered_date IS NOT NULL AND fd.delivered_date <= s.promised_date THEN 1 ELSE 0 END ) * 1.0 / COUNT(), 4 ) AS on_time_rate FROM shipments s LEFT JOIN first_delivery fd ON s.ship_id = fd.ship_id GROUP BY DATE_TRUNC('month', s.shipped_date), s.ship_from_warehouse ORDER BY month, warehouse;
The main validation check is that the join has not increased the shipment population. After the LEFT JOIN, the row count should match the shipment row count for the same scope. If ship_id is expected to be unique in shipments, COUNT() and COUNT(DISTINCT s.ship_id) should also agree. I would additionally spot-check shipments with multiple delivery scans, shipments with no scans, deliveries exactly on promised_date, and rows where promised_date is NULL.
NULL behavior should be explicit. A shipment with no matching delivery scan has fd.delivered_date = NULL, so the CASE expression returns 0 and the shipment stays in the denominator but not the numerator. If promised_date is NULL, the comparison fd.delivered_date <= s.promised_date evaluates to unknown rather than true, so the CASE also returns 0 under this query. If the business wants another rule for missing promised dates, that rule should be stated and implemented explicitly.
Date boundaries also matter. DATE_TRUNC groups by shipped_date, so a shipment belongs to the month in which it shipped, regardless of when it was promised or delivered. If these columns are timestamps rather than dates, the reporting time zone should be agreed before deriving the month or comparing calendar dates.
An alternative way to choose the earliest delivery is ROW_NUMBER() OVER (PARTITION BY ship_id ORDER BY delivered_date, <deterministic tie-breaker>) and then keeping row number 1. That is useful when additional columns from the exact earliest scan row are needed. For this question, only the earliest delivered_date is required, so MIN(delivered_date) is simpler and matches the approved diagram.
For performance, correctness comes first: reduce the one-to-many delivery rows before joining. On large tables, an index or access path involving deliveries.ship_id and delivered_date may help, but the useful optimization depends on the database engine, data volume, statistics, and execution plan. The important failure mode is joining raw delivery scans first and then counting rows, because that can inflate both totals and rates.
Technical Approach
Define the grain: one row per shipment before aggregation, then one output row per shipped month and warehouse.
Aggregate deliveries by ship_id with MIN(delivered_date) to select the earliest delivery scan and prevent one-to-many row multiplication.
LEFT JOIN the deduplicated delivery result to shipments on ship_id so shipments without scans remain in the population.
Derive month from shipments.shipped_date and use ship_from_warehouse as the warehouse dimension.
Count each joined shipment row once as total_shipments.
Use CASE to count a shipment as on time only when delivered_date is not NULL and delivered_date <= promised_date.
Divide on_time_shipments by total_shipments using non-integer arithmetic and round the rate for presentation.
GROUP BY month and warehouse and ORDER BY month, warehouse.
Validate the joined row count against the shipment population and spot-check duplicate scans, NULL deliveries, promised-date boundaries, and NULL promised dates.
Practical Complexity & Trade-offs
The database must first read delivery-scan rows and group them by ship_id to find one minimum delivered_date per shipment. It then joins that smaller result to shipments and performs another aggregation by month and warehouse. Exact runtime depends on table size, indexes, statistics, and the execution plan. The extra deduplication step is worthwhile because it prevents a correctness error: multiple delivery scans must not cause one shipment to be counted more than once.
Example
The implementation follows the approved diagram's five-step flow: get the earliest delivery per shipment, join that result to shipments, classify each shipment as on time or not, aggregate by shipped month and warehouse, and validate the totals. The first_delivery CTE uses MIN(delivered_date) GROUP BY ship_id so the LEFT JOIN remains at one row per shipment. The final query uses COUNT() for total shipments, a CASE expression for the on-time count, and their ratio for on_time_rate.
Code
WITH
first_delivery AS (
SELECT
ship_id,
MIN(delivered_date) AS delivered_date
FROM
deliveries
GROUPBY
ship_id
)
SELECT
DATE_TRUNC ('month', s.shipped_date) ASMONTH,
s.ship_from_warehouse AS warehouse,
COUNT() AS total_shipments,
SUM(
CASEWHEN fd.delivered_date ISNOT NULLAND fd.delivered_date <= s.promised_date THEN1ELSE0END
) AS on_time_shipments,
ROUND(
SUM(
CASEWHEN fd.delivered_date ISNOT NULLAND fd.delivered_date <= s.promised_date THEN1ELSE0END
) *1.0/COUNT(*),
4
) AS on_time_rate
FROM
shipments s
LEFTJOIN first_delivery fd ON s.ship_id = fd.ship_id
GROUPBY
DATE_TRUNC ('month', s.shipped_date),
s.ship_from_warehouse
ORDERBYMONTH,
warehouse;
Where it is used
This pattern is useful in logistics and operations reporting whenever one business entity has many event rows but the metric must count the entity once. Examples include warehouse delivery KPIs, fulfillment service-level reporting, order milestone analysis, support tickets with repeated status events, and cases where the first qualifying event determines whether a deadline was met.
Why Interviewers Ask This
This tests whether you recognize a one-to-many join that can multiply shipment rows, reduce the delivery data to the correct grain before joining, preserve undelivered shipments in the denominator, apply date logic correctly, aggregate at month-and-warehouse grain, and validate that the result does not double-count shipments.
Common interview mistakes
Joining shipments directly to raw deliveries and counting the multiplied rows; using MAX(delivered_date) instead of the required earliest scan; using INNER JOIN and dropping shipments with no delivery scan; deriving the reporting month from delivered_date instead of shipped_date when following this specification; forgetting that comparisons with NULL are not true; using integer division for the rate; deduplicating only the denominator while leaving the numerator at scan grain; assuming promised_date NULL behavior without stating it; and failing to validate that the post-deduplication join still has one row per shipment.
Interview tip
Lead with the grain problem before showing syntax: deliveries is one-to-many relative to shipments, so reduce it to one row per ship_id first. Then explain why LEFT JOIN keeps undelivered shipments in the denominator, show the CASE condition for on-time classification, and finish with the row-count validation. That demonstrates relational reasoning, metric definition, and SQL correctness in a clear order.
Interviewer may ask next
How would you handle shipments with no delivery scan or a NULL promised_date?
With this query, a shipment with no delivery scan survives the LEFT JOIN, has delivered_date = NULL, remains in total_shipments, and contributes 0 to on_time_shipments. A NULL promised_date also makes delivered_date <= promised_date evaluate to unknown, so the CASE contributes 0. I would confirm whether that is the intended business rule. If NULL promised dates should be excluded or reported separately, I would change the population or add a separate status explicitly.
What would you change if you needed columns from the exact earliest delivery-scan row, not just the earliest delivered_date?
MIN(delivered_date) is enough when only the earliest date is needed. If I also needed other columns from the same earliest scan row, I would use ROW_NUMBER() OVER (PARTITION BY ship_id ORDER BY delivered_date, <deterministic tie-breaker>) and keep row_number = 1 before joining. The tie-breaker matters when two scans have the same delivered_date. That preserves the exact earliest row's attributes, but it is more complex than the MIN aggregation required here.
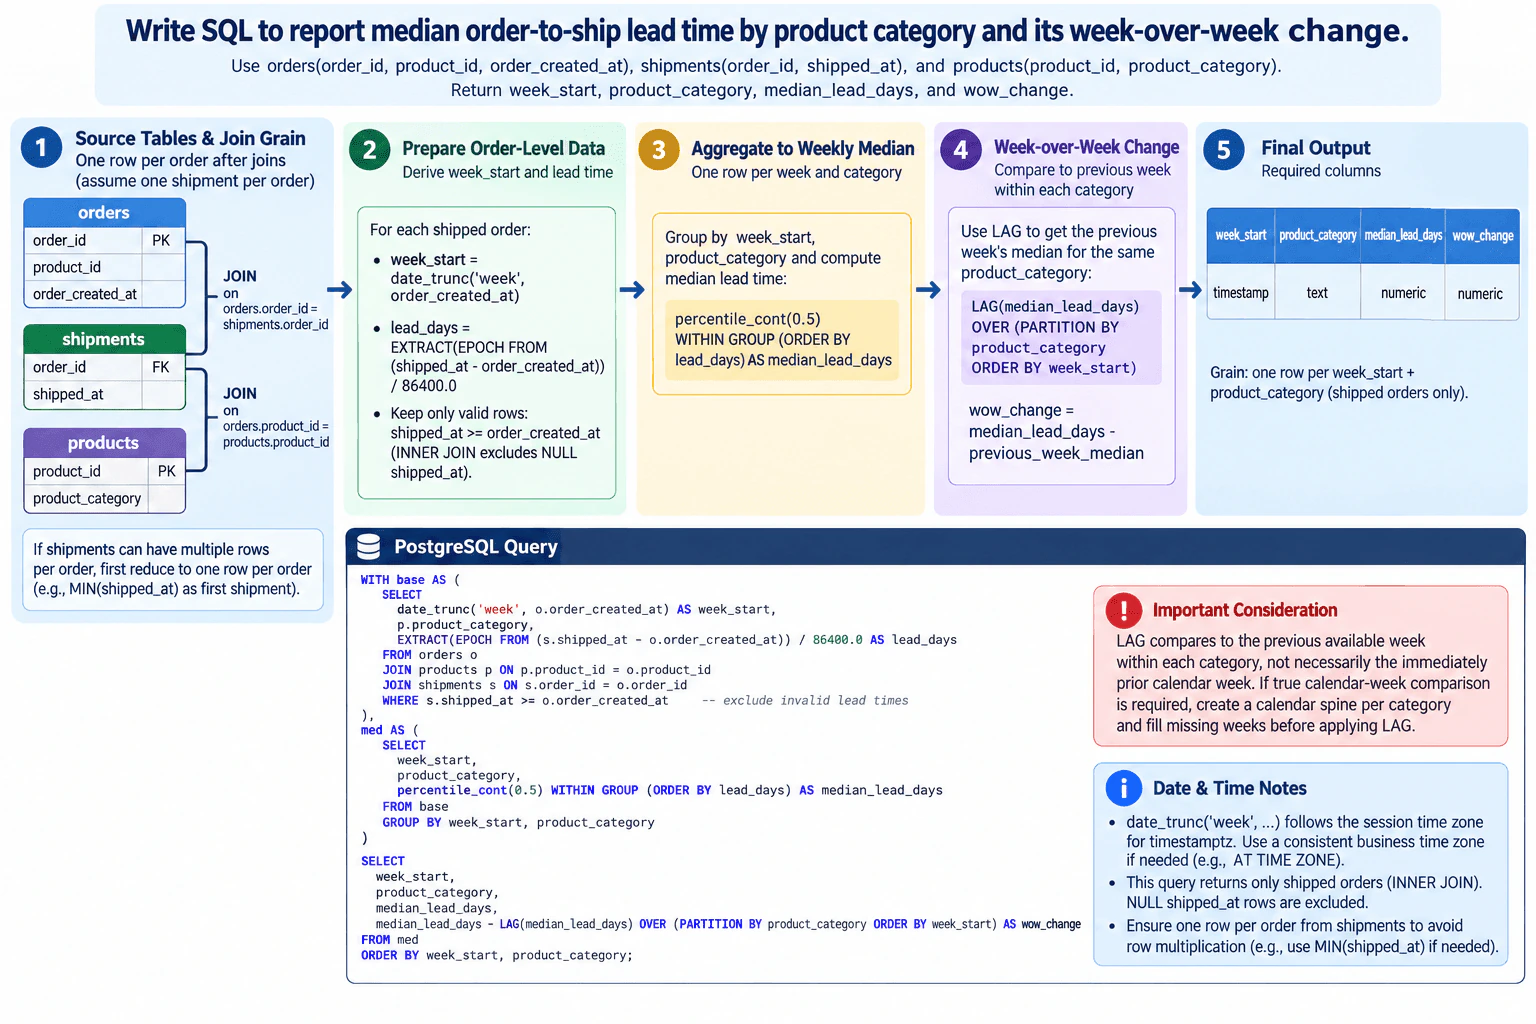
6. Write SQL to report median order-to-ship lead time by product category and its week-over-week change.NEWSql And DatabasesHardAccenture
i Question Details
Use orders(order_id, product_id, order_created_at), shipments(order_id, shipped_at), and products(product_id, product_category). Return week_start, product_category, median_lead_days, and wow_change.
Short Interview Answer (30-60 seconds)
I would first make the joined data one row per shipped order, assuming shipments contains one relevant shipment row per order. I would use the order creation week as week_start, calculate lead_days as shipped_at minus order_created_at, and group by week_start and product_category. PostgreSQL's PERCENTILE_CONT(0.5) gives the median. Then I would use LAG on that weekly result, partitioned by product_category and ordered by week_start, and subtract the previous median from the current median. I would also check duplicate shipment rows, NULL shipment dates, invalid negative lead times, missing weeks, and time-zone boundaries.
The task is to measure the typical number of days from order creation to shipment for each product category and each order-created week, then show how that median changed from the previous available week. The safest approach is to keep the join at one row per shipped order before calculating anything. From that order-level data, derive week_start and lead_days, aggregate to one row per week and category using the median, and finally use LAG to compare each category only with its own earlier weekly result.
Useful Questions to Ask the Interviewer
Should week_start be based on order_created_at, as shown here, or on shipped_at?
Does shipments contain exactly one relevant shipment row per order, or can an order have multiple shipment events?
If multiple shipment rows exist, should lead time use the first shipment, final shipment, or another business-defined event?
Should orders with NULL shipped_at be excluded as unshipped orders?
Should rows where shipped_at is earlier than order_created_at be treated as data errors and excluded?
Which business time zone should define the weekly boundary if these timestamps are time-zone-aware?
Does week-over-week mean the previous available row for that category, or the immediately previous calendar week even when a category has no data that week?
How to Explain It in an Interview
Query Plan
The important starting point is the data grain. orders should contribute one row per order, products should contribute one row per product, and this solution assumes shipments contributes one relevant shipment row per order. Joining orders to shipments on order_id and to products on product_id therefore keeps the working grain at one row per shipped order. If shipments is one-to-many, I would first reduce it to one shipment event per order, such as MIN(shipped_at) when the requirement is first shipment, before performing the joins.
For every valid shipped order, derive week_start with date_trunc('week', order_created_at) and calculate lead_days as the elapsed interval from order_created_at to shipped_at, converted to days with EXTRACT(EPOCH FROM (shipped_at - order_created_at)) / 86400.0. The predicate shipped_at >= order_created_at removes negative lead times. It also excludes rows with NULL shipped_at because a comparison with NULL is not TRUE.
Next, aggregate from order grain to one row per week_start and product_category. PostgreSQL's PERCENTILE_CONT(0.5) WITHIN GROUP (ORDER BY lead_days) returns the continuous 50th percentile, which is the median used here. Using the median rather than the average makes the metric less sensitive to unusually long shipping times.
After aggregation, apply the window function at the weekly-category grain. LAG(median_lead_days) OVER (PARTITION BY product_category ORDER BY week_start) gets the prior available weekly median within the same category. The required wow_change is median_lead_days - previous_week_median. A positive value means the median lead time increased compared with that prior available category week; a negative value means it decreased. The first available row for each category has no previous value, so wow_change is NULL.
One important boundary is that LAG compares adjacent rows in the category's result, not automatically adjacent calendar weeks. If a category has no row for a calendar week, this query compares the next populated week with the previous populated week. If the requirement is a strict calendar-week comparison, I would build a weekly calendar spine for each category, join the weekly medians to it, decide how missing medians should be represented, and only then apply LAG.
For time-zone handling, I would establish one business time zone before truncating timestamps if order_created_at is time-zone-aware. Otherwise, orders near a week boundary can fall into a different reporting week depending on the effective time zone used for the truncation.
Data Checks
Before trusting the result, I would compare the joined row count with the distinct order_id count. If the row count is unexpectedly larger, a one-to-many shipment join may be multiplying orders and changing the median. I would separately count NULL shipped_at values and rows with shipped_at < order_created_at. I would also manually recalculate lead time for a small sample of orders and compare weekly-category counts and medians with a trusted extract or independently reproduced query.
SQL Reasoning
The first CTE creates the correct order-level analytical data. The second CTE changes the grain to one row per week and category and calculates the median. The final SELECT keeps that grain and adds the window-based comparison. This separation makes the query easier to validate because joins and row-level calculations happen before aggregation, while LAG happens only after the median has been calculated. It also avoids applying a weekly comparison at raw order grain, which would compare the wrong level of data.
Technical Approach
Use PostgreSQL and define the working grain as one row per shipped order after joining orders, shipments, and products.
Assume one relevant shipment row per order; if shipments is one-to-many, first reduce it to the required shipment event, such as MIN(shipped_at) for first shipment.
Join orders to shipments on order_id and products on product_id.
Exclude unavailable or invalid lead times with shipped_at >= order_created_at.
Derive week_start from order_created_at with date_trunc('week', ...).
Calculate lead_days as the order-to-ship interval converted to days.
GROUP BY week_start and product_category.
Calculate median_lead_days with PERCENTILE_CONT(0.5) WITHIN GROUP (ORDER BY lead_days).
Use LAG(median_lead_days) OVER (PARTITION BY product_category ORDER BY week_start).
Return wow_change as the current median minus the previous available week's median.
Validate distinct order counts, duplicates, nulls, invalid dates, week boundaries, and several manually checked orders.
Practical Complexity & Trade-offs
The joins process the relevant order, shipment, and product rows, while computing an exact median requires ordering lead-time values within each week-and-category group. The LAG step is applied only after aggregation, so it works on the much smaller weekly result. On large tables, indexes on join keys such as shipments.order_id and products.product_id can help the joins, but actual performance depends on table sizes, statistics, filters, and the query plan. Correct grain matters more than adding indexes blindly because duplicate shipment rows would produce a fast but incorrect median.
Example
PostgreSQL implementation matching the approved diagram: the base CTE joins the three tables at order grain, derives the order-created week and lead time in days, and removes rows with missing or negative shipment timing. The med CTE calculates one median per week and product category. The final query uses LAG within each product category and subtracts that prior available weekly median from the current median. This assumes one relevant shipment row per order; if shipments can contain multiple rows, reduce them to the intended shipment event before the join.
Code
WITH
base AS (
SELECT
date_trunc ('week', o.order_created_at) AS week_start,
p.product_category,
EXTRACT(
EPOCH
FROM
(s.shipped_at - o.order_created_at)
) /86400.0AS lead_days
FROM
orders AS o
JOIN products AS p ON p.product_id = o.product_id
JOIN shipments AS s ON s.order_id = o.order_id
WHERE
s.shipped_at >= o.order_created_at
),
med AS (
SELECT
week_start,
product_category,
percentile_cont(0.5) WITHINGROUP (
ORDERBY
lead_days
) AS median_lead_days
FROM
base
GROUPBY
week_start,
product_category
)
SELECT
week_start,
product_category,
median_lead_days,
median_lead_days -LAG (median_lead_days) OVER (
PARTITIONBY
product_category
ORDERBY
week_start
) AS wow_change
FROM
med
ORDERBY
week_start,
product_category;
Where it is used
This pattern is useful in fulfillment and operations reporting when analysts need a robust weekly shipping-speed metric by product category and want to identify whether typical lead time is improving or worsening over time. The same aggregate-then-LAG pattern can be used for other grouped weekly measures such as processing time, resolution time, or delivery duration.
Why Interviewers Ask This
This tests whether the candidate can preserve the correct relational grain, calculate a grouped median correctly, use PostgreSQL ordered-set aggregation, and apply a window function at the already-aggregated weekly-category grain without accidentally multiplying rows or comparing one product category with another.
Common interview mistakes
Common mistakes are joining a one-to-many shipments table without first choosing the intended shipment event, which duplicates orders and distorts the median; averaging lead time instead of calculating the requested median; grouping by shipped week instead of order-created week without clarifying that choice; applying LAG before producing the weekly-category aggregate; forgetting PARTITION BY product_category and therefore comparing different categories; reversing the subtraction and reporting previous minus current instead of current minus previous; treating LAG as the immediately previous calendar week when missing weeks exist; allowing NULL or negative lead times without a defined rule; and ignoring the business time zone around weekly boundaries.
Interview tip
Explain the grain first: one row per shipped order, then one row per week and category. After that, describe the query as three simple stages—calculate lead time, take the weekly median, then use category-partitioned LAG. Mention the missing-week behavior explicitly because it shows you understand the difference between the previous result row and the previous calendar week.
Interviewer may ask next
What would you change if the shipments table can contain multiple shipment rows for one order?
I would not join the raw one-to-many shipments table directly because that would duplicate an order and give it extra weight in the median. I would first define which shipment event the business wants. For first shipment, I could create a shipment CTE with SELECT order_id, MIN(shipped_at) AS shipped_at FROM shipments GROUP BY order_id, and then join that one-row-per-order result to orders. If the requirement is final shipment or another event, I would use the corresponding business rule instead. After reducing shipments to the correct order grain, the median and LAG logic stay the same.
How would you change the query if week-over-week must mean the immediately previous calendar week even when a category has no orders in that week?
The current LAG compares the current row with the previous available row for that category. For strict calendar-week comparison, I would create a calendar spine containing every required week and category, left join the weekly median result onto that spine, and then apply LAG ordered by week_start within each category. I would clarify the rule for a missing median rather than inventing a value. If missing medians remain NULL, the following week's comparison will also be NULL unless the business defines a specific imputation rule.
7. Describe a time in your life when you faced serious difficulty and how you reacted.BehavioralMediumAccenture
Interview tip:
Use STAR to structure your answer: briefly explain the Situation and Task, make Action the most detailed part, and finish with the Result. For example, describe a difficult analysis where you discovered a serious data problem close to a deadline, took ownership of the issue, communicated the risk clearly, adjusted priorities, verified the most important information, and helped the team make a reliable decision.
Situation
During a previous project, I was preparing an analysis that a business team needed for an important decision. Close to the deadline, I found that two data sources were giving different results for the same business measure. At the same time, the stakeholders were asking for additional analysis. I knew that presenting numbers I did not trust would create a bigger problem than missing part of the original request.
Task
My responsibility was to understand the data discrepancy, protect the reliability of the analysis, and still give the stakeholders something useful within the available time. I also needed to explain the problem clearly without creating unnecessary confusion or hiding the uncertainty.
Action
I first stopped adding new analysis and focused on finding the source of the difference. I compared the definitions, filters, date ranges, and update timing used by both data sources. I found that the sources were applying different business rules, which explained why the results did not match. I documented what I found so I could explain it in simple terms. I then spoke with the stakeholders and explained which decision depended on the analysis, what was uncertain, and why I did not want to present the conflicting numbers as final. I asked them which parts of the analysis were most important for the immediate decision. Based on that discussion, I reduced the scope and focused on the information we could validate with confidence. I also clearly marked the remaining uncertainty and explained what still needed to be checked. Instead of reacting to the pressure by rushing, I tried to separate the urgent work from the important validation work and kept the stakeholders informed as the situation changed.
Result
The stakeholders were able to continue their decision process using the validated information, while the uncertain data was handled separately instead of being presented as reliable. The experience taught me that serious difficulty is easier to manage when I stay calm, make the problem visible early, and focus first on the decisions that matter most. It also strengthened my habit of checking assumptions before presenting analysis.
Why Interviewers Ask This
Interviewers ask this question to understand how a candidate behaves under serious pressure or uncertainty. A strong answer shows resilience, ownership, practical judgment, clear communication, and the ability to make thoughtful decisions instead of reacting emotionally or ignoring a difficult problem.
Interviewer may ask next
Why did you decide to reduce the scope instead of trying to complete everything before the deadline?
I reduced the scope because the immediate priority was to give the stakeholders information they could trust. Trying to complete every request would have taken time away from validating the data and could have increased the risk of presenting incorrect conclusions. I discussed the priorities with the stakeholders so the decision about scope was clear and connected to their most important business need.
What would you do differently if you faced a similar situation again?
I would validate the key data definitions and source rules earlier in the project. That could reveal inconsistencies before the deadline becomes a concern. I would also confirm the most important decision and required analysis with stakeholders earlier, so there is a clear priority if requirements change or an unexpected data problem appears.
8. What motivates you to work for Accenture?BehavioralEasyAccenture
Interview tip:
Use STAR to structure your answer: briefly explain the Situation and Task, make Action the most detailed part, and finish with the Result. For example, describe a previous analysis where you enjoyed turning an unclear business question into useful decision support, worked closely with stakeholders, adapted to feedback, and explain why that experience motivates you to pursue this Data Analyst opportunity at Accenture.
Situation
During a previous project, I worked on an analysis where the business question was not fully clear at the beginning. Different stakeholders wanted different information, and I realized that the value of the analysis depended on understanding the decision they needed to make.
Task
My responsibility was to turn those broad requirements into a clear analytical question and provide findings that the stakeholders could actually use. I also needed to keep the communication simple so that people with different levels of data knowledge could understand the result.
Action
I started by speaking with the stakeholders to understand what decision depended on the analysis and which questions mattered most. I summarized the requirements in simple terms and confirmed them before doing the deeper analysis. As the work progressed, some requirements changed, so I adjusted the analysis while keeping the main business question as the priority. I checked my assumptions, reviewed the data for discrepancies, and explained any uncertainty instead of presenting every finding as certain. When I shared the results, I focused on the most useful insights and connected each one to the decision the stakeholders were considering. I also asked for feedback and used it to improve how I presented the final findings. That experience showed me that I enjoy both the analytical work and the communication needed to make the analysis useful.
Result
The stakeholders received a clearer view of the issue and could use the analysis to support their decision. I learned that I am most motivated when I can combine data analysis, problem solving, communication, and continuous learning. That is what attracts me to this Data Analyst opportunity at Accenture. I want to contribute analysis that helps people make better decisions while continuing to develop my skills through challenging business problems.
Why Interviewers Ask This
Interviewers ask this question to understand whether the candidate has a clear and genuine reason for choosing Accenture and whether that motivation matches the work of a Data Analyst. A strong answer connects the candidate's past experience and professional interests with analytical problem solving, stakeholder communication, decision support, and continued learning.
Interviewer may ask next
What part of that previous project did you find most motivating?
The most motivating part was seeing an unclear business question become something I could analyze and explain clearly. I enjoyed working with the stakeholders to understand the real decision behind the request, then using the data to provide information that was useful for that decision. It showed me that I enjoy analysis most when it has a clear business purpose.
How would that experience help you succeed as a Data Analyst at Accenture?
It taught me to begin with the business question instead of immediately focusing on the data. I learned to confirm requirements, communicate when they change, check assumptions, explain uncertainty, and present findings in language that stakeholders can understand. I would bring that same approach to this role so that my analysis is accurate, practical, and useful for decision making.
9. Are you comfortable working in teams and with different technologies?BehavioralEasyAccenture
Interview tip:
Use STAR to structure your answer: briefly explain the Situation and Task, make Action the most detailed part, and finish with the Result. For example, describe a project where you worked with teammates using different tools, learned how the technologies connected, communicated clearly about requirements and data issues, and helped the team deliver a reliable analysis.
Situation
During a previous data analysis project, I worked with a team that used several technologies for different parts of the work. Data came from a database, some preparation was done with scripts, and the final findings were shared through a reporting tool. Different team members had stronger experience with different parts of that process.
Task
My responsibility was to complete my analysis while making sure my work connected correctly with the rest of the team. I also needed to understand enough about the other tools to communicate clearly, identify data issues, and avoid creating problems for the next person in the process.
Action
I started by discussing the workflow with the team so I understood where the data came from, what transformations happened before I received it, and how my output would be used. When I worked with a technology that was less familiar to me, I focused first on the parts needed for the task instead of trying to learn everything at once. I asked specific questions, reviewed examples from the existing workflow, and tested my understanding with a small amount of data before using the full data set. I also shared assumptions and data issues early with the team instead of waiting until the end. When requirements changed, I confirmed what the new priority was and adjusted my analysis so the team stayed focused on the business decision that needed support. I was comfortable asking for help when another teammate had deeper knowledge, and I also explained my own analysis clearly when others needed context from me.
Result
The team was able to complete the work with a consistent understanding of the data and the final analysis. I became more comfortable moving between different technologies because I learned that good teamwork does not require one person to be an expert in every tool. It requires understanding how the tools connect, communicating clearly, and being willing to learn what is needed for the task.
Why Interviewers Ask This
Interviewers ask this question to understand whether a candidate can collaborate with people who have different skills and adapt when a data team uses several technologies. A strong answer shows teamwork, clear communication, practical learning, flexibility, and responsibility for how individual work affects the wider process.
Interviewer may ask next
How do you approach a technology that you have not used before?
I first identify what I need to accomplish with the technology and where it fits in the team workflow. Then I learn the specific features needed for the task, review existing examples, ask focused questions when necessary, and test my understanding on a small amount of data before relying on it for the full analysis.
How did you make sure communication stayed clear when team members were using different tools?
I focused on the data, requirements, assumptions, and expected output rather than assuming everyone needed the same technical knowledge. I confirmed how my input was produced and how my output would be used, and I raised changes or data problems early so teammates could adjust their work before those issues affected the final analysis.
10. Why do you want to change your current position?BehavioralEasyAccenture
Interview tip:
Use STAR to structure your answer: briefly explain the Situation and Task, make Action the most detailed part, and finish with the Result. For example, describe how your current role helped you build useful Data Analyst skills, why you are now looking for broader analytical responsibility or stronger business impact, how you evaluated what you want in your next position, and how this move supports your professional growth.
Situation
In my current position, I have built a solid foundation in data analysis and learned how important clear communication and reliable analysis are for business decisions. I value what I have learned, but over time I realized that I want a role where I can take more ownership of analysis and work more closely with business stakeholders.
Task
I needed to think carefully about what I wanted from my next position instead of changing roles simply because I wanted something different. My goal was to identify the type of work where I could continue growing while using my analytical skills to support important business decisions.
Action
I reviewed the parts of my current work that I found most valuable. I was most engaged when I could understand a business question, work with the data, explain what the results meant, and help stakeholders decide what to do next. I also considered where I wanted to grow. I want more opportunities to own analysis from the initial question through the final recommendation, work with different business partners, and handle problems where requirements may change as new information becomes available. I discussed my development goals professionally and continued giving my current responsibilities my full attention. At the same time, I started looking for a Data Analyst position that offers stronger alignment with those goals. I see this change as a positive career step rather than an attempt to leave a negative situation.
Result
This process gave me a clearer understanding of what I want in my next role. I am looking for a position where I can build on my current experience, take greater analytical ownership, and contribute more directly to business decisions. I also learned that a good career move should be based on long term growth and fit, while still showing respect for what I have learned in my current position.
Why Interviewers Ask This
Interviewers ask this question to understand the candidate's motivation for leaving, professional judgment, and career goals. A strong answer stays positive about the current employer, explains a clear reason for seeking growth, and shows that the candidate is moving toward a role that fits their Data Analyst skills and long term development.
Interviewer may ask next
What are you looking for in your next Data Analyst position that you do not have in your current role?
I am looking for more ownership of the full analysis process. I want to work from the original business question through data analysis, communication, and decision support. I also want more opportunities to work directly with different stakeholders and solve problems where the requirements may change as the analysis develops.
How did you decide that changing positions was the right step instead of staying in your current role?
I first thought carefully about which parts of my current work were helping me grow and which opportunities I wanted more of. I realized that my main goal is broader analytical ownership and closer involvement in business decisions. I respect what I have learned in my current position, but I concluded that moving to a role with stronger alignment to those goals is the right next step for my development.
Data Analyst Resume Examples
Explore the resume examples below to find the one that best matches your target Data Analyst role.
Disclaimer: This interview guide is for educational and informational purposes only. It is designed to help readers prepare, but it does not guarantee any interview result, hiring decision, offer, or outcome. Interview questions, hiring criteria, and preferred answers can vary by employer, interviewer, industry, location, and time. All answers, examples, and explanations in this guide are suggested examples for interview preparation, not definitive answers or instructions for professional practice. They are based on research and judgment, are provided without warranties of any kind, and should be adapted to the question, role, and applicable laws and professional requirements. Diagrams are simplified illustrations intended to highlight the main concepts and their relationships; actual situations, systems, and practices may be more complex. Alternative approaches may be equally valid or better suited to a particular question, context, or interviewer. To the fullest extent permitted by applicable law, the contributors and publisher are not liable for decisions made, actions taken, or losses incurred based on this guide.
State Laws and Professional Responsibilities: Laws and requirements governing an occupation vary by state and jurisdiction. You are responsible for checking the current laws, licensing requirements, and scope-of-practice rules that apply to your location and role, and for ensuring that your answers and actions comply with them. Adapt examples in this guide to those requirements. This guide is not legal advice.
Company Notice: This guide is an independent educational resource and is not affiliated with, endorsed by, sponsored by, or approved by the company named in this guide. Company names identify reported interview experiences or the employer context of clearly labeled original practice exercises. Interview practices can change without notice, and inclusion of company-specific content does not mean these questions are official, complete, or guaranteed to be asked. To the fullest extent permitted by law, the author, contributors, and publisher are not responsible for outcomes related to use of this material.
Content Accuracy and Verification: To the fullest extent permitted by applicable law, we do not represent or warrant that interview guides, questions, answers, examples, or diagrams are accurate, complete, current, error-free, or suitable for any particular purpose. You are responsible for independently reviewing and verifying the information before relying on it.