1. Walmart.com fresh-produce conversion drops 6% week over week on mobile. What would you analyze in the first 30 minutes?
Build a hypothesis tree across demand, availability, pricing, promotion, and funnel friction; name the metrics and segment cuts that would distinguish the causes.
In the first 30 minutes, I would first define mobile fresh-produce conversion consistently as completed fresh-produce purchases divided by eligible mobile sessions reaching the fresh-produce experience, then compare the latest seven days with the previous seven days using the same eligibility rules and time zone. I would quickly validate tracking, freshness, missing or duplicate events, denominator changes, segment integrity, and outliers. Then I would test five hypotheses: demand, availability, pricing, promotion, and funnel friction. For each, I would compare the relevant metrics with the prior week and cut them by meaningful dimensions such as geography or store, category or SKU, new versus returning users, and mobile OS, browser, or app version where appropriate. I would identify the largest abnormal variance, state it as an observation rather than a proven cause, recommend the smallest proportional action or test, and measure both conversion and the affected upstream metric afterward.
The goal is not to explain the 6% decline immediately. The first 30 minutes should narrow the problem to the most plausible driver using reliable comparisons. I would first define exactly who is counted and how conversion is calculated, then make sure the data itself is trustworthy. After that, I would test five hypothesis branches: demand, availability, pricing, promotion, and funnel friction. I would compare each branch with the prior week and across meaningful segments. The output is a supported observation, its limitations, a focused next action, and a measurement plan that can confirm or challenge the hypothesis.
- Does the reported 6% mean a relative week-over-week decline or a six-percentage-point decline?
- What is the approved definition of mobile fresh-produce conversion, especially the denominator and the event that counts as a completed purchase?
- Does mobile include both the app and mobile web, and should they be analyzed separately?
- What time zone and exact seven-day reporting windows are used for the current and prior week?
- Were there known tracking releases, app changes, checkout changes, assortment changes, pricing changes, or promotions during either period?
- Can availability and fulfillment metrics be joined at the same geography, store or market, category, and SKU levels as the conversion data?
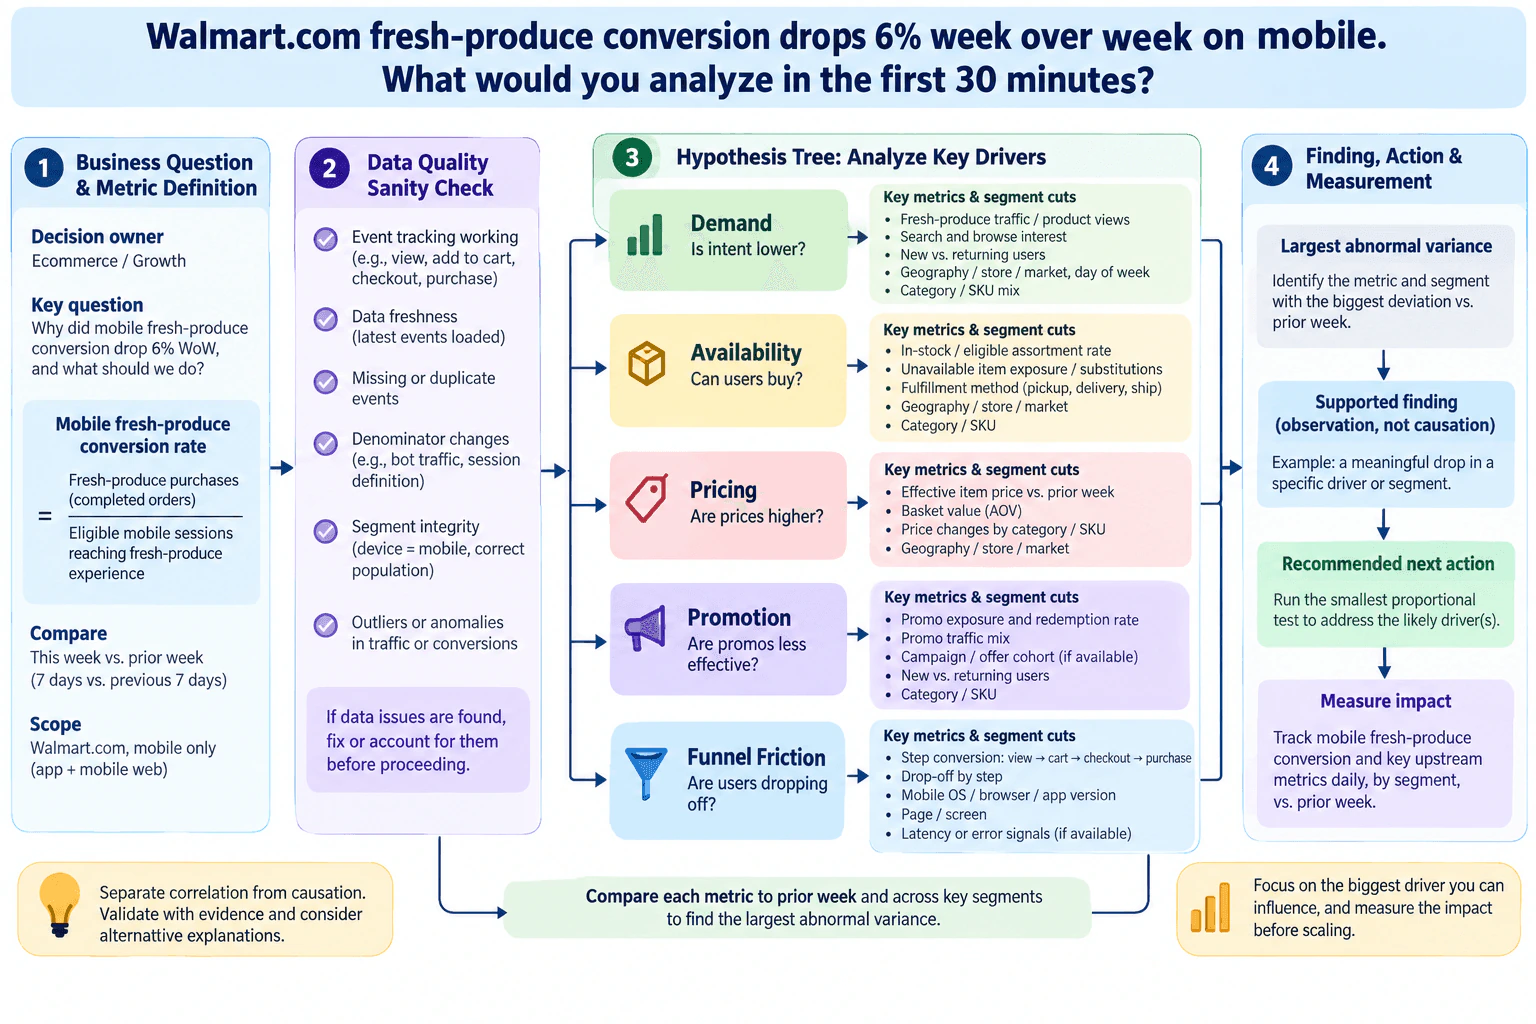
I would organize the first 30 minutes as a fast diagnostic flow from metric definition, to data-quality validation, to a five-branch hypothesis tree, and finally to a supported finding, action, and measurement plan.
The business question is: why did Walmart.com mobile fresh-produce conversion fall 6% week over week, and what should the ecommerce or growth owner investigate or do next?
I would start with the metric shown in the approved diagram:
Mobile fresh-produce conversion rate = completed fresh-produce purchases / eligible mobile sessions reaching the fresh-produce experience.
I would confirm the exact event logic before calculating anything. The population is Walmart.com fresh-produce users on mobile, including app and mobile web if both are part of the reported KPI. The working unit of analysis is the eligible mobile session. I would compare this week with the previous week, using equivalent seven-day windows, the same time zone, the same eligibility rules, and the same numerator and denominator definitions. The prior week is the comparison baseline, not proof of what caused the change.
I would first check whether the apparent decline could be a measurement issue. Specifically, I would inspect:
- Event tracking for fresh-produce views, cart activity, checkout, and purchase.
- Data freshness to confirm the latest events are fully loaded.
- Missing or duplicate events that could distort the numerator or denominator.
- Denominator changes, such as a session-definition change or unusual bot traffic.
- Segment integrity so mobile traffic, categories, markets, and other dimensions are classified consistently.
- Outliers or anomalies in traffic or conversion that could distort a seven-day comparison.
If one of these checks fails, I would correct it or explicitly account for it before claiming a business cause. A tracking or denominator problem can look like a true conversion problem.
Next I would test demand, availability, pricing, promotion, and funnel friction. For every branch, I would compare the relevant metric with the prior week and use segment cuts that can distinguish the hypothesis from the alternatives.
I would inspect fresh-produce traffic or product views, search and browse interest, new versus returning users, geography or store or market, day of week, and category or SKU mix.
If conversion falls while traffic composition shifts toward lower-intent users or search and browse interest weakens, demand could be contributing. If demand signals remain stable while the loss appears later in the purchase journey, demand becomes a weaker explanation.
I would inspect in-stock or eligible-assortment rate, unavailable-item exposure, substitutions, fulfillment method such as pickup, delivery, or shipping where relevant, geography or store or market, and category or SKU.
If conversion declines mainly where in-stock assortment worsens or unavailable-item exposure rises, availability becomes a strong candidate. I would still describe that as an observed association rather than proof of causation until alternative explanations are checked.
I would compare effective item price with the prior week, basket value, price changes by category or SKU, and geography or store or market.
If the conversion decline is concentrated in categories or markets with meaningful price changes while comparable segments remain stable, pricing becomes a stronger hypothesis. I would not invent competitor-price evidence unless reliable competitor data is actually available.
I would inspect promotion exposure, redemption rate, promotional traffic mix, campaign or offer cohort if available, new versus returning users, and category or SKU.
If the decline is concentrated among products or users with reduced promotional exposure, that helps distinguish promotion from a broad demand problem. I would also verify that promotion eligibility or attribution did not change, because a measurement change can mimic a promotion-performance change.
I would compare step conversion through the approved mobile journey, such as view to cart to checkout to purchase, using the actual event definitions. I would calculate drop-off by step and segment it by mobile OS, browser or app version, page or screen, and available latency or error signals.
If the overall decline is concentrated at one funnel step, especially within one mobile environment, that would make funnel friction a more focused hypothesis. For example, a checkout-to-purchase decline isolated to one app version would justify investigating that release, but it would still be an observation rather than a causal conclusion until validated.
Segmentation means comparing the same metric across meaningful groups to find where the abnormal variance is concentrated. The most useful early cuts are the ones tied directly to the hypothesis tree:
- Geography, store, or market for availability and local pricing differences.
- Category or SKU for availability, pricing, promotion, and product-mix changes.
- New versus returning users for demand or promotion differences.
- Mobile OS, browser, app version, page, or screen for funnel friction.
- Fulfillment method for availability-related problems.
- Campaign or offer cohort when promotion data is available.
I would avoid creating dozens of tiny slices during a 30-minute investigation. Sparse segments can produce noisy percentage changes and distract from the largest real deviation.
After testing the branches, I would identify the metric and segment with the largest meaningful deviation from the prior week. This is the strongest diagnostic signal, not automatically the root cause.
For example, if checkout-to-purchase conversion deteriorated sharply in one mobile environment while demand, availability, pricing, and promotion metrics remained broadly stable, I would report that funnel segment as the leading hypothesis. If instead in-stock rate worsened specifically in the markets with the conversion decline, availability would move higher in the ranking.
The important distinction is that descriptive analysis tells me what changed, diagnostic analysis tells me where the change is concentrated and what it is associated with, and causal evidence requires stronger validation than a week-over-week correlation.
Before recommending action, I would ask what else could create the same observed pattern. For example, a market with lower conversion may also have worse availability and a different category mix. A new app version may have launched at the same time a promotion ended. An aggregate decline may come from traffic shifting toward naturally lower-converting segments even if within-segment performance stays stable.
I would therefore verify control totals, numerator and denominator consistency, segment definitions, timing, and whether one outlier segment dominates the aggregate result. I would also compare related segments where possible to see whether the pattern persists. The first 30 minutes should produce a prioritized hypothesis, not unsupported certainty.
The action should match the strongest evidence. If availability is the leading hypothesis, I would investigate the affected assortment, market, fulfillment method, or substitution path. If funnel friction is strongest, I would inspect the affected page or screen, error signals, release history, or rollback options. If pricing or promotion appears strongest, I would validate the affected products and customer segments before making broad commercial changes.
I would focus first on the largest driver the team can influence and choose a reversible, proportionate action whenever possible.
After action is taken, I would keep tracking mobile fresh-produce conversion and the specific upstream metric tied to the hypothesis, broken down by the affected segment and compared with the relevant baseline. I would also monitor adjacent metrics so an apparent recovery is not simply caused by a denominator or traffic-mix change.
The interview summary is: define and validate the KPI, test the five hypothesis branches, compare each with the prior week across meaningful segments, find the largest abnormal variance, separate observation from causation, take the smallest justified action, and measure whether both the suspected driver and conversion improve.
- Confirm the decision owner, KPI definition, eligible mobile population, session grain, reporting window, time zone, and prior-week baseline.
- Validate event tracking, freshness, missing and duplicate events, denominator changes, segment integrity, and traffic or conversion outliers.
- Build five hypothesis branches: demand, availability, pricing, promotion, and funnel friction.
- For demand, compare fresh-produce traffic or product views, search or browse interest, new versus returning users, geography or market, day of week, and category or SKU mix.
- For availability, compare in-stock or eligible assortment, unavailable-item exposure, substitutions, fulfillment method, geography or market, and category or SKU.
- For pricing, compare effective item price, basket value, product-level price changes, and geography or market.
- For promotion, compare promotion exposure, redemption rate, promotional traffic mix, campaign or offer cohorts when available, user type, and category or SKU.
- For funnel friction, compare view-to-cart-to-checkout-to-purchase step conversion, drop-off by step, mobile OS, browser or app version, page or screen, and available latency or error signals.
- Compare every relevant metric with the prior week and across the segments tied to its hypothesis.
- Identify the metric and segment with the largest abnormal variance.
- State the result as a supported observation unless stronger causal evidence exists.
- Check alternative explanations, measurement failures, and aggregate-versus-segment mix effects.
- Recommend the smallest proportional action tied to the leading hypothesis.
- Track mobile fresh-produce conversion plus the affected upstream metric by segment to confirm or revise the hypothesis.
The main constraint is the 30-minute investigation window, not computational complexity. A broad five-branch scan is efficient because it uses a small set of high-value metrics and segment cuts first. The tradeoff is breadth versus depth: too many dimensions can create noise and waste time, while looking only at aggregate conversion can hide the real problem. The best approach starts broad, locates the largest abnormal variance, and drills down only where the evidence points. Data-quality checks also consume time, but skipping them can lead to diagnosing a tracking or denominator artifact as if it were a real customer-behavior change.
This tests whether I can turn a sudden KPI change into a fast, structured root-cause analysis. The interviewer wants to see whether I define the conversion metric and population correctly, validate the data before trusting the decline, build useful hypotheses across demand, availability, pricing, promotion, and funnel friction, choose metrics and segment cuts that distinguish those hypotheses, avoid confusing correlation with causation, and finish with a proportional action and measurement plan rather than simply listing dashboards or metrics.
Common mistakes are jumping directly to a business explanation before validating tracking; leaving the conversion numerator or denominator undefined; treating the reported 6% as six percentage points without clarification; mixing app and mobile-web behavior without checking whether the decline is concentrated in one; looking only at aggregate conversion instead of funnel steps and segments; ignoring availability and substitution effects for fresh produce; comparing mismatched time windows or time zones; slicing into tiny noisy segments; inventing competitor, promotion, latency, error, or experiment data that was not provided; treating correlation as causation; and recommending a broad intervention before identifying which measurable driver changed.
Present the answer as a timed diagnostic: define and validate the KPI first, then walk through the five hypothesis branches, name the discriminating metrics and segment cuts for each, and finish with the largest observed variance, the limitation that correlation is not causation, the smallest justified next action, and how you would measure whether it worked.