10 Bank of America Data Analyst Interview Questions & Answers

bank-of-america icon

Questions with Detailed ExplanationsWith Detailed Explanations

(Last Updated: September 13, 2026)

1. What is a recent event worldwide, and how do you think this would affect your investment strategies?Data AnalysisMediumBank Of America

Short Interview Answer (30-60 seconds)

A recent event I would focus on is the continuing Middle East conflict and disruption risk around the Strait of Hormuz, with Brent crude recently remaining above $100 per barrel. Sustained high energy prices could affect inflation, interest-rate expectations, transportation costs, corporate margins, and sectors differently. I would avoid making one large directional bet. Instead, I would review portfolio exposure by sector, geography, asset class, and interest-rate sensitivity, test several scenarios for how the disruption could develop, maintain diversification, and make measured adjustments only if the expected risk and return materially changed.

Detailed Explanation

The task is not simply to name a recent event. I need to explain how that event could move through the economy and financial markets, and then show how I would make an investment decision under uncertainty. A useful recent example is the continuing Middle East conflict and disruption risk around the Strait of Hormuz. On September 11, 2026, Brent crude settled at about $104.61 per barrel after reaching $109.97 intraday. The important analytical step is to separate what has already happened from what might happen next and avoid treating one market move as a guaranteed long-term trend.

Useful Questions to Ask the Interviewer
  1. Should I answer from the perspective of a diversified long-term investor or a shorter-term investment strategy?
  2. Would you like me to focus mainly on U.S. investments or include global exposure?
  3. Should I discuss particular asset classes, or focus on the analytical framework I would use?
How to Explain It in an Interview

I would start with the decision rather than with a trading idea: has this event changed the expected risk and return of my portfolio enough to justify an adjustment?

First, I would separate observed facts from assumptions. The observed facts include the geopolitical disruption risk and the recent rise in oil prices. A possible future effect is that sustained high energy prices could contribute to inflation, pressure corporate costs, influence interest-rate expectations, and slow economic activity. Those are plausible transmission channels, not guaranteed outcomes.

Next, I would define the measures before interpreting them. Relevant measures could include crude-oil prices, inflation data or inflation expectations, government-bond yields, equity returns, sector returns, credit spreads, and currency movements. I would compare each measure over a consistent time window with an appropriate pre-event baseline. I would also distinguish a one-day price movement from a sustained trend because short-term volatility alone is weak evidence for a long-term investment decision.

Then I would perform diagnostic analysis by mapping the possible transmission channels. Higher energy prices can raise transportation and production costs for energy-intensive businesses. If those costs contribute to persistent inflation, central banks may have less room to reduce interest rates or could maintain tighter policy. Higher rates can increase borrowing costs and reduce the present value of future cash flows, which can affect some investments more than others. Energy producers may have different exposure from airlines, transportation businesses, manufacturers, or other energy consumers.

That makes segmentation important. Segmentation means examining meaningful groups separately rather than assuming the entire portfolio will react in the same way. I would review the portfolio by sector, geography, asset class, interest-rate sensitivity, and dependence on energy costs. The purpose is to identify concentration risk and understand which exposures are most sensitive to each scenario.

For predictive analysis, I would avoid claiming that I know how the conflict will develop. I would use conditional scenarios instead. In a de-escalation scenario, shipping risk and energy prices could ease. In a prolonged-disruption scenario, elevated energy costs could continue to pressure inflation and company margins. In a more severe disruption scenario, supply constraints and market volatility could increase further. I would not assign probabilities unless I had a defensible method and supporting evidence.

I would then perform sensitivity analysis. I would test whether the investment conclusion remained similar under different assumptions about energy prices, interest rates, and the duration of disruption. I would derive any numerical scenario values from defensible data rather than inventing them. If a small assumption change completely reversed the recommendation, I would treat the conclusion as fragile and act cautiously.

I would also separate correlation from causation. If oil prices rise while technology shares fall, those movements happening together do not prove that higher oil caused the equity decline. Interest-rate expectations, earnings news, valuation changes, investor positioning, or other macroeconomic information could also contribute. I would examine timing and multiple related indicators before describing a likely causal mechanism.

Data quality is another important check. I would verify that market prices use consistent timestamps and currencies, confirm benchmark definitions, check for missing observations and duplicate records, and investigate unusual values rather than automatically removing them. Mismatched trading days, stale prices, or inconsistent definitions could create misleading comparisons.

The prescriptive step is deciding what action is justified. I would not make a large portfolio shift simply because the event is dramatic. If the analysis showed that the portfolio had unintended concentration in assets especially vulnerable to sustained energy inflation or higher interest rates, I might rebalance toward the intended risk level. I would preserve diversification instead of replacing one concentration with another.

Finally, I would define what evidence could change the decision. Examples include sustained changes in oil prices, shipping conditions, inflation data, interest-rate expectations, corporate earnings or margins, and the portfolio's measured exposure to those developments. I would review those indicators over time and revise the investment thesis when the evidence changes.

My conclusion would be measured: the conflict and energy-market disruption increase uncertainty and may affect sectors and asset classes differently, but they do not justify assuming one inevitable market outcome. I would use trend analysis, segmentation, scenario analysis, and sensitivity checks to understand the exposure, maintain diversification, and make only changes supported by a material shift in expected risk and return.

Technical Approach
  1. Define the investment decision and time horizon.
  2. Separate observed facts from assumptions about future effects.
  3. Define relevant measures such as energy prices, inflation indicators, bond yields, sector returns, and portfolio exposures.
  4. Select a consistent analysis window and appropriate pre-event baseline.
  5. Segment the portfolio by sector, geography, asset class, interest-rate sensitivity, and energy dependence where relevant.
  6. Map plausible economic transmission channels while separating correlation from causal evidence.
  7. Build de-escalation, prolonged-disruption, and more-severe-disruption scenarios without inventing probabilities.
  8. Run sensitivity checks to determine whether conclusions remain stable under different assumptions.
  9. Validate timestamps, currencies, benchmark definitions, missing observations, duplicates, and unusual values.
  10. Make only proportional investment adjustments supported by a material change in expected risk and return, then define indicators that would trigger reassessment.
Practical Insights

The main cost is the amount of analysis and data required rather than algorithmic complexity. Adding more sectors, countries, asset classes, scenarios, and time periods increases the amount of data to validate and compare. A fast headline-based decision is cheaper but more vulnerable to noise. A structured scenario and sensitivity analysis takes more work but provides a clearer view of uncertainty and concentration risk. The tradeoff is therefore speed versus confidence and robustness.

Why Interviewers Ask This

The interviewer is testing whether I can connect a current global event to financial markets using structured analysis rather than simply repeating a headline. The exact judgment is whether I can separate observed facts from assumptions, identify plausible economic transmission channels, evaluate uncertainty and alternative outcomes, and turn that reasoning into a proportionate investment decision.

Common interview mistakes

Common mistakes are naming a recent event without explaining its investment transmission channels, treating short-term market moves as permanent trends, assuming higher oil prices automatically help or hurt every company in a sector, confusing correlation with causation, predicting one geopolitical outcome with false certainty, ignoring the investor's time horizon, overlooking portfolio concentration, using inconsistent market-data timestamps, and failing to state what evidence would cause the investment view to change.

Interview tip

Present the answer as a clear chain: event, observed market change, economic transmission channels, affected exposures, scenarios, decision, and monitoring. Clearly distinguish facts from conditional assumptions. The strongest answer demonstrates disciplined judgment under uncertainty rather than pretending to predict markets perfectly.
Interviewer may ask next
How would you determine whether the market reaction is temporary volatility or a sustained trend?

I would define the investment horizon first and compare the post-event movement with an appropriate historical baseline instead of relying on one trading day. I would examine whether related indicators such as energy prices, inflation expectations, bond yields, sector returns, and credit conditions move consistently and whether the pattern persists over an appropriate period. I would also check whether new fundamental information supports the move. Persistence across several relevant measures would provide stronger evidence of a trend, although it still would not prove a single causal explanation.

What would you do if oil prices stayed high but equity markets continued to rise?

I would update the analysis rather than force the market to match my original expectation. I would segment the equity market to identify which sectors are driving the gains and examine earnings expectations, company margins, interest-rate expectations, and economic-growth indicators. Companies may be absorbing higher costs, passing them to customers, benefiting from other growth drivers, or reacting to unrelated information. If the portfolio remained within its intended risk profile and the evidence did not show material deterioration, I would avoid changing it merely because one scenario had predicted weaker equities. The investment thesis should change when the evidence changes.

2. How would you clean a customer-transactions dataset in Python before analysis?NEWData AnalysisMediumBank Of America

Question Details

Answer in Python with pandas. Address types, missing values, duplicates, invalid ranges, category normalization, date handling, outliers, and reconciliation to source control totals.

Short Interview Answer (30-60 seconds)

I would first preserve the source row count and transaction-amount control total, then standardize column names, numeric types, and transaction dates in UTC. I would measure missingness, remove duplicates using the agreed business key while retaining the excluded rows, validate required fields and amount ranges using business rules, and normalize category text. I would flag IQR outliers for review rather than deleting them automatically. Finally, I would reconcile clean rows plus duplicate and exception rows back to the source row count and control totals, investigate any unexplained difference, and only then export the analysis-ready dataset.

Detailed Explanation

See the Code while reading this explanation.

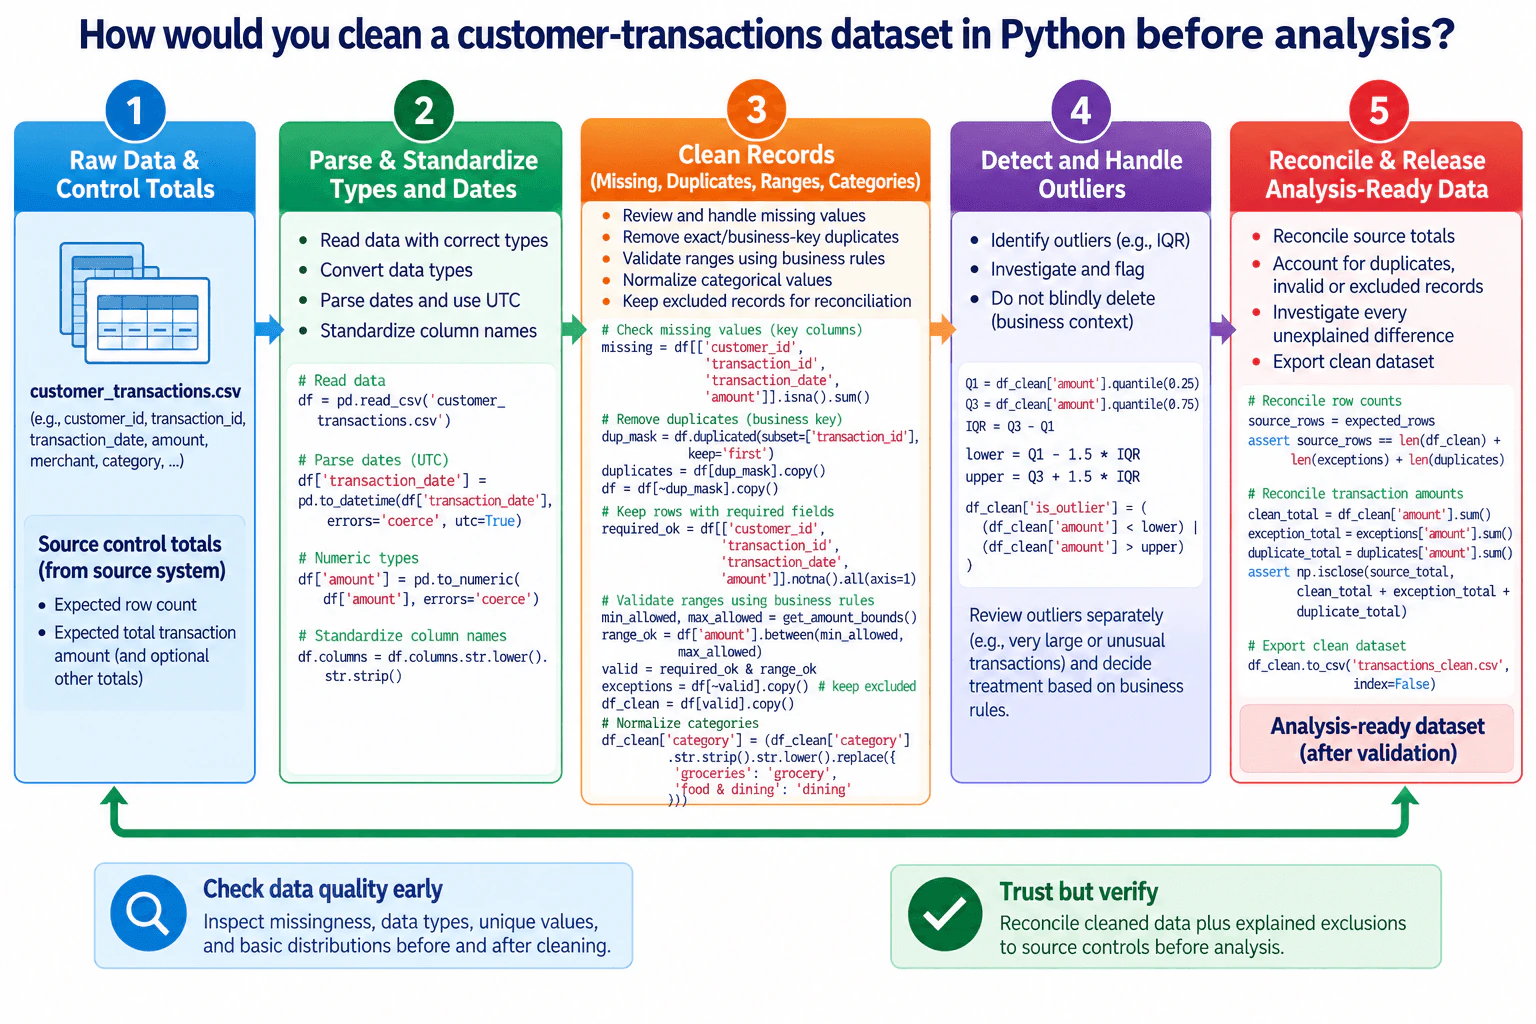
The goal is not simply to make the file look tidy. It is to create an analysis-ready transaction dataset while keeping a clear audit trail back to the source. I would first capture source control totals, then standardize columns, types, and dates. Next I would measure missing values, identify duplicate transactions, validate required fields and business ranges, and normalize categories. Outliers would be flagged for investigation instead of automatically removed. Before analysis, I would prove that retained data plus explained exclusions reconcile to the original source counts and transaction totals.

Useful Questions to Ask the Interviewer
  1. What does one row represent, and which field or fields define a unique transaction?
  2. Which fields are required for a transaction to be usable in analysis?
  3. What amount ranges are valid, and can legitimate refunds, reversals, or other negative values occur?
  4. What category values are considered equivalent and should be standardized together?
  5. What time zone should transaction dates use? If none is specified, should we standardize to UTC as in the proposed workflow?
  6. Which source control totals are authoritative: row count, total transaction amount, or additional controls?
  7. Should invalid records be corrected, quarantined, or excluded from the analysis-ready output?
How would you clean a customer-transactions dataset in Python before analysis? diagram
How to Explain It in an Interview

I would describe the cleaning as a controlled pipeline, not a series of destructive edits.

1. Capture the source controls first

Before changing anything, I would record the authoritative source row count and transaction-amount control total. Those values provide an independent baseline for reconciliation later. I would also keep the original input unchanged so every transformation can be traced.

2. Standardize names, numeric types, and dates

I would normalize column names with trimming and lowercase so later code is predictable. For amount, I would use pd.to_numeric(..., errors='coerce'); values that cannot be parsed become missing and can be investigated instead of being treated as valid numbers. For transaction_date, I would use pd.to_datetime(..., errors='coerce', utc=True) so invalid dates become missing and valid timestamps are represented consistently in UTC.

3. Measure missingness before deciding what to exclude

I would inspect missing values in important fields such as customer_id, transaction_id, transaction_date, and amount. I would not automatically fill a missing transaction amount with zero because zero has a business meaning and could distort analysis. Instead, required-field completeness becomes an explicit validity rule. Records that fail that rule remain traceable as exceptions.

4. Handle duplicates with an agreed business key

If transaction_id is the confirmed unique transaction key, I would use it to identify duplicates, keep the first accepted occurrence, and retain the duplicate rows separately. If the business instead defines uniqueness with a composite key, I would use that definition. The important point is that removed duplicates are not lost; they remain available for reconciliation and investigation.

5. Validate ranges using business rules

I would not invent a universal rule such as amount > 0, because legitimate refunds or reversals may exist. I would obtain the permitted lower and upper bounds from the business definition and evaluate the amount using between(min_allowed, max_allowed). On the deduplicated working dataframe, I would combine this range check with the required-field check so both masks refer to the same rows. Records that fail either rule go into an exception set, while valid rows become the clean working dataset.

6. Normalize categorical values

I would trim and lowercase category, then map known equivalent labels to canonical values. In the illustrated workflow, examples include mapping groceries to grocery and food & dining to dining. I would keep that mapping explicit and business-reviewed rather than relying on uncontrolled fuzzy replacements.

7. Flag outliers instead of deleting them blindly

For transaction amounts, I would calculate Q1 and Q3, derive IQR = Q3 - Q1, and flag values below Q1 - 1.5 * IQR or above Q3 + 1.5 * IQR. That is a review signal, not proof that the transaction is wrong. A very large or unusual transaction may be legitimate, so I would investigate business context before deciding whether it needs correction or exclusion.

8. Reconcile everything to the source

This is the control that makes the cleaning defensible. The source row count should equal clean rows plus exception rows plus duplicate rows. For transaction amounts, I would calculate totals for those same three groups and compare their sum with the authoritative source control total. I would use np.isclose for a tolerance-aware numeric comparison and investigate every unexplained difference instead of forcing the totals to match. This reconciliation assumes the source control total is defined on the same population and amount basis as the parsed transaction data; if it is not, I would first obtain a comparable control.

9. Release the analysis-ready dataset only after validation

After the controls pass, I would export the clean dataset and retain duplicate and exception records as supporting audit outputs. I would also compare missingness, unique values, basic distributions, and row counts before and after cleaning. The result is a dataset that is easier to analyze without losing evidence about what changed or why.

The key tradeoff is between aggressive cleaning and traceability. Automatically deleting questionable records may produce a smaller, cleaner-looking dataset, but it can remove legitimate transactions and break reconciliation. Keeping explicit duplicate and exception sets takes additional memory and code, but it makes the process safer, explainable, and reproducible.

Technical Approach
  1. Read the source dataset and retain the authoritative source control totals before transformation.
  2. Standardize column names.
  3. Convert amount to numeric with invalid values coerced to missing.
  4. Parse transaction_date with invalid values coerced to missing and standardize dates to UTC.
  5. Profile missing values in required fields.
  6. Identify duplicates using the confirmed transaction business key, retain duplicate rows separately, and remove them from the working set.
  7. Build the required-field completeness mask on the deduplicated working dataframe.
  8. Validate amount using business-provided lower and upper bounds on that same dataframe.
  9. Combine the required-field and range masks, store failing records in an exception set, and retain passing records in df_clean.
  10. Normalize categorical values using an explicit reviewed mapping.
  11. Calculate Q1, Q3, and IQR on the clean amount field and flag outliers for review without automatically deleting them.
  12. Reconcile source row count to clean rows plus exceptions plus duplicates.
  13. Reconcile the source transaction total to clean, exception, and duplicate totals on the same control basis.
  14. Investigate every unexplained difference, then export the validated clean dataset.
Practical Insights

Most cleaning operations scan the rows once, so the practical cost is roughly linear in the number of transactions. Duplicate detection, boolean masks, and retained exception datasets also consume memory. Keeping duplicates and invalid rows separately uses more memory than deleting them immediately, but that extra cost provides the audit trail needed to reconcile the cleaned result back to the source. IQR calculations and category normalization are straightforward for typical analyst-sized datasets; very large extracts may need chunking or upstream database processing.

Code
import numpy as np
import pandas as pd

# Authoritative source/business inputs supplied outside this cleaning step:
# expected_rows: source row-count control
# expected_total: source transaction-amount control total
# min_allowed, max_allowed: approved business bounds for amount

# 1. Read data
df = pd.read_csv("customer_transactions.csv")

# 2. Standardize column names
df.columns = df.columns.str.lower().str.strip()

# 3. Parse dates and numeric fields
df["transaction_date"] = pd.to_datetime(
    df["transaction_date"],
    errors="coerce",
    utc=True,
)
df["amount"] = pd.to_numeric(df["amount"], errors="coerce")

# 4. Profile missing values in required fields
required_cols = [
    "customer_id",
    "transaction_id",
    "transaction_date",
    "amount",
]
missing = df[required_cols].isna().sum()

# 5. Capture duplicates, then remove them from the working set
dup_mask = df.duplicated(subset=["transaction_id"], keep="first")
duplicates = df[dup_mask].copy()
df = df[~dup_mask].copy()

# 6. Required-field and business-range validation on the same dataframe
required_ok = df[required_cols].notna().all(axis=1)
range_ok = df["amount"].between(min_allowed, max_allowed)
valid = required_ok & range_ok

exceptions = df[~valid].copy()
df_clean = df[valid].copy()

# 7. Normalize categories using reviewed business mappings
category_map = {
    "groceries": "grocery",
    "food & dining": "dining",
}
df_clean["category"] = df_clean["category"].str.strip().str.lower().replace(category_map)

# 8. Flag IQR outliers for investigation, not automatic deletion
q1 = df_clean["amount"].quantile(0.25)
q3 = df_clean["amount"].quantile(0.75)
iqr = q3 - q1
lower = q1 - 1.5 * iqr
upper = q3 + 1.5 * iqr

df_clean["is_outlier"] = (df_clean["amount"] < lower) | (df_clean["amount"] > upper)

# 9. Reconcile row counts
source_rows = expected_rows
assert source_rows == len(df_clean) + len(exceptions) + len(duplicates)

# 10. Reconcile transaction-amount controls
clean_total = df_clean["amount"].sum()
exception_total = exceptions["amount"].sum()
duplicate_total = duplicates["amount"].sum()

assert np.isclose(
    expected_total,
    clean_total + exception_total + duplicate_total,
), "Transaction amount does not reconcile to the source control total"

# 11. Release only after validation
df_clean.to_csv("transactions_clean.csv", index=False)
Why Interviewers Ask This

This tests whether the candidate can turn raw transaction data into a trustworthy analysis-ready dataset without silently changing its meaning. The interviewer is looking for disciplined pandas work: correct types and dates, explicit missing-value and duplicate rules, business-rule validation, category normalization, careful outlier treatment, traceable exclusions, and reconciliation back to source control totals.

Common interview mistakes

Common mistakes are filling missing transaction amounts with zero without a business rule; deleting duplicates without retaining them for reconciliation; assuming every negative amount is invalid; normalizing categories with uncontrolled replacements; parsing dates without handling invalid values or time zones; automatically deleting IQR outliers; building boolean masks from different dataframe states so their indexes do not align; and checking only the cleaned total instead of reconciling clean rows plus explained exclusions back to source controls.

Interview tip

Present this as a five-stage control flow: preserve source totals, standardize types and dates, clean records while retaining exclusions, flag rather than blindly delete outliers, and reconcile before release. Emphasize that every removed row remains explainable and that business rules define validity; pandas only implements those rules.

Interviewer may ask next
What would you do if `transaction_id` is not guaranteed to be unique?

I would first ask for the business definition of a unique transaction instead of assuming transaction_id is sufficient. The key might be a composite of several fields or a different source identifier. I would build the duplicate mask from that approved key, inspect collisions, retain duplicate rows separately, and rerun the reconciliation. Deduplication has to match the dataset's true row grain; otherwise legitimate transactions can be removed.

What if the cleaned amount plus exclusions still does not reconcile to the source total?

I would not force the numbers to match. I would verify that the source control total uses the same population and amount definition, inspect records whose amounts became missing during numeric conversion, confirm how duplicates are represented in the source control, check refunds or reversals, verify extraction boundaries, and make sure no rows were lost between processing stages. If the control and parsed data are not comparable, I would document that limitation and obtain the correct control before approving the dataset.

3. Given a dataset of sales results, how would you determine which factors are affecting sales?Data AnalysisMediumBank Of America

Question Details

Define the outcome metric, examine trends and segments, test competing explanations, control for seasonality and mix, and turn findings into a decision.

Short Interview Answer (30-60 seconds)

I would first define what sales means for the decision, such as eligible net sales revenue or units sold, along with the population, grain, time window, and baseline. Then I would validate the data and examine trends and segments such as product, channel, region, and customer cohort. Next, I would test plausible factors like price, promotions, seasonality, product mix, and customer behavior, using multivariable analysis when appropriate so I can compare factors while controlling for others. I would check model diagnostics and alternative explanations, treat observational results as associations rather than automatic proof of causation, then recommend an action and measure its impact against the original baseline.

Detailed Explanation

The goal is not simply to find variables that move with sales. I first need to define what sales means, who or what is included, and what business decision the analysis should support. Then I would check the data, study changes over time and across useful segments, and test several possible explanations together. This helps separate real patterns from changes caused by seasonality, product mix, or other factors. I would validate the analysis, describe uncertainty honestly, avoid claiming causation from observational data alone, and finish with an action whose impact can be measured.

Useful Questions to Ask the Interviewer
  1. What decision will this analysis support, and who is the decision owner?
  2. Should the outcome be net sales revenue, units sold, or another sales KPI?
  3. Which transactions are eligible, and how should returns, cancellations, test records, or other exclusions be handled?
  4. What is the required unit of analysis, such as product-week, store-day, or customer-period?
  5. What time window, reporting calendar, and time zone should I use, and are there known seasonal cycles?
  6. Which potential factors are available in the data, such as price, promotion, channel, region, product category, inventory, or customer attributes?
  7. What comparison baseline is most useful, such as the previous period or the same period in a prior year?
  8. Is the goal to identify associations for decision support, or is causal evidence required before acting?
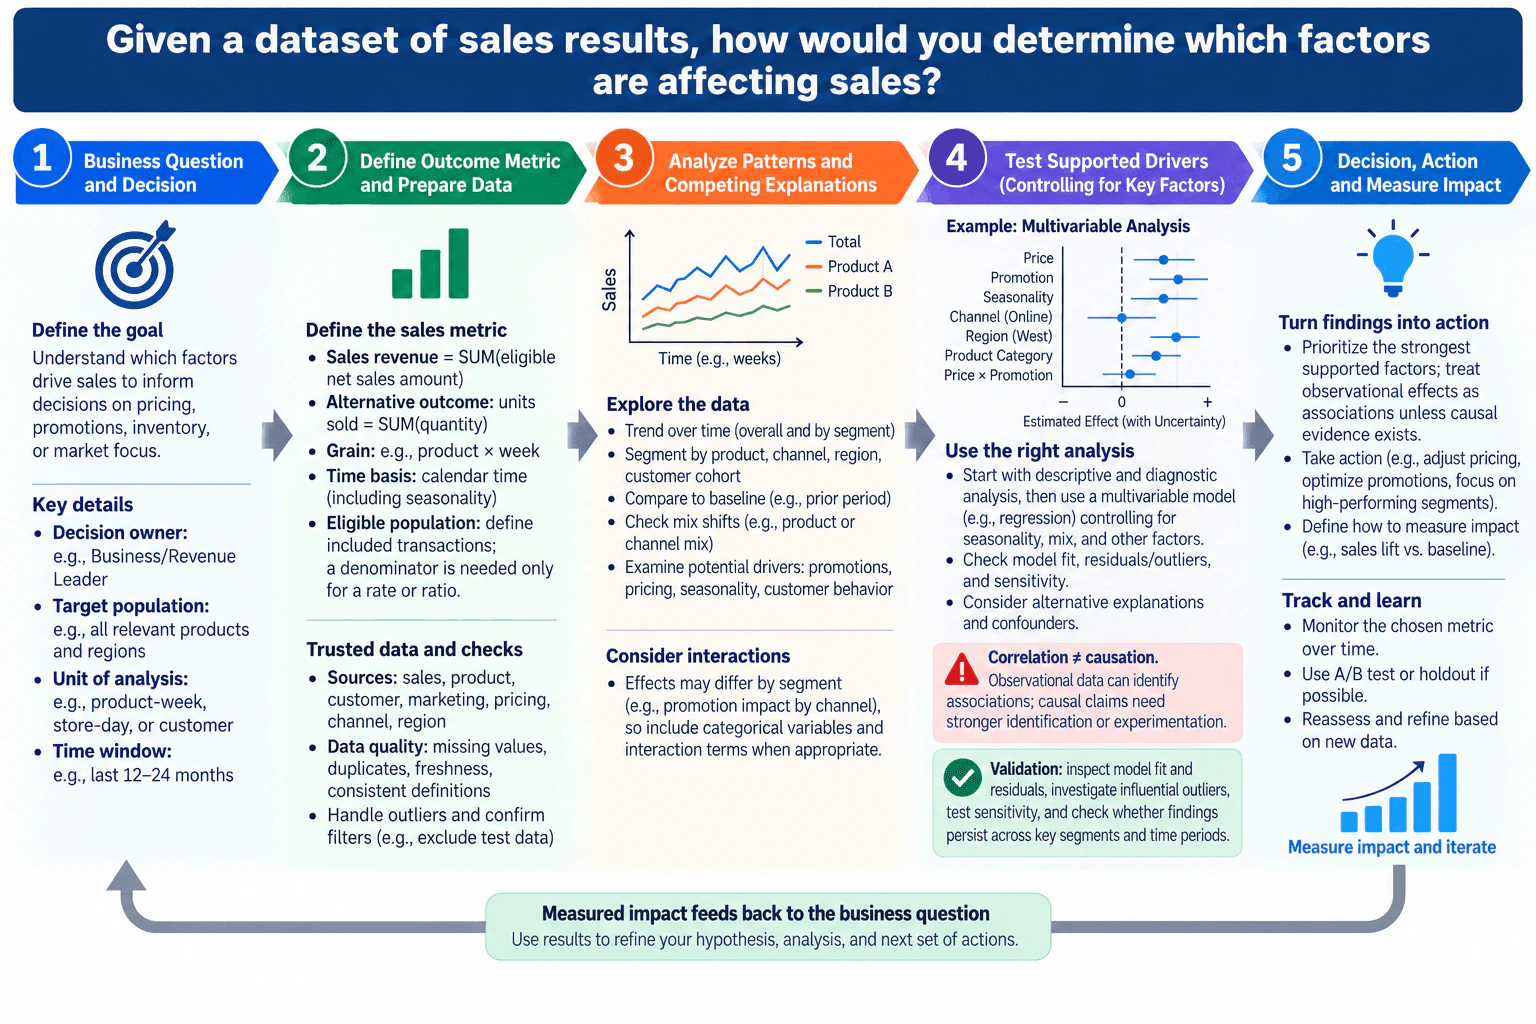
Given a dataset of sales results, how would you determine which factors are affecting sales? diagram
How to Explain It in an Interview
1. Start with the business question and decision

I would first clarify what the business is trying to decide. The analysis might support a decision about pricing, promotions, inventory, or market focus, but I would not assume which one without context. This matters because the useful analysis depends on the decision rather than on whichever statistical technique is easiest to run.

I would identify the decision owner, eligible population, unit of analysis, and time window. The diagram uses examples such as product-week, store-day, or customer-level grain, but I would choose the actual definitions from the available business context rather than invent them.

2. Define the outcome metric before exploring the data

I would define the sales KPI precisely. For an additive outcome, a valid definition could be:

Sales revenue = SUM(eligible net sales amount)

An alternative outcome could be:

Units sold = SUM(quantity)

A total such as revenue or units does not require a denominator. A denominator is needed when the KPI is a rate or ratio, such as revenue per customer or conversion rate. I would also document the eligible transactions, currency if revenue is used, reporting calendar, time zone where relevant, and the grain at which the metric will be analyzed.

This prevents a common problem where different teams use the word "sales" but calculate it differently.

3. Validate the inputs before interpreting patterns

Before drawing conclusions, I would verify that the data is trustworthy. I would check missing values, duplicates, freshness, inconsistent definitions, unexpected gaps in time, and unusual observations. I would also verify instrumentation or source-system behavior so that apparent changes are not caused by a tracking, ingestion, or definition change. If sales, product, customer, marketing, pricing, channel, or region data are joined, I would check join coverage and row counts so the joins do not duplicate or silently drop eligible records.

I would confirm filters and exclusions so that test records, cancelled transactions, returns, or other non-eligible rows are handled consistently when applicable. I would also reconcile totals against a trusted control when one is available.

For outliers, I would investigate them rather than automatically remove them. An unusual sales spike might be a data error, but it could also represent a genuine promotion, holiday, bulk purchase, or other important event.

4. Perform descriptive trend and segmentation analysis

I would next establish what happened. I would plot the sales metric over time and compare it with a meaningful baseline. Trend analysis helps reveal growth, decline, abrupt changes, recurring seasonal patterns, and unusual periods.

Then I would segment the outcome across dimensions supported by the data, such as product, channel, region, customer cohort, or other business-relevant groups. Segmentation means breaking the overall result into meaningful groups to see whether the pattern is broad or concentrated.

For example, if total sales declined, I would check whether the decline appears across most segments or is concentrated in a particular product, channel, or region. I would also examine mix shifts. Overall sales can change because the composition of products, customers, or channels changed even when performance within individual groups stayed relatively stable.

5. Form competing explanations

The descriptive analysis tells me what changed, but it does not yet tell me why. I would create plausible hypotheses using only factors supported by the available data and business context. Examples might include price, promotions, seasonality, product mix, channel mix, region, and customer behavior.

I would explicitly consider alternative explanations. If sales increased during a promotion, for example, the increase might also coincide with a seasonal peak or a shift toward higher-selling products. Looking at one factor at a time could therefore be misleading.

6. Test supported factors while controlling for other variables

When the data and assumptions support it, I would use a multivariable model such as regression to estimate how each factor is associated with sales while accounting for other included factors. The outcome would be the defined sales metric, while explanatory variables could include supported dimensions such as price, promotion, seasonality, channel, region, and product category.

The purpose is not simply to produce coefficients. It is to test whether an apparent relationship remains after accounting for competing explanations. I would include interaction terms only when there is a business reason to expect an effect to vary by segment, such as a promotion working differently by channel.

For time-based sales data, I would make seasonality explicit rather than attributing recurring calendar movements to another factor. I would also account for relevant mix changes so that a shift in the product, channel, or customer composition is not incorrectly attributed to price, promotion, or another variable.

7. Interpret effects with uncertainty

I would report the direction and estimated size of supported associations together with uncertainty rather than ranking factors only by coefficient size. Different variables may use different units, so a larger-looking coefficient is not automatically the most important business effect.

I would distinguish the type of conclusion being made:

  • Descriptive: what happened to sales.
  • Diagnostic: which observed factors are associated with the change after reasonable controls.
  • Predictive: whether a validated model can estimate future sales under the conditions it was designed for, if prediction is actually required.
  • Prescriptive: what action is justified by the evidence and business context.

I would avoid converting an observational association into a causal statement. A regression can help control for measured factors, but omitted variables, measurement error, selection effects, or reverse relationships may still explain part of an association.

8. Validate the findings

I would inspect model fit and residuals, investigate influential outliers, test sensitivity to reasonable modeling choices, and check whether the main findings persist across important segments and time periods. I would also look for multicollinearity when explanatory variables overlap heavily because unstable coefficients can make individual factor estimates difficult to interpret.

I would compare the statistical results with the descriptive evidence. If a model says a factor is important but the relationship is inconsistent across basic segment or time checks, I would investigate the discrepancy before recommending an action.

Where feasible, I would use a holdout period or another independent validation approach to check whether the relationship generalizes rather than merely fitting historical noise. Validation would not by itself establish causality; it would show whether the analytical relationship is reasonably stable and reproducible.

9. Separate association from causation

This is a critical limitation. Observational sales data can identify associations, but it does not by itself prove that changing a factor will cause sales to change.

If the business needs causal evidence, I would prefer a suitable experiment, such as an A/B test or another credible identification strategy when experimentation is not possible. Before making a broad pricing or promotion change, for example, I would want evidence that separates the proposed action from seasonality, customer selection, mix changes, and other simultaneous influences.

10. Turn the finding into a proportional decision

I would summarize the strongest supported factors, the evidence behind them, and the main limitations. The recommendation should be proportional to the strength of the evidence. Strong observational evidence may justify a targeted test or limited operational change, while stronger causal evidence may support a broader rollout.

I would define the success metric before acting and compare the result with an appropriate baseline. If an experiment is possible, I would use it to estimate incremental impact. Otherwise, I would monitor the same KPI over time and use the best available comparison while clearly stating its limitations.

The final step is a feedback loop: measured impact should feed back into the original business question. If the expected improvement does not appear, I would revisit the hypotheses, data quality, segmentation, model specification, and alternative explanations rather than assuming the original conclusion was correct.

Technical Approach
  1. Clarify the business decision, decision owner, and required outcome.
  2. Define the sales KPI, eligible population, grain, units, time window, reporting calendar, time zone, and comparison baseline.
  3. Validate data quality by checking instrumentation, source consistency, missing values, duplicates, freshness, joins, filters, gaps, and outliers; reconcile to a trusted total when available.
  4. Plot the sales metric over time to identify trends, seasonality, structural changes, and unusual periods.
  5. Segment sales across relevant dimensions such as product, channel, region, and customer cohort when those fields exist.
  6. Examine mix shifts so changes in product, channel, or customer composition are not mistaken for another factor's effect.
  7. Form competing hypotheses for supported factors such as price, promotions, seasonality, mix, and customer behavior.
  8. Use appropriate multivariable analysis to estimate associations while controlling for relevant competing factors; add interactions only when justified.
  9. Validate the analysis using model diagnostics, residuals, influential-point checks, multicollinearity checks, sensitivity analysis, segment stability, time stability, and a holdout when feasible.
  10. Separate association from causal evidence and use experimentation or a stronger identification strategy when a causal claim is required.
  11. Recommend an action proportional to the evidence, define the impact metric and baseline, measure results, and feed the outcome back into the next analysis cycle.
Practical Insights

The exploratory work is usually inexpensive compared with the effort required to prepare trustworthy data. Trend and segment summaries generally scale with the number of rows being processed. A multivariable model becomes more demanding as the dataset and number of factors grow, but for typical analyst-sized problems the larger practical costs are data cleaning, selecting defensible variables, checking assumptions, and explaining the results. Adding many variables can make a model harder to interpret and can introduce instability when predictors overlap. A simpler model may be easier to explain, while a richer model may control more competing factors but requires stronger validation.

Why Interviewers Ask This

The interviewer wants to see whether I can turn a broad business question into a disciplined analysis: define the outcome correctly, find meaningful patterns, distinguish apparent relationships from supported explanations, control for factors such as seasonality and changing mix, validate the evidence, and connect the analysis to a measurable business decision.

Common interview mistakes

Common mistakes are starting with a tool instead of the business decision; using an undefined meaning of sales; mixing incompatible grains, populations, currencies, calendars, or time windows; ignoring returns or other eligibility rules; skipping instrumentation, missing-value, duplicate, freshness, join, and outlier checks; examining only overall averages and missing important segment or mix changes; attributing seasonal movements to price or promotions; testing one variable at a time while ignoring competing explanations; interpreting coefficients without considering units or uncertainty; adding many correlated variables without diagnostics; removing outliers automatically; treating observational correlation as proof of causation; inventing findings the data has not established; and making a recommendation without defining how its impact will be measured.

Interview tip

Present the answer as one clean flow: decision and KPI first, trusted data second, trends and segments third, controlled analysis fourth, and action plus measurement last. Explicitly say that observational results show associations unless stronger causal evidence exists. That demonstrates both analytical depth and business judgment.

Interviewer may ask next
What would you do if price and promotion are highly correlated, making their individual effects unstable?

I would first confirm the overlap with correlation and multicollinearity diagnostics and inspect how the variables were generated. I would avoid interpreting unstable individual coefficients as reliable effects. Depending on the decision, I might redesign the specification, combine or re-express variables only when that has a valid business meaning, compare sensitivity across reasonable models, or seek data where price and promotion vary more independently. If the business needs to know the causal effect of one factor separately, historical observational data may be insufficient, so I would recommend an experiment or another identification strategy that creates credible independent variation.

How would your approach change if leadership needed a causal answer before changing prices?

I would treat the observational analysis as hypothesis generation rather than final proof. I would still define the KPI, validate the data, identify segments, study seasonality and mix, and use historical models to understand likely risks and design the test. But the decision would depend on a credible causal design. If feasible, I would run a randomized price experiment with an appropriate control group, predefined success metrics, guardrails, and enough observation time to capture relevant seasonal behavior. If randomization were not feasible, I would consider a defensible quasi-experimental design, document its assumptions, test those assumptions where possible, and communicate that its causal confidence is weaker than a well-run randomized experiment.

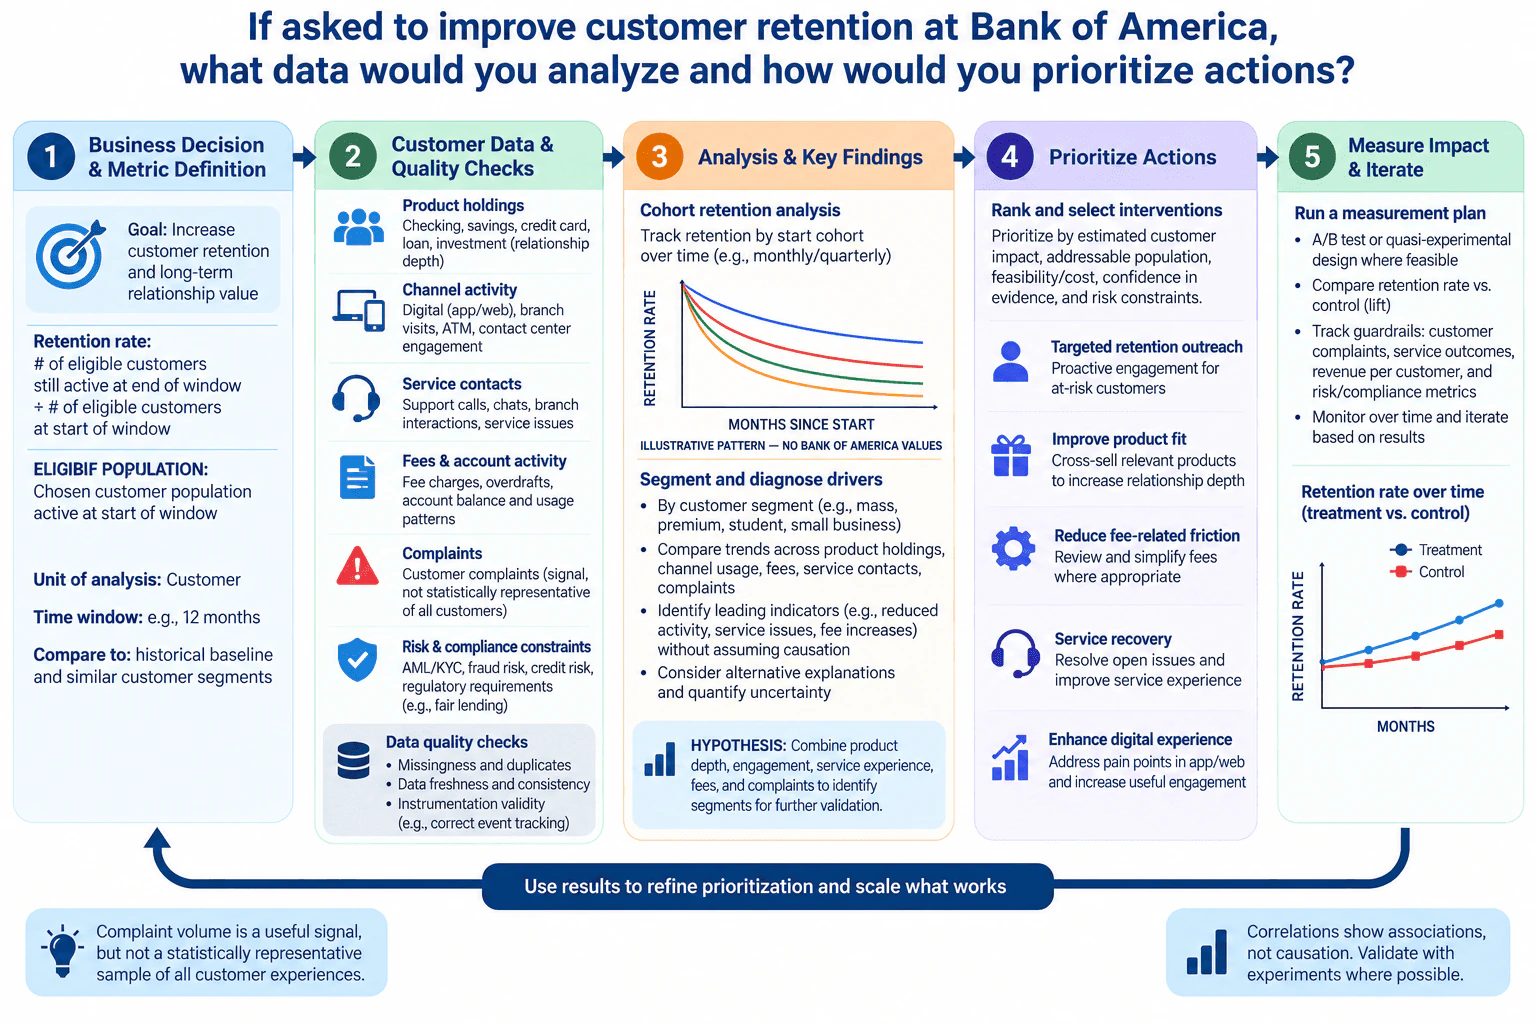
4. If asked to improve customer retention at Bank of America, what data would you analyze and how would you prioritize actions?Data AnalysisHardBank Of America

Question Details

Cover cohort retention, product holdings, channel activity, service contacts, fees, complaints, risk constraints, segmentation, leading indicators, and a measurement plan.

Short Interview Answer (30-60 seconds)

I would first define retention clearly: the share of eligible customers who are still active at the end of a chosen window among those active at the start. Then I would analyze cohort retention together with product holdings, channel activity, service contacts, fees, complaints, and risk or compliance constraints. I would segment customers and look for leading indicators such as declining activity or repeated service issues, treating them as hypotheses rather than proven causes. I would prioritize actions by expected customer impact, addressable population, feasibility and cost, confidence in the evidence, and risk constraints, then test the best actions with A/B or quasi-experimental methods and monitor retention plus guardrails.

Detailed Explanation

The task is to identify which customer behaviors and experiences are most useful for understanding retention, then turn that analysis into a practical action plan. I would define retention before exploring the data, choose the eligible customer population and time window, and use the customer as the unit of analysis. Then I would compare retention across cohorts and segments using product holdings, channel activity, service contacts, fees, complaints, and risk constraints. The goal is not to claim causation from patterns alone, but to form testable hypotheses, prioritize interventions, and measure whether they actually improve retention.

Useful Questions to Ask the Interviewer
  1. How should we define an eligible customer and an "active" customer for retention?
  2. What retention window matters most for the business decision: monthly, quarterly, annual, or another period?
  3. Which customer population is in scope, and are there important product, tenure, value, or other approved customer segments?
  4. Which actions are available to the business, and what risk, compliance, cost, or operational constraints apply?
  5. Do we have reliable customer-level history for product holdings, channel activity, service contacts, fees, complaints, and outcomes?
  6. Can we run randomized tests, or would we need a quasi-experimental design?
If asked to improve customer retention at Bank of America, what data would you analyze and how would you prioritize actions? diagram
How to Explain It in an Interview

I would organize the work as the same five-step flow shown in the final diagram: define the business decision and metric, validate the customer data, analyze cohorts and drivers, prioritize actions, and measure impact before iterating.

1. Define the business decision and retention KPI

I would start with the decision: which retention actions should receive attention first. Before looking for patterns, I would define the eligible population, customer grain, time window, active-status rule, and comparison baseline.

The unit of analysis is the customer. A defensible retention rate is:

Retention rate = number of eligible customers still active at the end of the window / number of eligible customers active at the start of the window.

The exact meaning of "eligible" and "active" must be agreed with the business. I would compare the result with an appropriate historical baseline and with similar customer segments rather than assuming one overall rate explains every group.

2. Build and validate the customer data

I would combine the data categories shown in the diagram:

  • Product holdings: checking, savings, credit card, loan, investment, balances, and relationship depth where available.
  • Channel activity: digital app or web activity, branch visits, ATM usage, and contact-center engagement.
  • Service contacts: support calls, chats, branch interactions, service issues, and resolution outcomes where available.
  • Fees and account activity: fee charges, overdrafts, account balances, and usage patterns.
  • Complaints: complaint events and themes. Complaint volume is useful as a signal, but I would not treat it as statistically representative of every customer experience.
  • Risk and compliance constraints: fraud, identity or KYC controls, credit risk, regulatory requirements, and fair-treatment considerations.

Before analyzing retention, I would check missingness, duplicates, freshness, customer identity matching, event timestamps, instrumentation validity, and relevant outliers. For example, broken tracking could make digital activity appear to decline when customer behavior did not actually change.

3. Analyze cohort retention and diagnose drivers

Cohort analysis means grouping customers by a common starting point and following retention over time. I would compare retention patterns across start cohorts without inventing Bank of America benchmark values.

Then I would segment the population using business-relevant dimensions such as product holdings, relationship depth, channel behavior, service experience, tenure, and other approved customer attributes. I would compare trends across these groups to identify where retention differs and where the addressable population is meaningful.

I would also examine leading indicators such as reduced activity, repeated service contacts, unresolved issues, fee increases, or complaint activity. These are descriptive or diagnostic signals, not proof of causation. I would check alternative explanations, customer-mix changes, seasonality, sparse segments, and data-quality problems before drawing conclusions.

The supported output of this stage should therefore be a hypothesis, consistent with the diagram: combine product depth, engagement, service experience, fees, and complaints to identify segments for further validation. I would not describe those customers as definitively at risk until the evidence supports that conclusion.

4. Prioritize actions

I would rank candidate interventions using five criteria:

  1. Expected customer impact: how plausible and material the retention benefit could be.
  2. Addressable population: how many eligible customers the action can realistically reach.
  3. Feasibility and cost: operational effort, implementation complexity, and economics.
  4. Confidence in evidence: how strongly the analysis supports the hypothesis.
  5. Risk constraints: compliance, fraud, credit, privacy, fairness, and customer-treatment considerations.

Candidate actions consistent with the diagram include targeted retention outreach, improving product fit, reducing avoidable fee-related friction, resolving service issues, and improving digital experiences. I would treat these as interventions to test rather than assuming any one of them will increase retention.

A service-recovery action with strong evidence, low implementation risk, and a clearly addressable population may outrank a broad product cross-sell idea with weaker evidence. An action with apparent upside should also be deprioritized if it creates unacceptable compliance, fairness, credit, fraud, privacy, or customer-treatment risk.

5. Measure impact and iterate

For actions that can be randomized, I would use an A/B test with a clearly defined treatment group, control group, eligibility rule, intervention date, and follow-up window. If randomization is not feasible, I would use the strongest practical quasi-experimental design and document its assumptions and limitations.

The primary outcome is retention rate for the eligible population. I would compare treatment with control and also monitor guardrails such as complaints, service outcomes, revenue per customer where relevant, and risk or compliance metrics. I would examine whether effects differ across important segments instead of relying only on an overall average.

If an intervention improves retention without unacceptable guardrail movement, I would scale it cautiously and continue monitoring. If it does not, I would investigate whether the hypothesis was wrong, implementation failed, the effect differed by segment, or the measurement window was inappropriate. Those results would feed back into the next prioritization cycle.

The key principle is that correlations show associations, not causation. The analysis should generate evidence-based hypotheses, and experiments or strong quasi-experimental designs should validate whether the proposed actions actually change retention.

Technical Approach
  1. Define the retention decision, eligible population, customer grain, active-status rule, time window, and comparison baseline.
  2. Assemble customer-level product, channel, service, fee, complaint, and risk/compliance data.
  3. Validate customer identity matching, missingness, duplicates, freshness, timestamps, instrumentation, and relevant outliers.
  4. Calculate retention consistently using the agreed numerator, denominator, and window.
  5. Compare retention across start cohorts and meaningful customer segments.
  6. Examine leading indicators and diagnostic patterns while separating association from causation and checking alternative explanations.
  7. Convert supported patterns into explicit retention hypotheses.
  8. Rank candidate actions by expected customer impact, addressable population, feasibility/cost, evidence confidence, and risk constraints.
  9. Test prioritized actions with A/B experiments where feasible or a documented quasi-experimental design otherwise.
  10. Compare treatment with control, monitor retention and guardrails, and feed the measured results back into prioritization.
Practical Insights

The difficult part is not the retention-rate formula; it is joining and validating customer histories across products, channels, service, fees, complaints, and risk systems at a consistent customer grain and time window. Cohort and segment analysis becomes more expensive as the number of customers, events, history periods, and segment combinations grows. More granular segmentation can reveal useful differences, but small groups create noisier estimates and can introduce governance or privacy concerns. Experiments add operational cost and time, but they provide stronger evidence than observational correlations. I would use the simplest segmentation and measurement design that can reliably support the decision.

Why Interviewers Ask This

This tests whether I can turn a broad retention goal into a measurable customer-level analysis, distinguish useful signals from causes, respect banking risk constraints, prioritize actions by expected value and feasibility, and design a credible measurement plan instead of jumping directly to tactics.

Common interview mistakes

Common mistakes are defining retention after seeing the data; changing the denominator across cohorts; mixing customer, account, and interaction grains; treating complaints as representative of all customers; assuming a correlated signal causes churn; using future information when constructing leading indicators; ignoring missing or broken instrumentation; creating tiny segments with unstable results; ranking actions only by apparent impact while ignoring cost, feasibility, or risk; and declaring an intervention successful without a control group or credible counterfactual.

Interview tip

Lead with the decision and retention definition, then walk through trusted data, cohort and segment analysis, prioritization, and measurement in that order. State explicitly that leading indicators are hypotheses until validated, and finish by explaining how treatment-versus-control results and guardrails would change the next decision.

Interviewer may ask next
What would you do if declining digital activity is strongly associated with churn, but you are not sure it causes churn?

I would treat declining digital activity as a leading indicator, not a causal conclusion. First I would verify event tracking and examine timing, customer mix, seasonality, and alternative explanations such as customers shifting to another channel. I would check whether the relationship remains within comparable cohorts and segments. If the signal is still useful, I would test an appropriate intervention for eligible customers, preferably with random assignment. If randomization is not feasible, I would use a documented quasi-experimental design. I would only make a causal claim if the measurement design supports it.

How would your prioritization change if the highest-risk segment is small and expensive to reach?

I would not rank the segment only by its predicted risk. I would compare expected retention benefit, addressable population, customer value where relevant, intervention cost, evidence confidence, feasibility, and risk constraints. A small, expensive segment might still justify a targeted action if the expected value is high and the intervention is appropriate, but a larger segment with a more modest retention opportunity could produce greater total benefit at lower cost. I would test the strongest options and use measured incremental retention plus guardrails to update the ranking.

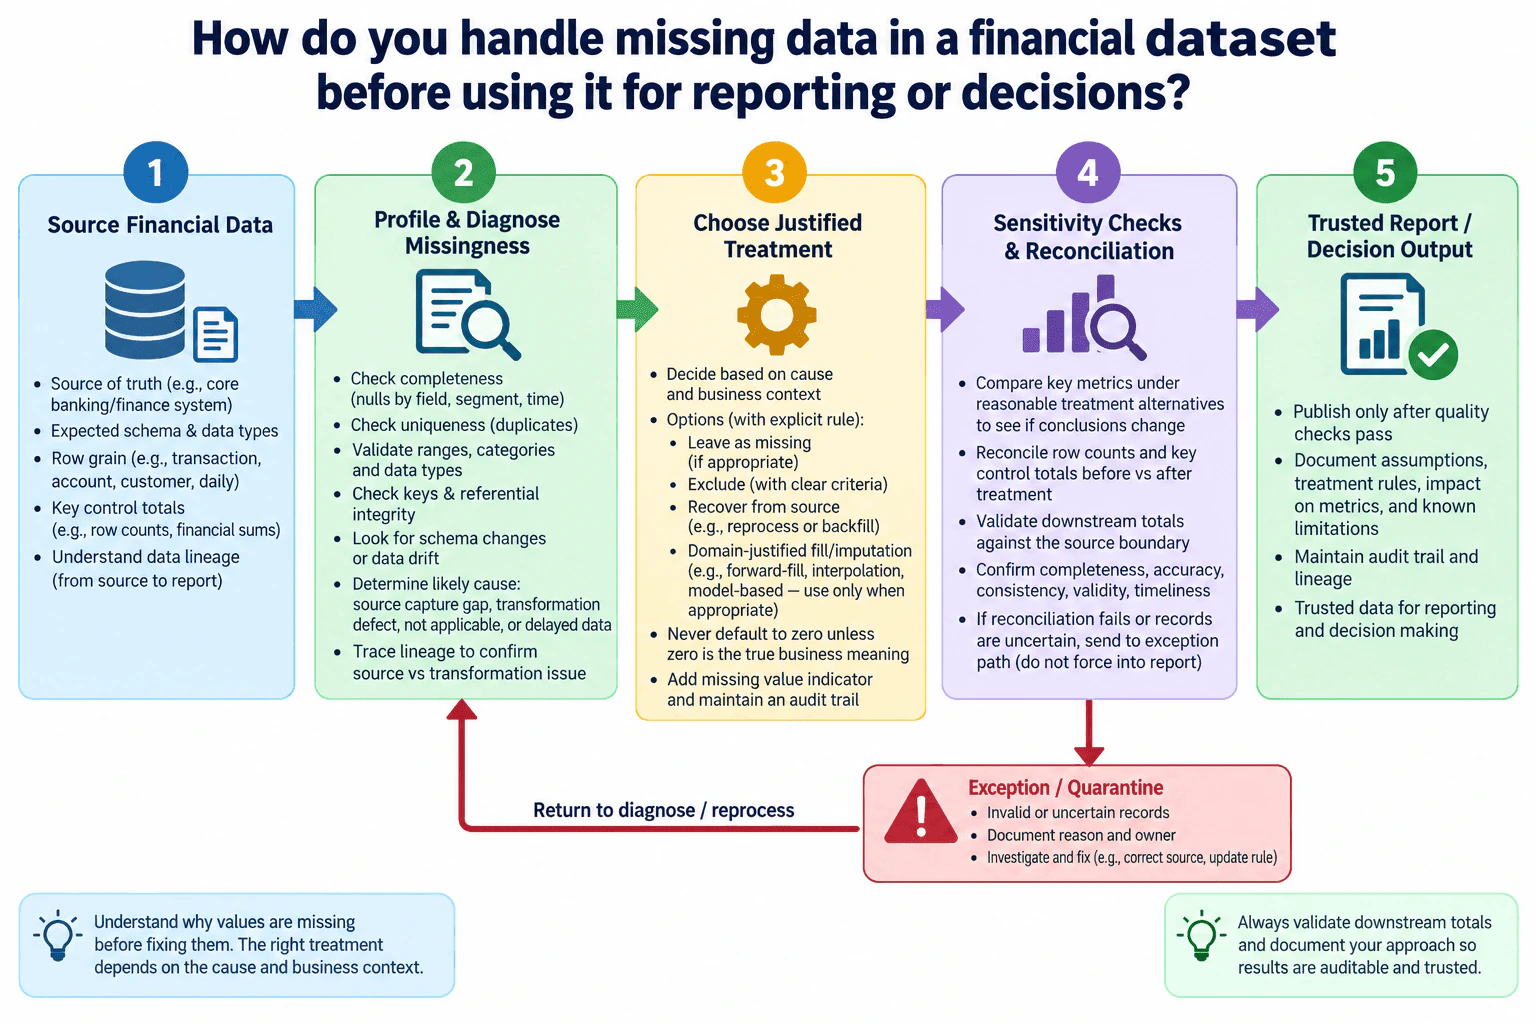
5. How do you handle missing data in a financial dataset before using it for reporting or decisions?Data Quality And ValidationMediumBank Of America

Question Details

Discuss profiling, why the values may be missing, treatment options, sensitivity checks, documentation, and validation of downstream totals.

Short Interview Answer (30-60 seconds)

I first profile the dataset to understand where values are missing and whether the problem varies by field, segment, or time. Then I trace lineage to determine whether the cause is a source capture issue, transformation defect, not-applicable value, or delayed data. I choose a justified treatment such as leaving the value missing, excluding it under a defined rule, recovering it from the source, or using appropriate imputation. Before reporting, I run sensitivity checks, reconcile row counts and key financial control totals, quarantine unresolved exceptions, and document the assumptions, treatment rules, limitations, and audit trail.

Detailed Explanation

Missing financial data can change totals, ratios, trends, and business decisions, so I would not automatically delete rows or replace blanks with zero. I would first understand the dataset's expected schema, row grain, source of truth, and which fields are required. Then I would profile where values are missing, investigate why they are missing, and choose a treatment that matches the cause and business meaning. Finally, I would test whether that treatment changes important conclusions, reconcile downstream counts and financial totals to the source, quarantine unresolved exceptions, and document every assumption and rule.

Useful Questions to Ask the Interviewer
  1. What is the expected row grain, such as transaction, account, customer, or reporting period?
  2. Which fields are required for the report or decision, and which fields may legitimately be not applicable?
  3. What system is the source of truth, and what source counts or financial control totals are available for reconciliation?
  4. Is there a documented business rule for late-arriving, optional, corrected, or backfilled values?
  5. Which downstream metrics or decisions are most sensitive to the missing fields?
  6. Is there an owner who can confirm whether the missingness is a source issue, transformation defect, or valid business condition?
How do you handle missing data in a financial dataset before using it for reporting or decisions? diagram
How to Explain It in an Interview

I would use a source-to-report validation plan.

First, I establish the data contract. I confirm the expected schema, row grain, relevant units and reporting period, source of truth, key fields, and the reconciliation boundary. This matters because a null may mean very different things depending on whether one row represents a transaction, an account, a customer, or a reporting snapshot.

Next, I profile the data. I measure completeness by checking nulls by field and, when relevant, by segment and time. I also check uniqueness through duplicate detection, validity through range and category checks, referential integrity for related keys, and consistency through expected data types and schema checks. I look for schema drift or other data drift because a changed field, unexpected category, or altered upstream behavior can create apparent missingness downstream. These checks support the broader data-quality dimensions: completeness means required data is present; accuracy means values correctly represent the source or business event; consistency means representations agree across relevant systems or transformations; validity means values satisfy defined formats, ranges, and categories; uniqueness means records expected to be unique are not duplicated; and timeliness means the data is available when the report or decision requires it.

Then I diagnose why the values are missing before changing anything. I trace data lineage from the report back through transformations to the source. Possible causes include a source capture gap, a transformation or mapping defect, a value that is genuinely not applicable, or late-arriving data. This distinction is important because each cause leads to a different treatment. If the source contains the value but the transformed dataset does not, I treat that as a pipeline or transformation defect rather than a statistical missing-data problem.

After I understand the cause, I choose an explicit, auditable treatment. I may leave a value missing when that is the correct representation; exclude records only under a clear rule when the analysis permits it; recover values from the authoritative source by reprocessing or backfilling; or use domain-justified imputation such as a defensible forward fill, interpolation, or model-based method when the data structure and business meaning support it. I do not replace a missing financial value with zero unless zero is genuinely the correct business meaning. When useful, I retain a missing-value indicator so downstream users can distinguish observed from treated records.

I also consider the bias introduced by the treatment. Dropping records can change the population being reported. Imputation can make data look more certain than it really is. Forward filling can be inappropriate when values can change materially between observations. Interpolation may be unsuitable when the underlying process is not reasonably smooth. Model-based imputation can add complexity and assumptions that are difficult to explain or govern. The appropriate choice therefore depends on the cause of missingness, the field's meaning, the decision being supported, and the amount of uncertainty the treatment introduces.

Before publishing, I perform sensitivity checks. I compare important metrics under reasonable treatment alternatives to see whether conclusions change. For example, I may compare the selected treatment with leaving eligible values missing or with another defensible treatment. I do not invent a universal numerical threshold for acceptability. If reasonable treatments produce materially different conclusions, I report that uncertainty instead of presenting one result as certain.

I then perform reconciliation controls. I compare row counts before and after transformations and treatment so every expected increase, decrease, exclusion, or quarantine action is explainable. I reconcile key financial control totals across the defined source-to-report boundary using the same population, grain, filters, reporting period, currency, and aggregation logic. I also confirm that required keys and referential relationships still hold. A matching total alone is not enough because offsetting errors can hide record-level problems, so reconciliation is used together with profiling and lineage checks.

If records remain invalid or uncertain, I do not force them into the trusted report. I send them to an exception or quarantine path, record the reason and owner, and investigate whether the source data or transformation rule needs correction. After correction or reprocessing, those records return through the profiling, validation, and reconciliation flow before they can reach the trusted output. This is a safe-failure approach: questionable records remain visible and recoverable without silently contaminating decision data.

Finally, I document the assumptions, treatment rule for each affected field, known limitations, downstream metric impact, reconciliation evidence, lineage, exceptions, and ownership. That audit trail makes the result reproducible and allows a later reviewer to understand what was changed and why. For prevention, I would turn the validated checks into repeatable quality rules and alerts where appropriate, add regression checks for future pipeline changes, and retain recovery evidence showing that corrected or reprocessed data passed the same source-to-report controls before publication.

Technical Approach

Validation Plan:

  1. Confirm the expected schema, row grain, source of truth, reporting boundary, required fields, units, filters, and reporting period.
  2. Profile nulls by field and, when relevant, by segment and time; also check duplicates, ranges, categories, data types, keys, referential integrity, and schema or data drift.
  3. Trace lineage to classify each important missing-data issue as a source capture gap, transformation defect, not-applicable value, late-arriving data, or another supported cause.
  4. Choose an explicit treatment based on that cause: leave missing, exclude under a documented criterion, recover from the source, or apply justified imputation; never default to zero unless zero is the true business meaning.
  5. Preserve a missing-value indicator or other audit evidence when treated records need to remain distinguishable.
  6. Run sensitivity checks using reasonable alternative treatments and evaluate whether important conclusions change.
  7. Reconcile row counts and key control totals before and after treatment against the defined source boundary using consistent grain, filters, units, currency, reporting period, and aggregation.
  8. Revalidate completeness, accuracy, consistency, validity, uniqueness, timeliness, keys, and referential integrity where relevant.
  9. Quarantine unresolved or invalid records with a reason and owner rather than forcing them into the report.
  10. Reprocess corrected records through the same validation flow.
  11. Publish only after quality checks pass, documenting assumptions, treatment rules, known limits, impact, lineage, exception handling, and audit evidence.
  12. Convert recurring checks into quality rules, alerts, regression tests, and recovery procedures.
Practical Insights

Quality Risks: The main cost is usually not computational complexity but investigation and governance effort. Profiling and reconciliation require scanning the relevant data, while lineage tracing and source recovery may require coordination with upstream owners. Simple treatments are easier to explain and maintain, but they can introduce bias if their assumptions are wrong. More sophisticated imputation may preserve more records, but it adds assumptions, validation work, and governance burden. In financial reporting, I would favor the simplest treatment that is justified by the data's business meaning and that can be reconciled, documented, and reproduced.

Why Interviewers Ask This

The interviewer wants to see whether I treat missing financial data as a data-quality and decision-risk problem rather than automatically deleting rows or filling nulls. A strong answer shows that I can profile the data, investigate why values are missing, choose an auditable treatment based on business meaning, test whether the treatment changes conclusions, reconcile downstream totals to the source, and document limitations before information reaches decision makers.

Common interview mistakes

Common mistakes are replacing every null with zero; deleting rows without checking whether that changes the reporting population; imputing before understanding why values are missing; treating a transformation defect as if it were a legitimate missing observation; checking only the null percentage and ignoring duplicates, ranges, categories, keys, or schema changes; reconciling totals at a different grain, period, filter, currency, or population than the report; assuming matching aggregate totals prove record-level correctness; failing to test whether different treatments change the conclusion; silently including uncertain records in the report; and failing to document assumptions, limitations, lineage, ownership, and treatment rules.

Interview tip

Use the diagram's flow when answering: source financial data, profile and diagnose missingness, choose a justified treatment, run sensitivity checks and reconciliation, route unresolved records to exception or quarantine and back for diagnosis or reprocessing, then publish only trusted, documented output. Emphasize that you never silently drop, overwrite, impute, or set values to zero without a defensible business rule.

Interviewer may ask next
What would you do if the source system also has the value missing, so there is nothing to recover through lineage?

I would first determine whether the field is required, optional, not applicable, late arriving, or genuinely unavailable. If the value is legitimately absent, I would preserve that state rather than invent information. If the report requires a value, I would evaluate a defensible treatment based on the field's meaning and data structure, document its assumptions, and keep an indicator showing that the value was treated rather than observed. I would then compare important metrics under reasonable alternatives. If the result is sensitive to the treatment, I would communicate that limitation and avoid making a stronger decision claim than the evidence supports.

What if two reasonable missing-data treatments produce different financial conclusions?

I would treat that disagreement as decision-relevant uncertainty, not choose the treatment that gives the preferred result. I would verify that both treatments use the same population, grain, filters, reporting period, units, currency, and source boundary, then compare their assumptions and business justification. I would show how the important metrics or conclusions differ, document why the selected method is preferable if one is better supported, and disclose the sensitivity. If neither treatment is sufficiently defensible for the intended decision, I would quarantine or defer the affected output until better source data, a confirmed business rule, or additional validation is available.

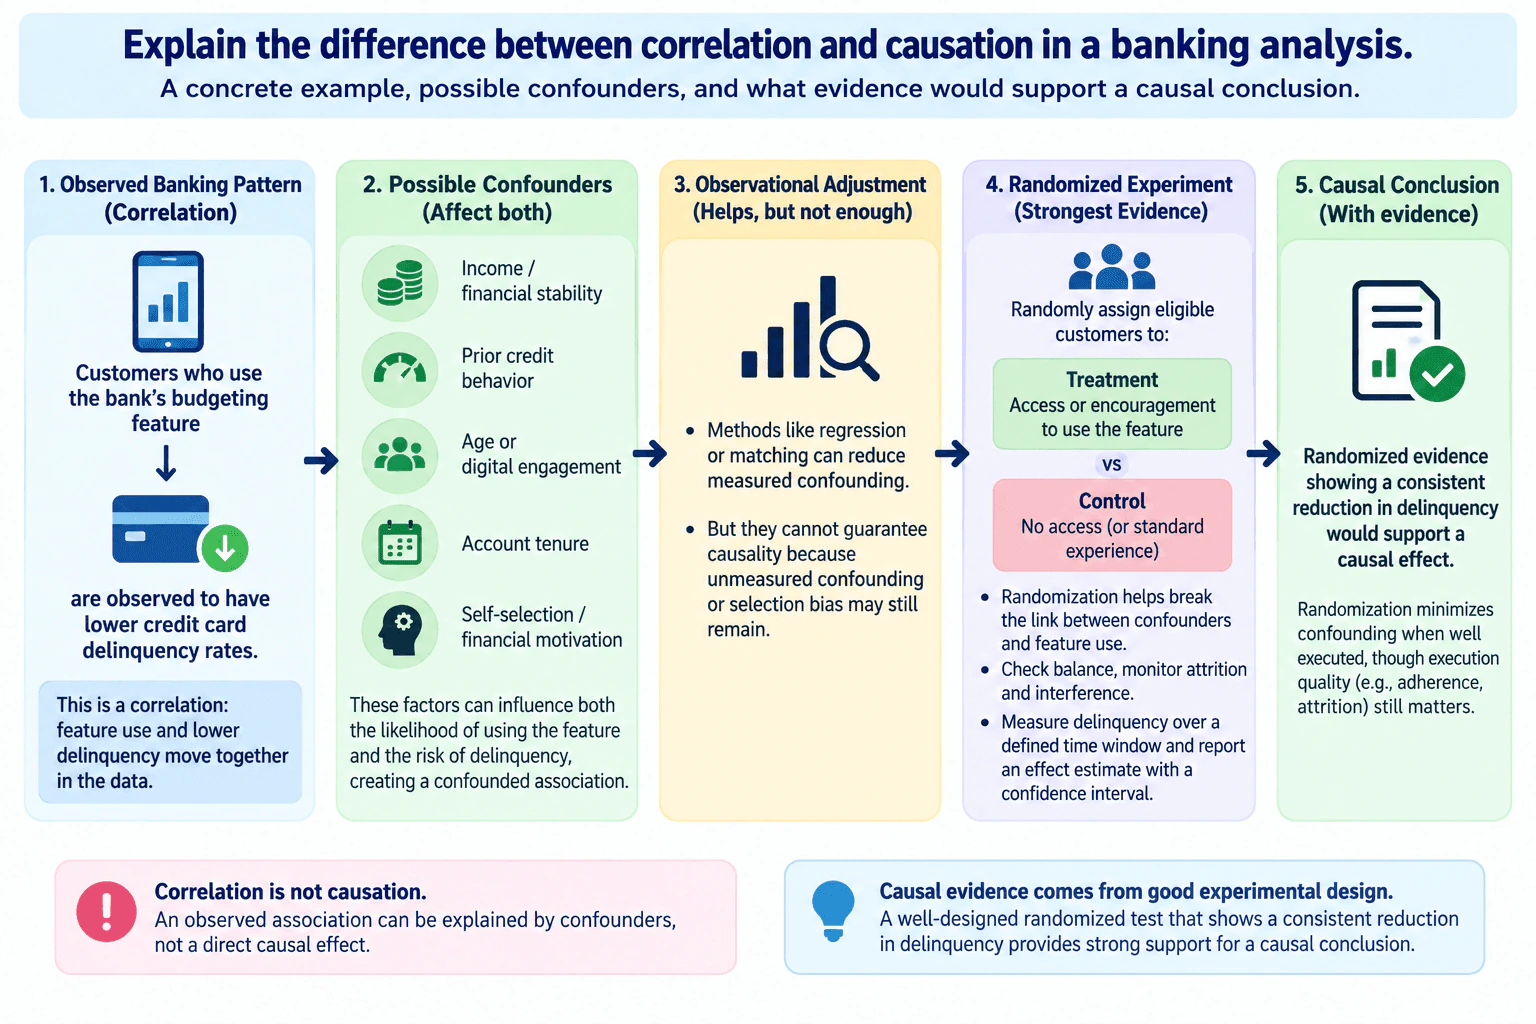
6. Explain the difference between correlation and causation in a banking analysis.Statistics And ExperimentationEasyBank Of America

Question Details

Give a concrete example, identify possible confounders, and explain what evidence would support a causal conclusion.

Short Interview Answer (30-60 seconds)

Correlation means two variables are associated, but it does not prove that one causes the other. For example, customers who use a bank's budgeting feature may be observed to have lower credit-card delinquency. That relationship could reflect the feature, but it could also be explained by income or financial stability, prior credit behavior, age or digital engagement, account tenure, or self-selection and financial motivation. Regression or matching can reduce measured confounding, but unmeasured confounding may remain. Stronger causal evidence would come from randomly assigning eligible customers to a clearly defined feature intervention versus a control experience and comparing delinquency over a defined time window, while reporting the effect estimate and confidence interval.

Detailed Explanation

Correlation and causation answer different questions. Correlation tells us that two things move together in observed data. Causation asks whether changing one thing would actually change the other. In this banking example, customers who use a budgeting feature may be observed to have lower credit-card delinquency, but that does not prove the feature caused the difference. Other customer characteristics may affect both feature use and delinquency. Stronger causal evidence requires a design that separates the feature intervention from those alternative explanations, ideally through random assignment, a control group, a defined outcome window, and an effect estimate with uncertainty.

Useful Questions to Ask the Interviewer
  1. Are we only describing the observed association, or do we need to estimate a causal effect?
  2. What is the population of eligible customers and the unit of randomization?
  3. Is the treatment feature access, an encouragement to use the feature, or another clearly defined intervention?
  4. What exactly counts as credit-card delinquency, and over what follow-up period should it be measured?
  5. Which baseline variables are available, such as income or financial stability, prior credit behavior, age, digital engagement, account tenure, and prior feature engagement?
  6. Can customers be randomly assigned, and should we expect attrition, noncompliance, or interference between treatment and control customers?
Explain the difference between correlation and causation in a banking analysis. diagram
How to Explain It in an Interview

Start with the observed banking pattern. Suppose customers who use the bank's budgeting feature are observed to have lower credit-card delinquency rates. That is correlation: feature use and lower delinquency occur together in the data. It is evidence of an association, but it is not enough to conclude that the budgeting feature caused the reduction.

The main reason is confounding. A confounder is a factor related to both the exposure and the outcome. In this example, plausible confounders include income or financial stability, prior credit behavior, age or digital engagement, account tenure, and self-selection or financial motivation. For example, financially motivated customers may be more likely to use the budgeting feature and may also be less likely to become delinquent even if the feature itself has no effect. That can create a misleading association.

With observational data, methods such as regression or matching can reduce differences in measured confounders. I would compare otherwise similar customers and adjust for relevant baseline characteristics. However, these methods do not automatically establish causality because an important variable may be unmeasured or measured poorly, and selection bias may remain. The safe conclusion from that design is still an adjusted association, not proof that the feature caused lower delinquency.

For stronger causal evidence, I would run a randomized experiment if it is feasible and appropriate. Eligible customers would be randomly assigned to one clearly defined treatment and a control experience. For example, the treatment could be access to the budgeting feature, while the control receives the standard experience without that access. If the intervention is instead an encouragement to use a feature that customers can already access, then the randomized intervention is the encouragement, and the primary causal estimate should describe the effect of assignment to that encouragement.

Randomization is valuable because treatment assignment is independent of baseline confounders in expectation. Before interpreting the outcome, I would check that randomization was implemented correctly, inspect baseline balance, confirm that the sample size and statistical power are adequate for the planned effect size, and monitor attrition, noncompliance, interference, missing outcomes, and other execution problems.

The outcome should be measured over a predefined time window. I would estimate the difference in delinquency between treatment and control and report an effect estimate with a confidence interval. The confidence interval communicates the uncertainty around the estimated effect. It should not be replaced by a p value or treated as a guarantee about the true effect.

A hypothesis test can support the analysis when appropriate. The null hypothesis would be that the randomized intervention produces no difference in the defined delinquency outcome for the target population over the selected time window. The alternative hypothesis would be that the intervention changes that outcome. I would interpret the effect estimate and confidence interval first, with any p value used only as supporting evidence rather than as the size of the effect.

Statistical significance and practical significance are different. An effect can be statistically distinguishable from zero but still be too small to matter to the business or customers. Conversely, a potentially meaningful effect with a wide confidence interval may indicate that the study is too imprecise to support a confident decision. The decision should therefore consider effect size, uncertainty, operational cost, customer impact, and risk.

The final conclusion must match the study design. From observational data, I would say that budgeting-feature use is associated with lower delinquency after accounting for measured factors, while acknowledging possible unmeasured confounding. From a well-executed randomized experiment, a consistent reduction in delinquency in the treatment group would provide much stronger evidence that the randomized intervention caused the difference for the studied population and time period. If treatment was only an encouragement, I would not automatically claim that actual feature use itself caused the result without additional assumptions or an appropriate causal method.

Technical Approach
  1. Define the target population, exposure or treatment, control condition, delinquency outcome, unit of observation or randomization, and analysis window.
  2. Describe the observed association between budgeting-feature use and delinquency without calling it causal.
  3. Identify plausible confounders such as income or financial stability, prior credit behavior, age or digital engagement, account tenure, and self-selection or financial motivation.
  4. If only observational data are available, use regression, matching, or another justified adjustment method to reduce measured confounding while acknowledging that unmeasured confounding may remain.
  5. For stronger causal evidence, randomly assign eligible customers to one clearly defined intervention and an appropriate control condition when feasible.
  6. Check randomization, baseline balance, sample size, statistical power, attrition, noncompliance, interference, and outcome measurement before interpreting results.
  7. Measure delinquency over the predefined window and estimate the treatment-control effect.
  8. Report uncertainty with a confidence interval and distinguish the effect estimate from any p value.
  9. Separate statistical significance from practical significance.
  10. State a conclusion no stronger than the design supports and limit it to the studied population, intervention, and time window.
Practical Insights

The main tradeoff is study quality rather than algorithmic runtime. Observational regression or matching can often be performed using existing data and may be faster and less expensive, but the result depends on which confounders were measured and how well they were modeled. A randomized experiment usually requires more planning, enough eligible customers for adequate power, reliable assignment, a defined follow-up period, and monitoring for attrition, noncompliance, or interference. In return, randomization provides much stronger protection against confounding and therefore stronger evidence for a causal conclusion.

Why Interviewers Ask This

This tests whether the candidate can distinguish an observed association from a defensible causal conclusion, identify confounding and selection bias, understand the limits of regression or matching, design an appropriate randomized experiment, and communicate uncertainty without making a claim stronger than the evidence supports.

Common interview mistakes

Common mistakes include saying correlation proves causation; ignoring confounders such as financial stability, prior credit behavior, digital engagement, account tenure, or self-selection; treating regression or matching as if they eliminate all bias; failing to define the treatment and outcome precisely; skipping checks for randomization, sample size, statistical power, attrition, noncompliance, or interference; using a p value as if it were the effect size; ignoring the confidence interval and practical significance; confusing assignment to an encouragement with actual feature use; and making a causal claim broader than the studied intervention, population, or time window.

Interview tip

Explain the answer in three steps: first describe the observed correlation, then name realistic confounders, and finally explain what stronger causal evidence would require. Use the budgeting-feature and delinquency example throughout. Mention regression or matching as useful but limited observational adjustments, then finish with random assignment, treatment versus control, a defined outcome window, and an effect estimate with a confidence interval. Keep the final claim exactly as strong as the design allows.

Interviewer may ask next
If randomization is not possible, how would you strengthen the analysis without claiming that causality is proven?

I would define the causal question first and identify plausible confounders using domain knowledge. Then I could use regression adjustment, matching, stratification, weighting, or a credible quasi-experimental design if the setting supports one. I would examine overlap between comparison groups, covariate balance, missing data, model sensitivity, and whether the result changes under reasonable alternative specifications. These methods can make an observational analysis more credible, but they do not automatically remove unmeasured confounding or selection bias, so I would keep the conclusion appropriately limited unless the additional causal assumptions are well justified.

What changes if customers are randomized to an encouragement to use the budgeting feature but some customers ignore it?

The cleanest primary estimate is the intention-to-treat effect: the effect of being assigned to the encouragement, regardless of whether the customer actually uses the feature. That comparison retains the protection created by randomization. Comparing actual users with nonusers would reintroduce self-selection because usage is no longer randomized. If the goal is to estimate the causal effect of actual feature use, an instrumental-variable approach may be possible using randomized encouragement as the instrument, but that requires additional assumptions such as a meaningful effect of encouragement on feature use and no direct effect of the encouragement on delinquency except through feature use.

7. Write a SQL query to find the top 10 customers by transaction volume.Sql And DatabasesMediumBank Of America

Question Details

State the assumed customer and transaction grain, define whether volume means count or dollar amount, handle ties, and explain how you would validate the result.

Short Interview Answer (30-60 seconds)

I would define transaction volume as total settled dollar amount. Assuming PostgreSQL and one row per transaction, I would filter to settled transactions, group by customer_id, calculate SUM(amount), and rank those customer totals with RANK() in descending order. Then I would keep ranks 1 through 10. I would use RANK() because equal transaction volumes should receive the same rank, so a tie at rank 10 may return more than 10 rows. I would validate control totals, customer-level grain, the rank cutoff, and several customer totals against the raw transactions.

Detailed Explanation

See the Code while reading this explanation.

The task is to rank customers by transaction volume, so I would define the metric and row grain first. I will assume PostgreSQL, one row per transaction in transactions, transaction_id as the primary key, and customer_id as the customer identifier. I will define volume as the total dollar amount of settled transactions. The query filters settled rows, sums amount for each customer, ranks the customer totals from highest to lowest, and keeps the top 10 ranks. Because RANK() preserves equal values, a tie at rank 10 can return more than 10 customer rows.

Useful Questions to Ask the Interviewer
  1. Does transaction volume mean transaction count or total dollar amount?
  2. Should only settled transactions be included, or should other statuses count?
  3. Is there a reporting date range, and what time zone and date boundaries should apply?
  4. Should all customers tied at rank 10 be returned, even if that produces more than 10 rows?
  5. Can amount be NULL for settled transactions, and what business rule should apply if it is?
Write a SQL query to find the top 10 customers by transaction volume. diagram
How to Explain It in an Interview

Start with the grain. The input grain is one row per transaction, with transaction_id assumed to be unique. The customer identifier is customer_id, and the output grain is one row per customer before the final rank filter. Defining grain first prevents accidental double counting.

Next define the metric. In this solution, transaction volume means total settled dollar amount, not transaction count. Therefore the relevant aggregate is SUM(amount), and the source population is restricted to rows where status = 'settled'. If the interviewer instead means transaction count, I would replace the amount sum with a count of unique transaction rows and keep the same ranking pattern.

The first CTE, customer_volume, performs the aggregation. It groups the transaction rows by customer_id and calculates one transaction_volume value per customer. No customer-table join is required for the result shown in the diagram because only customer_id, transaction volume, and rank are needed. Avoiding an unnecessary one-to-many join also avoids introducing row multiplication.

The second CTE, ranked, applies RANK() after the aggregation. The window orders customer-level transaction_volume values from highest to lowest. Customers with equal transaction volume receive the same rank. Filtering with volume_rank <= 10 therefore returns the top 10 ranks, not necessarily exactly 10 rows. If multiple customers tie at the 10th rank, all of them are returned. This is intentional tie handling and matches the diagram.

The final ORDER BY transaction_volume DESC, customer_id controls presentation. transaction_volume DESC keeps the largest volumes first, while customer_id provides a deterministic display order among customers that have the same volume. The secondary ordering does not change the RANK() values because ranking is based only on transaction_volume.

NULL behavior should be explicit. PostgreSQL SUM(amount) ignores NULL input values. The diagram assumes amount is non-NULL for settled transactions. If that assumption is not guaranteed, I would confirm the business rule rather than silently replacing NULL with zero, because a missing amount and a real zero-dollar transaction can mean different things.

No date condition is shown because the question and approved diagram do not specify a reporting period. In a production query, I would ask whether the ranking covers all history, a calendar interval, or a rolling period. If a date filter is required, I would also confirm the time zone and whether the start and end boundaries are inclusive or exclusive before adding it.

Validation is part of the answer. First, reconcile the control total: the sum of transaction_volume across all grouped customers should equal SUM(amount) over the same settled transaction population. Second, verify there is only one grouped row per customer_id. Third, inspect ranks around 9, 10, and 11 to confirm ties are included correctly. Fourth, manually spot-check several customers by summing their raw settled transactions and comparing those totals with the ranked result. These checks test both the aggregation and the ranking logic.

The key tradeoff is tie handling. RANK() preserves equal business values but can return more than 10 rows. If the requirement changes to exactly 10 rows, I would use ROW_NUMBER() with an agreed deterministic secondary tie-breaker. That satisfies the row-count constraint but changes the meaning because customers with equal volume no longer share the same rank.

Technical Approach

1. Assume PostgreSQL and confirm that transactions has one row per transaction with unique transaction_id. 2. Define transaction volume as total settled dollar amount. 3. Filter to status = 'settled'. 4. Group by customer_id and calculate SUM(amount) to produce one row per customer. 5. Apply RANK() over transaction_volume DESC so equal customer totals share a rank. 6. Keep rows where volume_rank <= 10, allowing more than 10 rows when customers tie at rank 10. 7. Order the displayed result by transaction_volume DESC, customer_id for deterministic presentation among ties. 8. Validate the control total, customer grain, rank boundary, and selected customer totals against raw transactions.

Time & Space Complexity

The database reads the qualifying transaction rows, groups them by customer, and then sorts the customer-level totals to assign ranks. The aggregation work grows with the number of qualifying transactions, while ranking depends on the number of customers produced by the aggregation. Reducing the data to one row per customer before ranking is both logically correct and easier to maintain. Any performance tuning should be based on the real table size, filters, indexes, and execution plan rather than assuming a particular index is always best.

Example

This PostgreSQL implementation matches the approved diagram. The first CTE aggregates settled transaction amounts to one row per customer. The second CTE assigns RANK() using the aggregated transaction volume. The final query keeps ranks through 10 and sorts equal-volume customers by customer_id only for deterministic display. Because RANK() preserves ties, the result can contain more than 10 rows when several customers share the 10th rank.

Code
WITH
  customer_volume AS (
    SELECT
      customer_id,
      SUM(amount) AS transaction_volume
    FROM
      transactions
    WHERE
      status = 'settled'
    GROUP BY
      customer_id
  ),
  ranked AS (
    SELECT
      customer_id,
      transaction_volume,
      RANK() OVER (
        ORDER BY
          transaction_volume DESC
      ) AS volume_rank
    FROM
      customer_volume
  )
SELECT
  customer_id,
  transaction_volume,
  volume_rank
FROM
  ranked
WHERE
  volume_rank <= 10
ORDER BY
  transaction_volume DESC,
  customer_id;
Where it is used

This SQL pattern is useful for top-spender reports, customer-value analysis, account prioritization, loyalty programs, sales rankings, and other reporting tasks where transaction-level data must first be aggregated to an entity-level metric and then ranked with explicit tie handling.

Why Interviewers Ask This

The interviewer is testing whether the candidate defines the metric and data grain before writing SQL, aggregates at the correct customer grain, chooses deliberate tie behavior, handles data-quality assumptions, and validates the ranked output instead of treating syntactically valid SQL as sufficient.

Common interview mistakes

Common mistakes include assuming that 'volume' means transaction count without clarifying it, ranking individual transactions instead of aggregated customer totals, using LIMIT 10 when ties must be preserved, adding unnecessary joins that can multiply transaction rows, silently converting NULL amounts to zero, failing to define which transaction statuses qualify, inventing an unstated date range, assuming top 10 ranks always means exactly 10 rows, and skipping reconciliation or spot checks.

Interview tip

State three things before showing the SQL: the input grain, the output grain, and the definition of transaction volume. Then explain why RANK() is used for ties and finish with concrete validation checks. That demonstrates data-modeling judgment as well as SQL syntax.

Interviewer may ask next
What would you change if transaction volume means number of transactions instead of total dollar amount?

I would keep the same customer-level grain and ranking structure but change the metric. Assuming transaction_id is the unique primary key, I would calculate COUNT(transaction_id) for settled transactions grouped by customer_id, then apply RANK() over that count in descending order and keep ranks through 10. For validation, the sum of the customer transaction counts should reconcile to the number of qualifying settled transaction rows rather than to the sum of amount.

What would you change if the business requires exactly 10 rows even when several customers tie at the cutoff?

I would first ask for the approved tie-break rule because exactly 10 rows requires breaking ties. I would replace RANK() with ROW_NUMBER() and order by transaction_volume DESC followed by an agreed deterministic secondary key such as customer_id. That produces exactly 10 rows when at least 10 customers exist, but equal-volume customers no longer share the same rank, so I would call out that business tradeoff explicitly.

8. How would you optimize a slow database query used for recurring bank reporting?NEWSql And DatabasesHardBank Of America

Question Details

Cover the execution plan, filters, indexes or clustering, join cardinality, partition pruning, unnecessary columns, pre-aggregation, and correctness checks after optimization.

Short Interview Answer (30-60 seconds)

I would start by baselining the query with its execution plan and looking for expensive scans, joins, sorts, and estimate problems. Then I would filter early, prune date partitions, and select only the columns the report needs. I would verify the one-to-many customer-to-transaction relationship so joins do not multiply rows, test a B-tree index such as (status, txn_date) plus a customer_id join index where appropriate, or clustering in a columnar warehouse. For recurring reports, I would consider pre-aggregation. Finally, I would rerun the plan and validate row counts, duplicates, totals, date boundaries, NULL handling, and reconciliation to a trusted source.

Detailed Explanation

See the Code while reading this explanation.

The goal is to make the recurring bank-reporting query faster without changing what the report means. I would first measure the current query and inspect how the database executes it. Next, I would reduce unnecessary work by filtering early, pruning date partitions, reading only needed columns, and confirming the join grain. Then I would test suitable indexes or clustering and consider pre-aggregating repeated metrics. The final step is essential: compare the optimized output with the original using row counts, duplicate checks, key totals, date boundaries, NULL behavior, and reconciliation to a trusted source.

Useful Questions to Ask the Interviewer
  1. Which database engine and version are we using, and is transactions partitioned by txn_date?
  2. What is the required report grain: transaction, customer-date, account, customer-month, or another level?
  3. Which filters are always present, especially the date range and status filter?
  4. Is dim_customer.customer_id an enforced primary key, and is each transaction expected to match at most one customer row?
  5. How fresh must the recurring report be, and can a summary table or materialized view be refreshed on a schedule?
  6. Which approved finance report or control totals should the optimized result reconcile to?
How would you optimize a slow database query used for recurring bank reporting? diagram
How to Explain It in an Interview

I would treat optimization as a measured loop rather than guessing.

  1. Establish the baseline and inspect the execution plan. The execution plan shows how the database reads, joins, sorts, and aggregates the data. The diagram starts with an EXPLAIN (ANALYZE, BUFFERS)-style plan containing a sequential scan on transactions, a hash join, and access to dim_customer. I would capture runtime, rows processed, major scan and join operators, sorts, and differences between estimated and actual rows. A sequential scan is not automatically wrong, but it is worth investigating when the query is selective and scanning more data than necessary.
  1. Define the grain and join cardinality before changing the query. The diagram shows dim_customer at one row per customer_id and transactions at many rows per customer, so the relationship is one-to-many from customer to transactions. If customer_id is truly enforced as the dimension primary key, joining transactions to that dimension should match each transaction to at most one customer row. I would still confirm the required output grain and check post-join row counts so an unexpected relationship or bad data does not inflate report totals.
  1. Reduce the amount of data processed. The example applies a half-open date range and status = 'POSTED', while selecting only account_id, txn_date, and amount. A predicate such as txn_date >= start_date AND txn_date < end_date makes the end boundary explicit and avoids ambiguous end-of-day timestamp logic. If the table is partitioned by txn_date, a compatible date predicate can enable partition pruning so irrelevant partitions are skipped.

I would also avoid SELECT *. Retrieving only required columns reduces unnecessary I/O, memory use, and data movement, especially for wide tables and columnar systems.

  1. Test indexes or clustering based on the actual predicate pattern. For the filter shown in the diagram, (status, txn_date) is a reasonable candidate B-tree index because status has an equality condition followed by a date range condition. I would confirm its value with the execution plan instead of assuming the optimizer will use it. A separate index on customer_id can support the transaction-side join when that access path benefits the real workload.

Indexes consume storage and add write and maintenance cost. In a columnar warehouse, conventional row-store indexes may not be the relevant mechanism, so I would instead consider clustering or ordering on frequently filtered date columns and verify that it improves pruning enough to justify its maintenance cost.

  1. Pre-aggregate recurring metrics when the reporting grain is stable. The diagram shows a daily_customer_summary materialized-view example that groups posted transactions by customer_id and txn_date and calculates deposit and withdrawal totals with SUM(CASE ...). This can avoid repeatedly scanning raw transactions for the same recurring report.

The aggregation grain must exactly match the reporting requirement. If txn_date is a DATE, grouping directly by it gives a customer-date grain. If it is a timestamp, I would first convert it to the intended reporting date using the correct business time zone and database-specific date expression. The example also assumes the transaction source contains the type field used by the deposit and withdrawal expressions, as shown in the diagram's SQL example.

A summary or materialized view trades fresh raw-data access for faster repeated reads. It can be refreshed on a schedule, while incremental-refresh capability is engine-specific and should be confirmed before relying on it.

  1. Preserve NULL and date-boundary semantics. Optimization must not silently change business rules. I would document how NULL values in status, type, amount, join keys, and dates should behave. SQL comparisons with NULL do not evaluate to TRUE, so rows with NULL filter values can be excluded unless handled explicitly. For the shown CASE expressions, I would confirm whether a matching transaction with a NULL amount should remain unknown, be treated as zero, or be rejected by data-quality rules. The chosen behavior must match the approved report definition.
  1. Validate correctness after every optimization. A faster query is not successful if its result changes. I would compare row counts before and after optimization, validate key aggregates such as total deposits and withdrawals, check for duplicate rows after joins, test date-boundary and NULL cases, and reconcile the final output to the trusted finance report or other approved control source shown in the workflow.
  1. Rerun the plan and iterate. After each material change, I would rerun the execution plan and compare the new performance with the baseline while repeating the correctness checks. I would keep an optimization only when it reduces work or runtime enough to justify its storage, maintenance, refresh, or governance cost. The desired outcome is the same trusted result with lower cost, faster execution, and a design that continues to scale as the data grows.
Technical Approach
  1. Capture the baseline execution plan, runtime, scan operators, join operators, sorts, and estimated-versus-actual rows.
  2. Define the required output grain and confirm the one-customer-to-many-transactions relationship.
  3. Apply selective status and half-open date filters as early as possible.
  4. Use partition pruning on txn_date when the table is partitioned compatibly.
  5. Select only the columns the report needs and avoid SELECT *.
  6. Test a candidate B-tree index on (status, txn_date) and a transaction-side join index on customer_id where the database and workload justify them; for a columnar warehouse, test clustering or ordering on frequently filtered date columns.
  7. Pre-aggregate repeated metrics at the exact reporting grain when freshness requirements allow it.
  8. Rerun the execution plan after each important change.
  9. Validate row counts, duplicate behavior, key aggregates, NULL semantics, date boundaries, and reconciliation to a trusted source.
  10. Retain only optimizations whose measured benefit justifies their storage and maintenance cost.
Time & Space Complexity

There is no single fixed complexity improvement because performance depends on the database engine, table size, data distribution, filter selectivity, statistics, partitioning, and physical design. The practical objective is to scan, join, and aggregate less data. Partition pruning can skip irrelevant partitions; selective predicates and useful indexes can reduce the data searched; selecting fewer columns reduces data movement; and pre-aggregation can replace repeated raw-detail scans with smaller summary reads. The tradeoffs are extra index or clustering maintenance, additional storage, refresh work, and possible summary-data staleness.

Example

The implementation below follows the PostgreSQL-style syntax shown in the diagram. It first inspects the existing report query with EXPLAIN (ANALYZE, BUFFERS), using the customer primary-key relationship shown in the plan. It then shows candidate indexes that should be retained only if the measured workload benefits from them. Finally, it creates the diagram's optional customer-date materialized summary for recurring reporting. This example assumes txn_date is already a DATE at the required reporting grain and that the source contains the type field used by the diagram's deposit and withdrawal logic. If those assumptions are false, the date-grain or field logic must be adjusted before deployment.

Code
EXPLAIN (ANALYZE, BUFFERS)
SELECT
  t.account_id,
  t.txn_date,
  t.amount
FROM
  transactions AS t
  JOIN dim_customer AS c ON c.customer_id = t.customer_id
WHERE
  t.txn_date >= DATE '2024-01-01'
  AND t.txn_date < DATE '2024-02-01'
  AND t.status = 'POSTED';


-- Candidate access paths: keep them only if the measured plan benefits.
CREATE INDEX idx_transactions_status_txn_date ON transactions (status, txn_date);


CREATE INDEX idx_transactions_customer_id ON transactions (customer_id);


-- Optional recurring-report summary at customer-date grain.
CREATE MATERIALIZED VIEW daily_customer_summary AS
SELECT
  customer_id,
  txn_date,
  SUM(
    CASE
      WHEN type = 'DEP' THEN amount
      ELSE 0
    END
  ) AS total_deposits,
  SUM(
    CASE
      WHEN type = 'WD' THEN amount
      ELSE 0
    END
  ) AS total_withdrawals
FROM
  transactions
WHERE
  status = 'POSTED'
GROUP BY
  customer_id,
  txn_date;


-- Refresh on the schedule required by the reporting process.
REFRESH MATERIALIZED VIEW daily_customer_summary;
Where it is used

This approach is useful for recurring finance, regulatory, risk, reconciliation, operations, and management reports where large transaction tables are repeatedly filtered, joined, and aggregated and the output must remain auditable and consistent with trusted control totals.

Why Interviewers Ask This

This tests whether the candidate can improve SQL performance without changing the business result. The interviewer is evaluating disciplined execution-plan analysis, data-grain reasoning, selective filtering, appropriate indexing or clustering, partition pruning, column reduction, sensible pre-aggregation, and a validation process that clearly separates performance improvements from correctness.

Common interview mistakes

Adding indexes before reading the execution plan; assuming every sequential scan is bad; using SELECT *; writing ambiguous date boundaries; ignoring partition pruning; choosing index columns without considering equality and range predicates; treating a one-to-many relationship as if both sides had the same grain; failing to check duplicate multiplication after joins; pre-aggregating at the wrong grain; treating clustering as identical to a row-store index; promising incremental materialized-view refresh without checking the engine; changing NULL behavior during optimization; and measuring speed without reconciling the optimized result to trusted totals.

Interview tip

Present the answer as one loop: baseline the plan, reduce scanned data, confirm join grain, test indexes or clustering, pre-aggregate only when useful, validate the result, and rerun the plan. Explicitly state that performance is not a success unless the optimized query returns the same trusted result.

Interviewer may ask next
What would you do if the optimizer still chooses a sequential scan after you add the (status, txn_date) index?

I would not force the index immediately. I would compare estimated and actual rows, verify that statistics are current, measure how selective the status and date predicates are, and confirm that the query predicate matches the candidate index. If a large fraction of the relevant partition or table qualifies, a sequential scan may genuinely be cheaper. I would test representative reporting windows and keep the index only if it improves the real recurring workload enough to justify its storage and write-maintenance cost.

What changes if the report needs near-real-time data instead of a scheduled refresh?

The freshness requirement makes a periodically refreshed summary less attractive unless the database provides an appropriate continuously maintained or incremental mechanism. I would rely more heavily on partition pruning, selective filters, correct indexes or clustering, and possibly a separate summary pipeline with an explicit freshness guarantee. I would define the maximum acceptable reporting lag and continue reconciling the optimized output to the authoritative transaction source so the performance improvement does not weaken correctness.

9. Have you ever worked in a call center?BehavioralEasyBank Of America

Interview tip:

Use STAR to structure your answer: briefly explain the Situation and Task, make Action the most detailed part, and finish with the Result. For example, describe your experience working in a call center, the responsibilities you handled, how you communicated with customers and coworkers, how you managed priorities or difficult situations, and what you learned that would help you work effectively as a Data Analyst.

Situation

Yes. In my last role, I worked in a call center environment where I supported customers and handled a steady flow of requests. The work required clear communication, careful listening, accurate documentation, and the ability to stay calm when a customer had a problem.

Task

My responsibility was to understand each customer's issue, provide the right support, and document the interaction clearly. I also had to manage several priorities at once while following the required process and making sure important details were not missed.

Action

I started each conversation by listening carefully and asking simple questions to understand the main issue. I confirmed important details before taking action because an incorrect assumption could lead to the wrong solution. When a request was unclear or outside my responsibility, I explained what I knew, documented the details, and worked with the appropriate team instead of guessing. I also kept my notes clear so another person could understand what had already happened. When customers were frustrated, I focused on the facts, explained the next step in simple language, and made sure they understood what to expect. This experience taught me to separate the main problem from extra information and communicate findings in a way that helps someone make a decision.

Result

I became more confident working with different types of people, handling changing priorities, and communicating clearly under pressure. I also learned how important accurate information and good documentation are. Those skills are useful in Data Analyst work because analysts also need to understand business questions, check assumptions, explain findings clearly, and support decisions without creating confusion.

Why Interviewers Ask This

Interviewers ask this question to understand whether the candidate has experience in a customer focused and fast paced environment. A strong answer shows communication, patience, ownership, careful documentation, prioritization, and the ability to understand a person's real need before responding. These skills can transfer well to Data Analyst work with business partners and stakeholders.

Interviewer may ask next
What did you learn from working with difficult or frustrated customers?

I learned that listening first is usually more effective than reacting quickly. I tried to understand the actual issue, confirm the important facts, and explain the next step clearly. That approach helped me stay professional and taught me how to communicate calmly when someone has a different expectation or is under pressure.

How would your call center experience help you as a Data Analyst?

It taught me how to ask clear questions, identify the real problem, document information carefully, and explain something in simple language. As a Data Analyst, I would use the same habits when working with stakeholders. I would clarify the business question, check assumptions, keep my analysis organized, and explain the result in a way that supports the decision they need to make.

10. Describe a time you persuaded a team to adopt the conclusions from your analysis.BehavioralMediumBank Of America

Question Details

Use STAR and explain the disagreement, evidence, communication approach, decision, measured outcome, and what you learned.

Interview tip:

Use STAR to structure your answer: briefly explain the Situation and Task, make Action the most detailed part, and finish with the Result. For example, describe a project where your analysis challenged the team's original view, how you presented clear evidence, addressed concerns, connected your findings to the business decision, and helped the team agree on a better direction.

Situation

During a previous project, I was analyzing performance data to help a team decide where to focus its next improvement effort. The team initially believed one area was causing most of the problem because it had received the most attention from stakeholders. My analysis showed that a different part of the process was having a larger effect on the overall result.

Task

My responsibility was to explain the evidence clearly and help the team make a decision based on the data. I also needed to respect the team's existing knowledge because their original view came from real operational experience.

Action

I first checked my analysis again because I knew the conclusion was different from what the team expected. I reviewed the source data, confirmed the definitions being used, and tested whether the pattern remained when I looked at the data in different ways. Once I was confident in the conclusion, I did not simply present a large table and tell the team they were wrong. I organized the evidence around the decision they needed to make. I showed the original assumption first, then explained what the data showed, and finally compared the likely effect of focusing on each area. When team members raised concerns, I asked which assumptions they questioned and reviewed those points with them. One concern led me to clarify a business rule in the analysis, which made the final explanation stronger. I also used simple visuals and plain language so people could see why the conclusion mattered without needing to follow every technical detail. Instead of asking the team to accept my recommendation immediately, I suggested that we use the evidence to adjust our priority and watch the result closely.

Result

The team agreed to change its focus based on the analysis and used the findings to guide the next decision. The discussion also improved trust because the recommendation was supported by evidence and because I treated the disagreement as a problem to solve together rather than a debate to win. I learned that persuasion in analytics is not only about having the correct calculation. It is also about understanding the decision, listening to concerns, checking assumptions, and explaining the evidence in a way that helps people act.

Why Interviewers Ask This

Interviewers ask this question to understand whether a Data Analyst can influence decisions when the evidence challenges an existing opinion. A strong answer shows analytical confidence, careful validation, clear communication, respect for stakeholders, and the ability to turn data into practical decision support.

Interviewer may ask next
How did you handle the team's resistance to your conclusion?

I focused on understanding why they disagreed instead of trying to defend my conclusion immediately. I asked which assumptions or parts of the analysis concerned them, reviewed those points openly, and connected the evidence back to the decision they needed to make. That made the discussion more collaborative and helped the team evaluate the conclusion on its merits.

What would you do differently if you faced a similar situation now?

I would involve key stakeholders earlier while defining the measures and assumptions. The final analysis was still useful, but earlier agreement on definitions could have reduced some of the initial resistance. I would still validate the analysis carefully and present the evidence in simple terms tied directly to the business decision.

Disclaimer: This interview guide is for educational and informational purposes only. It is designed to help readers prepare, but it does not guarantee any interview result, hiring decision, offer, or outcome. Interview questions, hiring criteria, and preferred answers can vary by employer, interviewer, industry, location, and time. All answers, examples, and explanations in this guide are suggested examples for interview preparation, not definitive answers or instructions for professional practice. They are based on research and judgment, are provided without warranties of any kind, and should be adapted to the question, role, and applicable laws and professional requirements. Diagrams are simplified illustrations intended to highlight the main concepts and their relationships; actual situations, systems, and practices may be more complex. Alternative approaches may be equally valid or better suited to a particular question, context, or interviewer. To the fullest extent permitted by applicable law, the contributors and publisher are not liable for decisions made, actions taken, or losses incurred based on this guide.

State Laws and Professional Responsibilities: Laws and requirements governing an occupation vary by state and jurisdiction. You are responsible for checking the current laws, licensing requirements, and scope-of-practice rules that apply to your location and role, and for ensuring that your answers and actions comply with them. Adapt examples in this guide to those requirements. This guide is not legal advice.

Company Notice: This guide is an independent educational resource and is not affiliated with, endorsed by, sponsored by, or approved by the company named in this guide. Company names identify reported interview experiences or the employer context of clearly labeled original practice exercises. Interview practices can change without notice, and inclusion of company-specific content does not mean these questions are official, complete, or guaranteed to be asked. To the fullest extent permitted by law, the author, contributors, and publisher are not responsible for outcomes related to use of this material.

Content Accuracy and Verification: To the fullest extent permitted by applicable law, we do not represent or warrant that interview guides, questions, answers, examples, or diagrams are accurate, complete, current, error-free, or suitable for any particular purpose. You are responsible for independently reviewing and verifying the information before relying on it.