9 JPMorgan Chase Data Analyst Interview Questions & Answers

jpmorgan-chase icon

Questions with Detailed ExplanationsWith Detailed Explanations

(Last Updated: September 13, 2026)

1. A collateral dashboard changes overnight and shows fewer margin calls. What would you do in the first 60 minutes?Data Quality And ValidationMediumJpmorgan Chase

Question Details

Explain impact triage, SQL snapshots, lineage and job checks, recent-change review, publication controls, stakeholder communication, and evidence preservation.

Short Interview Answer (30-60 seconds)

In the first 60 minutes, I would follow five steps: Detect & Contain, Snapshot & Reconcile, Trace Cause, Decide & Communicate, and Preserve Evidence & Prevent Recurrence. I would first confirm the change, define the affected scope, and assess decision impact. If the data may be unreliable, I would pause or clearly flag publication. Then I would take reproducible SQL snapshots, compare row counts and control totals with the source and prior period, profile data quality, trace lineage, inspect overnight jobs and recent changes, communicate what is known and unknown, and preserve queries, logs, lineage, changes, findings, and recovery evidence in an audit trail.

Detailed Explanation

My goal in the first hour is not to explain the drop immediately. It is to decide whether the dashboard can be trusted, protect people from using unreliable information, and collect enough evidence to locate the cause. I would use the same five-step flow as the diagram: Detect & Contain, Snapshot & Reconcile, Trace Cause, Decide & Communicate, and Preserve Evidence & Prevent Recurrence. I would compare the changed margin-call result with prior-period and source data at the same grain, preserve reproducible snapshots, trace the metric through lineage, review overnight jobs and recent changes, and communicate what is known and unknown. If reliability is uncertain, I would hold or clearly flag publication until validation supports release.

Useful Questions to Ask the Interviewer
  1. What is the source of truth for margin calls, and what is the expected reporting grain—for example, by entity, portfolio, region, or another business key?
  2. What reporting time window, cutoff, and time zone should the dashboard represent, and is the prior-period comparison like-for-like?
  3. Are there established control totals, reconciliation rules, data-quality thresholds, or publication controls for this dashboard?
  4. Were any source feeds, transformation jobs, business rules, filters, mappings, schemas, or dashboard definitions changed recently?
  5. Which downstream users or decisions depend on this dashboard, and who owns the source, transformation, and reporting layers?
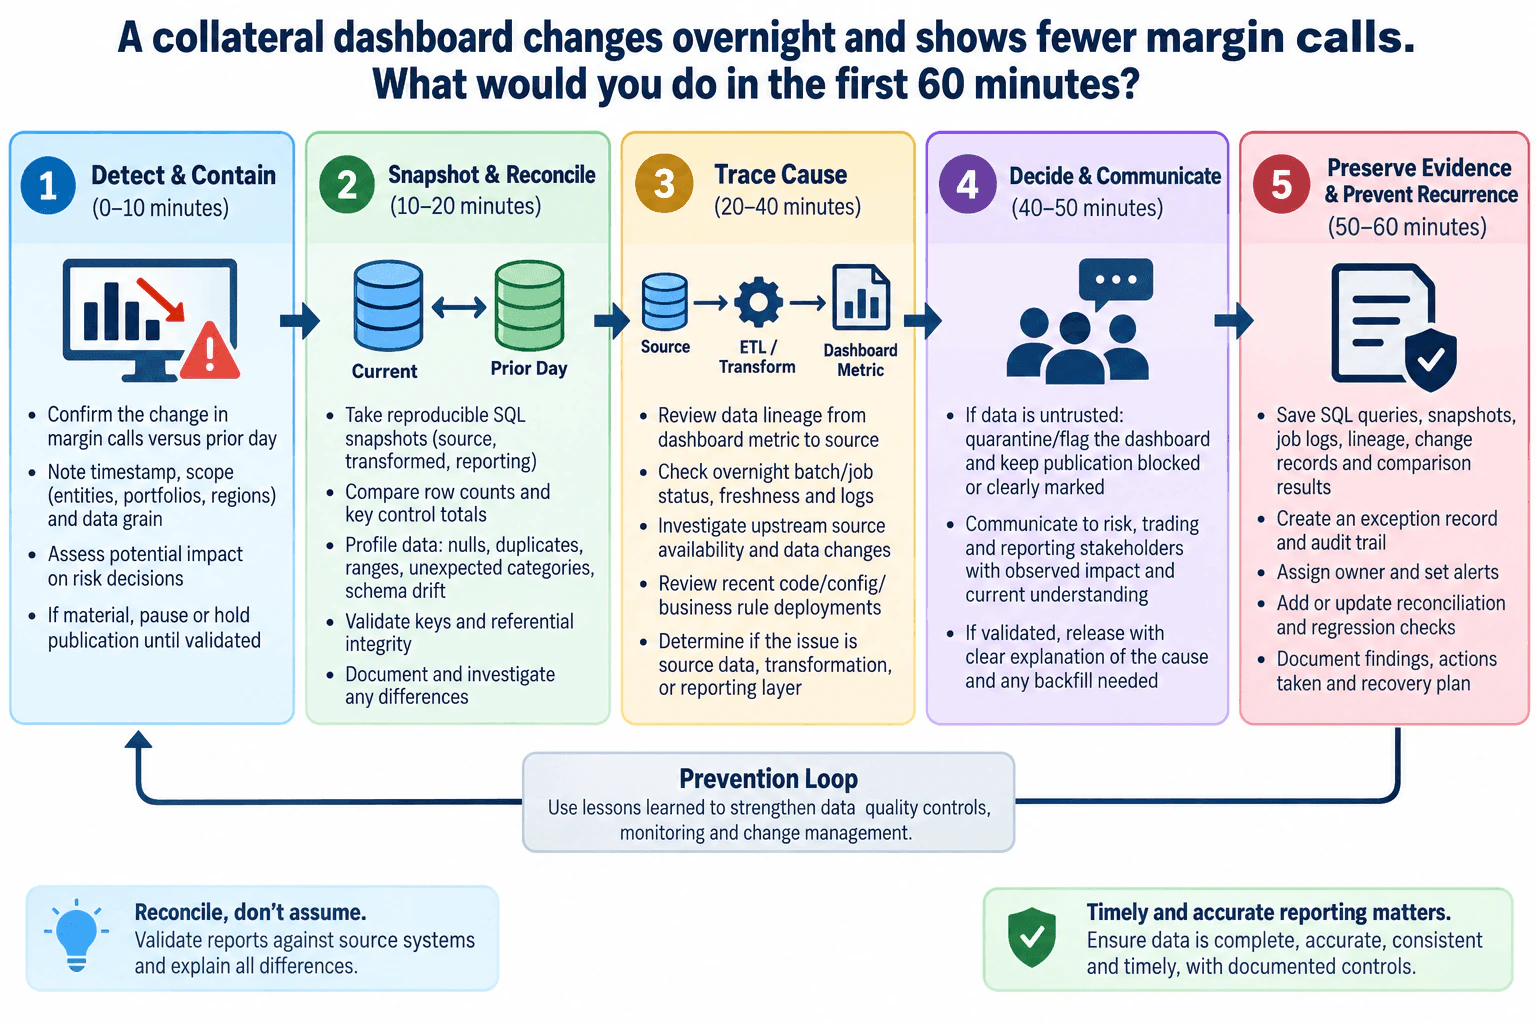
A collateral dashboard changes overnight and shows fewer margin calls. What would you do in the first 60 minutes? diagram
How to Explain It in an Interview

0–10 minutes — Detect & Contain. I would first reproduce the observation that the dashboard shows fewer margin calls than the prior reporting period. I would record the timestamp, reporting window, filters, data grain, affected entities or segments, and the exact dashboard state so the comparison can be repeated. I would determine whether the change is isolated or broad and whether it could affect risk, trading, reporting, or another downstream decision. If the data may be unreliable and the impact could be material, I would pause publication or clearly mark the dashboard as under validation rather than allowing an unverified result to be treated as fact.

At this stage I would separate observation from interpretation. The observation is only that the reported margin-call result changed. Possible explanations include a genuine business change, incomplete or late source data, a transformation defect, a schema or reference-data change, a filter change, or a reporting-layer problem. I would not claim any one cause yet.

10–20 minutes — Snapshot & Reconcile. I would take reproducible, read-only SQL snapshots of the relevant source, transformed, and reporting data using the same reporting window and grain. Reconciliation means comparing independently derived counts or control totals across the source-to-report path to find where they stop agreeing. I would compare row counts and appropriate control totals with the source system and the prior valid period while keeping the population, cutoff, filters, units, and aggregation rules consistent.

I would also perform focused data profiling. Completeness asks whether expected records or required values are missing. Accuracy asks whether reported values agree with the trusted source or an established control. Consistency asks whether equivalent data agrees across stages and systems. Validity asks whether values conform to permitted formats, ranges, categories, and business rules. Uniqueness asks whether records that should be unique are duplicated. Timeliness asks whether expected data arrived and was processed within the required reporting window. I would inspect nulls, duplicates, unexpected ranges or categories, schema drift, key uniqueness, and referential integrity where those checks are relevant to the affected metric.

I would not silently delete, overwrite, impute, or repair suspicious records. If invalid records must be isolated, I would quarantine or identify them with a reason so the exception remains auditable. Differences would be documented rather than hidden.

20–40 minutes — Trace Cause. Data lineage is the path from the source data through transformations to the final dashboard metric. I would trace the affected margin-call metric backward from the dashboard through the reporting dataset and transformation steps to the source. At each boundary I would compare row counts, keys, filters, aggregation behavior, and control totals. The first point where reconciliations diverge narrows the likely defect domain.

I would review overnight batch or transformation job status, run times, freshness indicators, logs, and upstream input availability. A successful job status alone would not prove that the data is correct; a job can complete successfully with incomplete input or changed logic. I would therefore validate both execution and data content.

I would also review recent code, configuration, business-rule, schema, reference-data, mapping, filter, and deployment changes that could affect the metric. I would compare those changes with the first point of divergence found during lineage tracing. This avoids blaming the latest deployment merely because it is recent. The goal is to determine whether the issue originates in the source, a transformation, or the reporting layer, or whether the lower result is a validated real business change.

40–50 minutes — Decide & Communicate. If the data remains untrusted, I would keep the dashboard blocked, quarantined, or clearly flagged according to the available publication control. I would communicate a factual status update to risk, trading, reporting, and other relevant stakeholders: what changed, what scope is affected, whether the dashboard is safe to use, what has been checked, what remains uncertain, and the next action. I would not announce a root cause until the evidence supports it.

If validation shows that the change is real and the source-to-report path reconciles, I would release or continue publication with a clear explanation of the cause and any required backfill or restatement. The release decision should be no stronger than the evidence.

50–60 minutes — Preserve Evidence & Prevent Recurrence. I would preserve the SQL queries and snapshots, row-count and control-total comparisons, relevant job logs, lineage information, change records, timestamps, exception records, assumptions, known data limitations, decisions, and stakeholder communications. That creates an audit trail and allows another analyst to reproduce the investigation.

Finally, I would assign an owner for unresolved work and feed lessons learned into stronger data-quality controls, monitoring, reconciliation, schema-change detection, regression checks, and a safe-failure publication rule. This closes the prevention loop shown in the diagram: reconcile rather than assume, and protect decision making with timely, accurate, consistent, complete, and well-controlled reporting.

Technical Approach
  1. Detect & Contain (0–10 minutes): confirm the dashboard change, capture timestamp, reporting window, filters, scope, grain, and current state; assess downstream decision impact; pause or clearly flag publication if data may be unreliable.
  2. Snapshot & Reconcile (10–20 minutes): take reproducible read-only SQL snapshots of source, transformed, and reporting data; reconcile row counts and appropriate control totals to the source and prior valid period; profile nulls, duplicates, ranges, unexpected categories, schema drift, keys, and referential integrity where relevant.
  3. Trace Cause (20–40 minutes): trace the metric through lineage from dashboard to source; identify the first stage where results diverge; check overnight job status, run times, freshness, logs, upstream availability, and recent code, configuration, schema, business-rule, mapping, reference-data, filter, or deployment changes; distinguish source, transformation, and reporting defects from a validated real business change.
  4. Decide & Communicate (40–50 minutes): maintain publication controls while data is untrusted; give stakeholders a factual update; release only when validation supports it and explain any backfill or restatement.
  5. Preserve Evidence & Prevent Recurrence (50–60 minutes): save queries, snapshots, comparisons, logs, lineage, change records, decisions, and communications; create an exception record and audit trail; assign ownership; add or update reconciliation, alerts, regression checks, and safe-failure controls.
Practical Insights

The main cost is investigative breadth rather than algorithmic complexity. More source layers, transformations, portfolios, reporting periods, and control totals mean more comparisons and more data to scan. Starting with scope, row counts, control totals, lineage, and the first point of divergence keeps the investigation fast. There is also a speed-versus-assurance tradeoff: publishing quickly may reduce delay, but publishing unverified risk information can create a larger decision risk. The safer choice is to communicate early while keeping unreliable output controlled until the evidence is strong enough to release it.

Why Interviewers Ask This

The interviewer is testing whether I can respond to a potentially important reporting anomaly without jumping to conclusions. They want to see whether I can protect downstream decisions, preserve evidence, distinguish a real business change from a data defect, reconcile the dashboard to its source, trace lineage, communicate uncertainty, and leave an auditable path to prevention and recovery.

Common interview mistakes

Common mistakes are assuming that fewer margin calls must be a real business improvement, comparing periods with different filters or cutoffs, checking only the dashboard instead of reconciling to the source, treating a successful job status as proof of correct data, changing records before preserving evidence, ignoring nulls or duplicate keys, blaming the most recent deployment without locating the first point of divergence, continuing normal publication while data is untrusted, communicating a suspected root cause as confirmed, and failing to save the queries, logs, assumptions, comparisons, and decisions needed for an audit trail.

Interview tip

Present the answer as the five timed stages shown in the diagram: Detect & Contain, Snapshot & Reconcile, Trace Cause, Decide & Communicate, and Preserve Evidence & Prevent Recurrence. Keep distinguishing what you observed from what you have actually proven.
Interviewer may ask next
What if the source-system row count and control totals are correct, but the dashboard still shows fewer margin calls?

I would narrow the investigation to the transformation and reporting path because the source evidence now suggests the expected population exists upstream. I would compare row counts and keys before and after each transformation, inspect joins, filters, aggregation logic, mappings, null handling, reference-data changes, and schema changes, and identify the first stage where the expected population or total changes. I would also verify that the dashboard is reading the intended dataset, reporting window, and filters. I would keep publication controlled until the transformed and reported results reconcile to the trusted source or the difference is explained by an approved business rule.

What would you do if stakeholders need the dashboard immediately but you cannot confirm the root cause within the first hour?

I would separate urgency from data trust. I would tell stakeholders exactly what has been validated, what remains uncertain, which scope may be affected, and whether the output is safe for any limited use. If the data is not trustworthy for the intended decision, I would keep the normal dashboard blocked or clearly marked and, if an independently validated source or prior approved view exists, provide it only with its limitations stated. I would preserve the investigation evidence, assign an owner, define the next validation checkpoint, and continue tracing the discrepancy rather than releasing an unverified result simply because the deadline is urgent.

2. A recurring mismatch between onboarding reference data and settlement instructions causes daily exceptions. How would you stop it from recurring?Data Quality And ValidationMediumJpmorgan Chase

Question Details

Cover root cause, system-of-record ownership, data contracts, validation rules, exception monitoring, SLAs, escalation, and proof that the durable control works.

Short Interview Answer (30-60 seconds)

I would first trace the recurring exception through lineage to determine whether the defect starts in onboarding reference data, settlement instructions, or a transformation between them. Then I would define the authoritative owner for each source and a data contract covering schema, required fields, governed matching keys, authoritative fields, and change rules. Before settlement, I would run automated quality checks and reconcile the two sources. Failed records would be quarantined with reason codes, ownership, risk-based SLA targets, and escalation. Finally, I would fix the root cause, add regression checks, monitor exception trends and control totals, and keep an audit trail showing the same cause does not recur.

Detailed Explanation

The task is to stop a recurring data mismatch instead of correcting the same exception every day. I would trace where the mismatch first appears, decide which systems and owners are authoritative, and place preventive checks before settlement processing. The control should verify that required data is complete, accurate where verifiable, consistent, valid, unique at the defined grain, and timely. It should reconcile onboarding reference data with settlement instructions, safely quarantine failures, assign them to an owner, and record what happened. The durable fix is proven when repeated production cycles show the same root cause no longer returns.

Useful Questions to Ask the Interviewer
  1. Which system is currently authoritative for onboarding reference data, and which one owns settlement instructions?
  2. What is the intended row grain and which governed fields should identify the same settlement relationship across the two sources?
  3. Are the exceptions caused by missing records, conflicting values, stale data, duplicate records, schema changes, or failed transformations?
  4. Which fields are mandatory for settlement, and which fields may legitimately differ by account, currency, market, or another settlement dimension?
  5. What reconciliation controls, control totals, and exception reports already exist?
  6. What risk-based triage, resolution, and escalation SLAs are documented for these exceptions?
  7. What evidence would the business accept as proof that the control is durable?
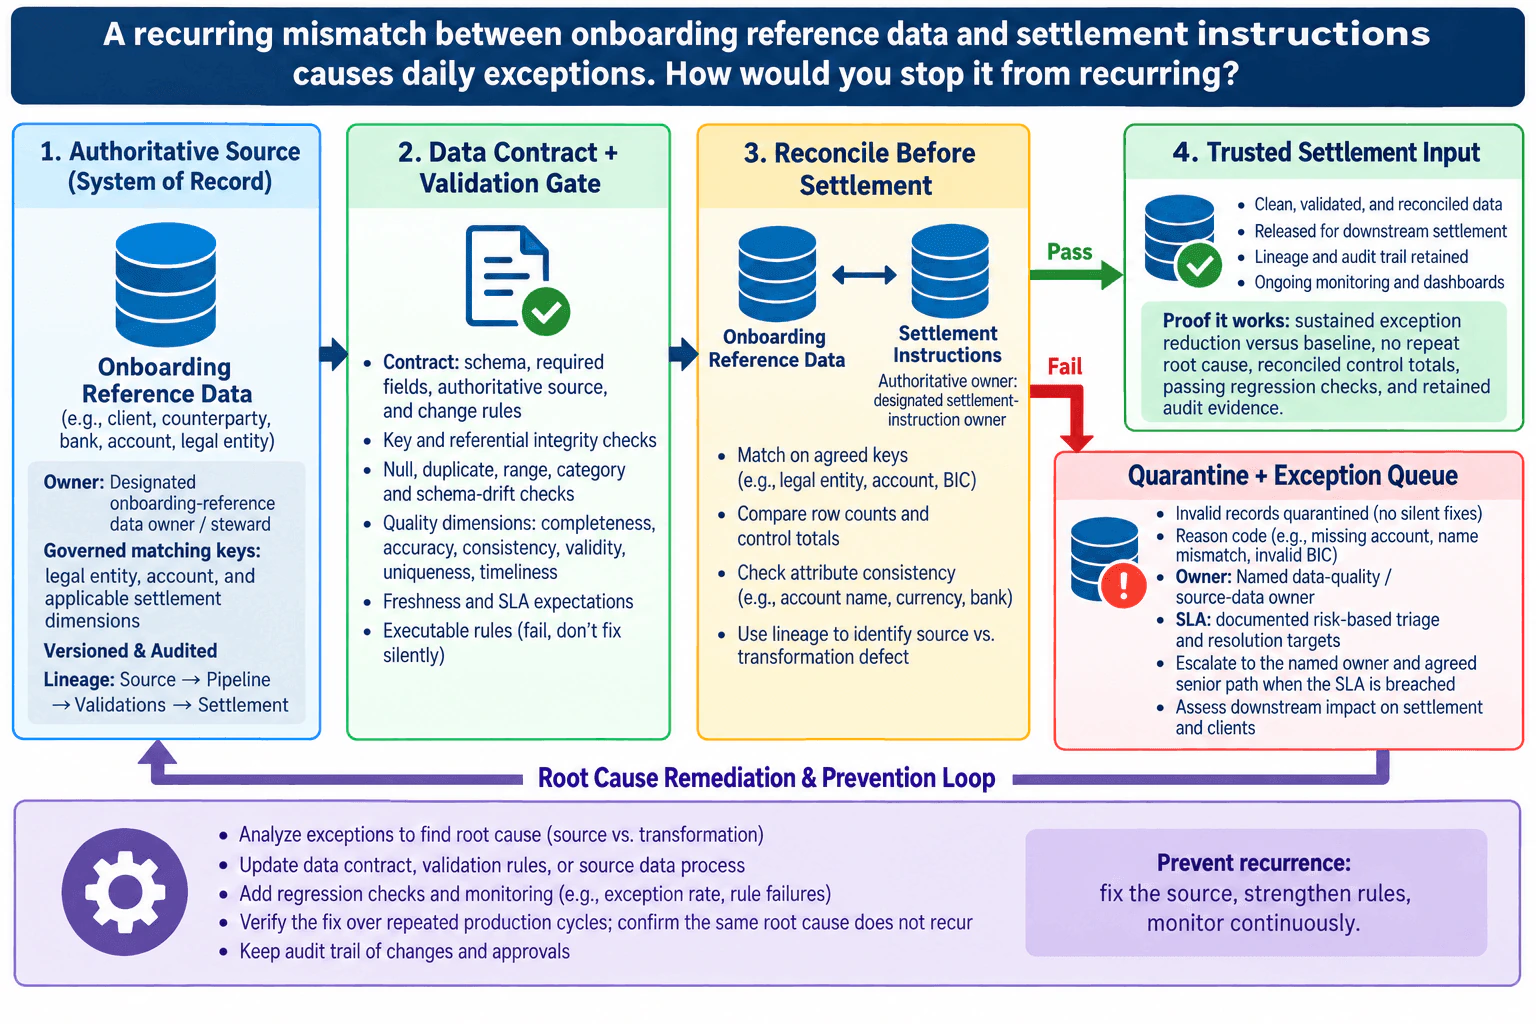
A recurring mismatch between onboarding reference data and settlement instructions causes daily exceptions. How would you stop it from recurring? diagram
How to Explain It in an Interview

I would structure the solution as a prevention loop rather than a daily repair process.

First, I would establish the source of truth and ownership. Onboarding reference data needs a designated owner or steward, and settlement instructions need their own authoritative owner. I would document the expected grain and the governed matching keys, such as legal entity, account, and any settlement dimensions required by the business. I would not assume that an account identifier is globally unique unless the data contract explicitly defines that rule.

Second, I would perform root-cause analysis using data lineage. I would take representative exceptions and trace each failed field back through transformations to its authoritative source. That separates a source-data defect from a transformation defect. I would also compare row counts before and after transformations so unexpected record loss or duplication becomes visible.

Third, I would define a versioned data contract. The contract would specify the schema, required fields, authoritative source for each governed attribute, expected grain, valid categories or ranges, matching rules, freshness expectations, and controlled change process. A schema or rule change should not silently enter production; it should be reviewed, tested, versioned, and auditable.

Fourth, I would add a validation gate before settlement. Data quality means checking whether the data is fit for its intended use. Completeness means required values are present. Accuracy means values agree with the authoritative source when they can be verified. Consistency means the same governed attribute does not conflict across systems. Validity means values conform to allowed formats, ranges, and business rules. Uniqueness means duplicates do not exist where the defined grain requires one record. Timeliness means data is fresh enough for the settlement process. The gate would therefore profile nulls, duplicates, unexpected categories, ranges, and schema drift; validate keys and referential integrity; and fail safely rather than silently correcting records.

Fifth, I would reconcile onboarding reference data with settlement instructions before release downstream. Reconciliation is a controlled comparison between sources that should agree. I would match on the agreed governed keys, compare critical attributes, and reconcile row counts and relevant control totals at the same grain. Any difference should produce an explicit exception rather than passing through unnoticed.

Sixth, failed records would go to a quarantine and exception queue. Each exception should record the failed rule, affected record or key, source, timestamp, owner, status, and resolution evidence. Invalid records should not be silently dropped, overwritten, imputed, or repaired. The named data-quality or source-data owner should investigate under documented risk-based triage and resolution targets. If the SLA is breached, the case should follow the agreed senior escalation path. I would also assess downstream impact so the team knows whether settlement processing, clients, reporting, or other dependent processes are affected.

Seventh, I would remove the root cause rather than just clearing the queue. If the source process is wrong, correct the source process. If the data contract is incomplete, update the contract. If a transformation introduces the mismatch, correct that transformation. Then I would add a regression test covering the exact failure mode so the same defect is caught automatically before settlement in the future.

Finally, I would prove that the control works. I would establish a baseline from historical exceptions without inventing a target, then monitor exception counts and rates, rule failures, reconciled row counts, control totals, and repeat root-cause categories over repeated production cycles. I would expect sustained reduction versus that baseline, passing regression checks, reconciled controls, and no recurrence of the same root cause. All rule changes, approvals, failures, investigations, and resolutions should remain in an audit trail. That gives both operational evidence and governance evidence that the fix is durable.

The main tradeoff is that stronger preventive controls can stop or delay processing when data fails validation. I would prefer that safe failure for settlement-critical fields rather than allow questionable data downstream, but the exact blocking rules and SLAs should be risk-based. Lower-risk issues might generate warnings, while material mismatches should quarantine the record. The key is to define that behavior explicitly in the data contract instead of making ad hoc decisions during daily exception handling.

Technical Approach
  1. Define the authoritative owner, source, grain, governed matching keys, and settlement-critical fields for both onboarding reference data and settlement instructions.
  2. Trace representative exceptions through lineage to distinguish source defects from transformation defects.
  3. Profile nulls, duplicates, ranges, categories, freshness, and schema drift, and compare row counts through transformations.
  4. Create a versioned data contract covering schema, required fields, authoritative attributes, matching rules, valid values, freshness, and controlled change.
  5. Add pre-settlement validation for completeness, accuracy where verifiable, consistency, validity, uniqueness at the defined grain, timeliness, keys, and referential integrity.
  6. Reconcile the two authoritative sources using agreed keys, critical attributes, row counts, and appropriate control totals.
  7. Quarantine failed records with reason codes, ownership, timestamps, audit evidence, risk-based SLAs, and escalation.
  8. Correct the true source or transformation defect and add regression checks for that failure mode.
  9. Monitor exception trends, control totals, rule failures, and repeat root causes over repeated production cycles.
  10. Confirm durable control through sustained improvement versus baseline, successful reconciliation, passing regression checks, and no repeat of the same root cause.
Practical Insights

The main cost is operational and governance complexity rather than algorithmic complexity. Every incoming or changed record must pass validation and reconciliation checks, so processing work generally grows with the number of records and rules being checked. More rules improve prevention but require maintenance, ownership, testing, and careful change management. Blocking bad records protects downstream settlement but can delay processing, so the organization needs risk-based rules for which failures should quarantine a record, which may only warn, and how quickly owners must respond.

Why Interviewers Ask This

The interviewer is testing whether I can move beyond repeatedly fixing bad records and design a durable, auditable control that identifies the root cause, establishes authoritative ownership, prevents invalid data from flowing downstream, handles exceptions safely, and proves that the recurring problem has actually been eliminated.

Common interview mistakes

Common mistakes are manually correcting each daily exception without finding the root cause; declaring a system of record without naming an accountable owner; assuming identifiers are universally unique without defining the actual grain; comparing records without a documented data contract; checking only nulls while ignoring duplicates, invalid categories, ranges, schema drift, freshness, and referential integrity; reconciling values but not row counts or control totals; silently dropping or overwriting failed records; using invented numerical SLAs or exception thresholds instead of documented risk-based targets; escalating without a defined ownership path; fixing a transformation when the defect is actually at the source; and claiming success after a short-term drop in exceptions without regression evidence, repeated production-cycle monitoring, and an audit trail.

Interview tip

Present the answer as a closed control loop: identify the authoritative sources and owners, trace the root cause, enforce a data contract and validation gate, reconcile before settlement, quarantine and escalate failures safely, correct the source or transformation, then prove the same cause does not recur through regression checks, control totals, exception trends, and audit evidence.

Interviewer may ask next
What would you do if both source systems contain different values and neither team can immediately prove which one is correct?

I would not choose a value arbitrarily or let the record pass. I would quarantine the affected record, identify the authoritative owner for the disputed attribute, trace lineage and change history, and gather the supporting source evidence needed to establish the correct value. Until ownership is resolved, I would document the uncertainty and downstream impact. The long-term fix would be to update the data contract so each governed field has one authoritative source, explicit ownership, change rules, and a controlled exception process for genuinely ambiguous cases.

What if strict validation starts blocking too many settlements even though it catches real data issues?

I would separate validation rules by materiality and failure behavior. Settlement-critical mismatches should continue to fail safely and quarantine the record, while lower-risk checks may generate warnings if the business risk permits. I would review exception volume by rule, confirm that each rule is applied at the correct grain, and remove false positives caused by incomplete contracts or incorrect assumptions rather than weakening valid controls. I would then agree risk-based triage and resolution targets with the owners, keep monitoring rule failures and downstream impact, and retain regression tests so reducing operational friction does not reintroduce the original defect.

3. What controls would you add when settlement instructions disagree across onboarding and settlement systems?Data Quality And ValidationHardJpmorgan Chase

Question Details

Discuss high-risk hard stops, lower-risk exception routing, field-level validation, lineage, ownership, thresholds, downstream failure linkage, and audit evidence.

Short Interview Answer (30-60 seconds)

I would compare the onboarding and settlement records at the same client-and-instruction grain and validate required fields such as account or BIC, agent or custodian, market or depository, currency, settlement method, and effective date. A high-risk mismatch would trigger a hard stop and quarantine; a lower-risk mismatch would go to an owned exception queue for manual review and approval. I would log the source values, rule result, owner, timestamp, approval, and reason code, then link downstream settlement failures back to the exact mismatch when possible and use that evidence to refine thresholds, rules, and regression checks.

Detailed Explanation

The task is to stop an incorrect settlement instruction from reaching downstream processing when onboarding and settlement systems disagree. I would not assume either system is automatically correct. I would compare the same client and instruction across both sources, validate each important field, and classify the mismatch by configured business risk. Material differences should stop processing; lower-risk differences should go through controlled review. Every decision needs an owner, reason, timestamp, approval evidence, and trace back to the original source values. I would also monitor rejected or delayed settlements so recurring defects can strengthen future validation rules.

Useful Questions to Ask the Interviewer
  1. Which system is authoritative for each settlement-instruction field, or is authority defined field by field?
  2. What is the exact matching grain for the instruction comparison?
  3. Which field differences are considered material enough to block settlement immediately?
  4. Which lower-risk differences may be reviewed manually, and who has approval authority?
  5. What configured thresholds or escalation rules apply to unresolved exceptions?
  6. What downstream rejected or delayed settlement data can be linked back to an instruction mismatch?
  7. What audit evidence is required for release, stop, amendment, cancellation, or approved exceptions?
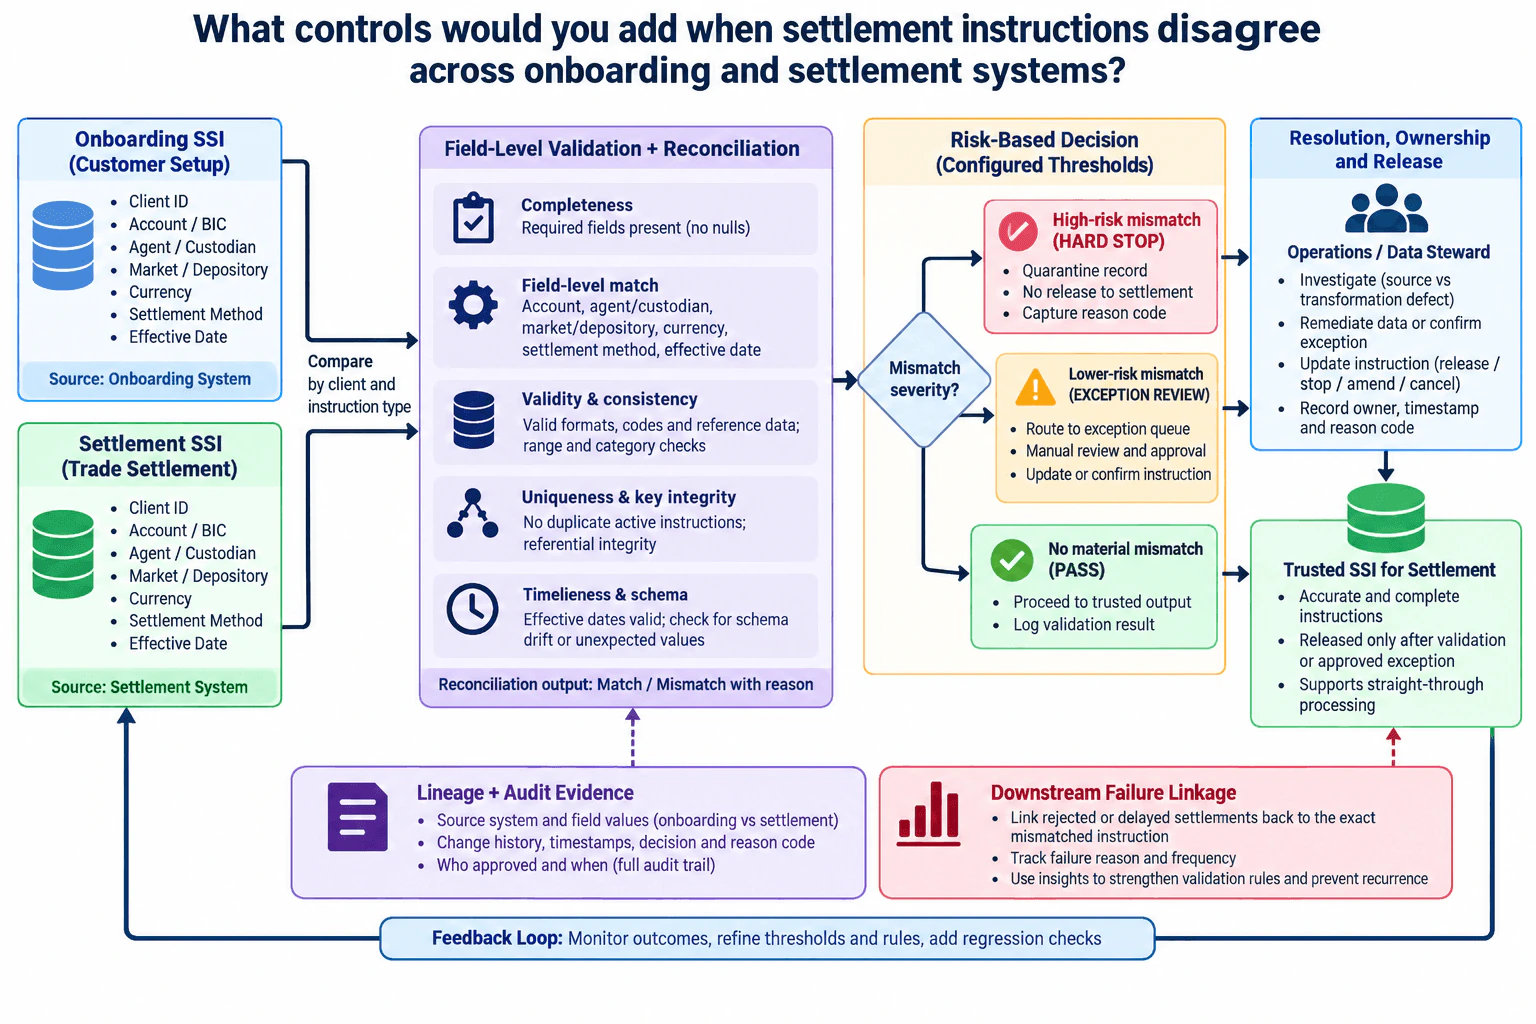
What controls would you add when settlement instructions disagree across onboarding and settlement systems? diagram
How to Explain It in an Interview

I would organize the control as one end-to-end reconciliation flow.

First, I would define the reconciliation boundary and grain. The comparison must represent the same client and the same settlement instruction in both systems. I would document which source is authoritative for each field instead of assuming that onboarding or settlement is always correct. I would preserve the original source values so the control never silently overwrites, imputes, or repairs a conflicting record.

Second, I would run field-level validation and reconciliation. Completeness means required fields are present rather than null. Accuracy means a value is supported by the designated source of truth. Consistency means corresponding fields agree across systems after approved standardization. Validity means values follow permitted formats, codes, ranges, and reference data. Uniqueness means there is no unintended duplicate active instruction at the defined grain. Timeliness means the effective date and instruction are appropriate for the processing point.

For the fields shown in the diagram, I would compare account or BIC, agent or custodian, market or depository, currency, settlement method, and effective date. I would also check nulls, duplicates, valid ranges or categories, referential integrity, and schema drift. Where transformations occur between source and comparison layers, I would check row counts before and after transformation and reconcile appropriate control totals so a transformation defect is not mistaken for a source-data defect.

Third, the reconciliation should produce an explicit match or mismatch with a reason. The rule should identify the failing field and retain both source values. Lineage should show whether the bad value originated in onboarding, the settlement system, or a transformation step. That makes the exception reproducible and lets the owner investigate the real source of the defect.

Fourth, I would apply the configured risk decision. A high-risk mismatch becomes a hard stop: quarantine the record, do not release it to settlement, and capture a reason code. A lower-risk mismatch goes to an exception queue for manual review and approval. The reviewer can remediate the data or confirm the correct instruction. The resulting action can be release, stop, amend, or cancel as appropriate. If there is no material mismatch, the instruction can proceed to the trusted settlement output and the validation result is logged.

Fifth, ownership must be explicit. An operations or data-steward owner should investigate whether the mismatch is a source-system defect or a transformation defect, resolve the exception, and record the decision. The audit trail should include who acted, when they acted, which values were reviewed, the validation result, the approval, and the reason code.

Sixth, I would maintain lineage and audit evidence. The evidence should retain the source systems and field values, change history, timestamps, decision, reason code, validation result, owner, and approval history. This supports independent review and recovery without losing the original conflicting values.

Seventh, I would link downstream failures back to the control. Rejected or delayed settlements should be linked to the exact mismatched instruction when the relationship can be established. I would track the failure reason and recurrence pattern, but I would not assume every downstream failure was caused by the data-quality mismatch.

Finally, I would create a prevention loop. I would monitor outcomes, review recurring mismatches and downstream failures, refine configured thresholds and validation rules when evidence supports the change, and add regression checks so previously identified defects do not return. The tradeoff is that stricter hard stops provide stronger protection but can create more operational exceptions, while looser thresholds reduce interruption but increase the chance that an incorrect instruction progresses. Thresholds therefore need documented ownership, evidence, and periodic review.

Technical Approach
  1. Define the reconciliation grain, authoritative source by field, required schema, and approved materiality rules.
  2. Read the corresponding onboarding and settlement instructions without overwriting either source.
  3. Profile and validate required fields for nulls, duplicates, formats, codes, ranges, unexpected categories, referential integrity, effective dates, and schema drift.
  4. Validate transformation integrity with row-count and appropriate control-total reconciliation.
  5. Compare account or BIC, agent or custodian, market or depository, currency, settlement method, effective date, and other approved instruction fields at the same grain.
  6. Produce an explicit match or mismatch result with the failing field, source values, lineage, and reason.
  7. Apply configured risk rules: quarantine and hard-stop high-risk mismatches; route lower-risk mismatches to an owned exception queue; allow records with no material mismatch to proceed.
  8. Record the owner, validation result, approval, timestamp, reason code, and resulting release, stop, amend, or cancel action.
  9. Link rejected or delayed downstream settlements to the originating instruction mismatch when traceable.
  10. Monitor outcomes, review thresholds and recurring defects, update controlled validation rules, and add regression checks.
Practical Insights

The processing cost grows with the number of instructions and the number of fields and rules checked for each instruction. More detailed lineage and audit evidence add storage and operational effort, while manual exception review adds human workload. The main business tradeoff is between safety and throughput: stricter hard stops reduce the chance of an unsafe settlement instruction progressing, but they can increase exceptions and delays; looser thresholds reduce interruptions but increase risk. The control should therefore optimize for safe failure, traceability, and governed exception handling rather than simply minimizing exception volume.

Why Interviewers Ask This

The interviewer is testing whether the analyst can design a controlled, auditable response to conflicting settlement data rather than simply choosing one system or silently repairing records. The key judgment is how to validate fields, distinguish material from lower-risk differences, stop unsafe processing, route exceptions to accountable owners, preserve lineage and audit evidence, connect quality defects to downstream settlement failures, and improve the controls over time.

Common interview mistakes

Common mistakes are assuming one system is automatically correct without documented field-level authority; comparing records at the wrong grain; checking only whether whole records match instead of identifying the exact failing field; using undocumented materiality thresholds; silently overwriting or repairing conflicting values; allowing high-risk mismatches to proceed during investigation; treating every mismatch as equally severe; failing to assign an exception owner; omitting null, duplicate, referential-integrity, effective-date, or schema-drift checks; ignoring transformation defects; failing to preserve original values and lineage; omitting reviewer, timestamp, approval, validation result, or reason code from the audit trail; and assuming every downstream settlement failure was caused by the mismatch without tracing the actual failure reason.

Interview tip

Present the answer as one control flow: reconcile the same instruction across both sources, validate the fields, classify the mismatch by configured risk, hard-stop or route the exception, record ownership and audit evidence, then link downstream failures back to the defect and use that evidence to improve thresholds and rules. Emphasize that conflicting values are never silently overwritten.

Interviewer may ask next
How would you decide which settlement-instruction mismatches deserve a hard stop instead of manual exception review?

I would base that decision on approved business and operational rules, not analyst intuition at runtime. Fields or combinations of fields whose mismatch could materially change where, how, or when settlement occurs should be configured as high risk and quarantined before release. Lower-risk differences can be routed to manual review when an approved exception process exists. I would validate the classification using historical exceptions and downstream outcomes, then periodically review false positives, missed risks, and recurring causes with the accountable owners. Any change to materiality or thresholds should be versioned, approved, and auditable.

What would you do if stricter validation greatly increased settlement exceptions and delayed processing?

I would analyze which rules are generating the exceptions and separate genuine settlement risk from transformation defects, stale reference data, harmless standardization differences, and recurring source-system problems. I would not weaken a high-risk hard stop just to reduce volume. For lower-risk rules, I would use exception outcomes and downstream failure evidence to review thresholds or standardization logic with the control owners. I would also correct recurring upstream causes and add regression checks so exception volume falls through prevention rather than by allowing unsafe records through.

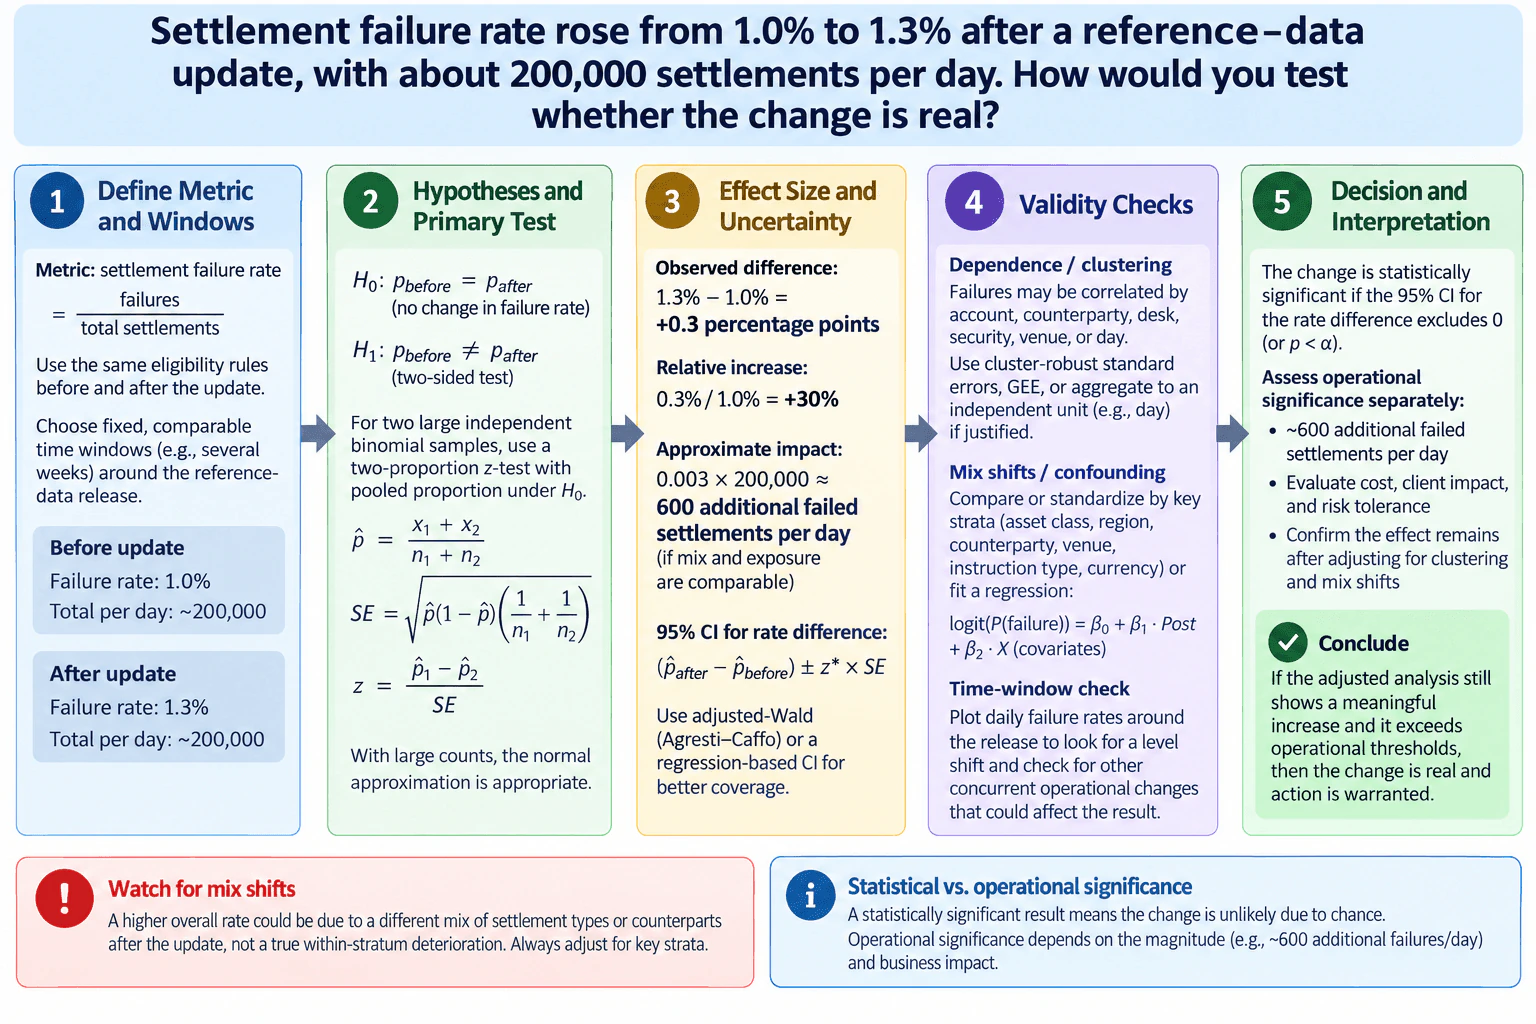
4. Settlement failure rate rose from 1.0% to 1.3% after a reference-data update, with about 200,000 settlements per day. How would you test whether the change is real?Statistics And ExperimentationMediumJpmorgan Chase

Question Details

Choose a statistical test, report an effect size and confidence interval, address dependence and mix shifts, and distinguish statistical from operational significance.

Short Interview Answer (30-60 seconds)

I would compare fixed, comparable pre- and post-update windows using the same settlement eligibility rules. I would test H0: p_before = p_after against H1: p_before != p_after. For large independent binomial samples, a two-proportion z-test is appropriate, using the pooled proportion for the null-test standard error. The observed effect is +0.3 percentage points, or +30% relative to the 1.0% baseline. I would report a 95% confidence interval for the rate difference using an appropriate interval standard error, then check clustering, mix shifts, and daily time trends. If dependence exists, I would use cluster-robust standard errors, GEE, or appropriate aggregation. Finally, I would separate statistical significance from operational significance: at about 200,000 settlements per day, a 0.3-point increase is roughly 600 additional failures per day if volume and mix are comparable.

Detailed Explanation

The task is to determine whether the rise in settlement failures from 1.0% to 1.3% reflects a real change in the underlying failure rate rather than random variation or a different mix of settlements. I would first choose comparable time windows before and after the reference-data update and apply the same eligibility rules. Then I would test the difference in proportions, quantify the +0.3 percentage-point effect, report a 95% confidence interval, and check whether clustering, mix changes, or concurrent operational changes could explain the result. I would treat statistical and operational significance as separate decisions.

Useful Questions to Ask the Interviewer
  1. What exact pre- and post-update windows should be compared, and were any other operational changes made during those periods?
  2. Can failures cluster by day, account, counterparty, security, venue, or another unit?
  3. Did the mix of asset classes, regions, counterparties, venues, instrument types, or currencies change after the update?
  4. Is there a predefined operational threshold for an unacceptable increase in settlement failures?
Settlement failure rate rose from 1.0% to 1.3% after a reference-data update, with about 200,000 settlements per day. How would you test whether the change is real? diagram
How to Explain It in an Interview

First, define the metric and comparison. The settlement failure rate is failed settlements divided by total settlements. I would use fixed, comparable windows around the reference-data release, such as several weeks before and after, with the same eligibility rules in both periods. The population is the relevant set of settlements in those windows, and the outcome for each settlement is failure versus success.

The observed sample rates are 1.0% before and 1.3% after. The absolute effect size is 1.3% - 1.0% = +0.3 percentage points. Relative to the 1.0% baseline, that is a 30% increase. With about 200,000 settlements per day, 0.003 x 200,000 is about 600 additional failed settlements per day, assuming volume, exposure, and settlement mix are comparable.

Next, state the hypotheses clearly. The null hypothesis is H0: p_before = p_after, meaning there is no change in the underlying failure rate. The alternative is H1: p_before != p_after, meaning the rates differ.

If the two samples are large and settlement outcomes can reasonably be treated as independent binomial observations, I would use a two-proportion z-test. Under H0, estimate the common rate with the pooled proportion p_hat = (x_before + x_after) / (n_before + n_after). The hypothesis-test standard error is sqrt[p_hat(1-p_hat)(1/n_before + 1/n_after)], and the z statistic compares the observed difference with that null standard error. The p value then tells us how surprising the observed difference would be if the underlying rates were actually equal.

I would report the effect size separately from the p value. The effect is +0.3 percentage points, not the p value. I would also report a 95% confidence interval for p_after - p_before. The confidence interval should use a standard error appropriate for estimating the difference rather than automatically reusing the pooled-null standard error from the z-test. An adjusted-Wald method such as Agresti-Caffo or an interval from an adjusted regression model can be used. If the 95% confidence interval excludes zero, that supports a statistically detectable difference at the corresponding two-sided significance level.

The independence assumption needs special attention. Settlement failures may be correlated within the same day, account, counterparty, security, or venue. If that dependence is present, a naive settlement-level test can underestimate uncertainty. I would use cluster-robust standard errors, GEE, or aggregate to an appropriate independent unit such as day when justified by the data structure.

I would also test for mix shifts and confounding. A higher overall failure rate could occur because the post-update period contains a larger share of settlement types that already have higher failure rates. I would compare important strata such as asset class, region, counterparty, venue, instrument type, and currency. I could standardize both periods to a common mix or fit an adjusted logistic regression such as logit(P(failure)) = beta0 + beta1 * Post + beta2 * X, where X contains relevant observed covariates. If the adjusted Post effect remains elevated, the evidence for a genuine within-mix deterioration becomes stronger.

A time-window check is also important. I would plot daily failure rates around the release date to look for a level shift, unusual days, pre-existing trends, or another concurrent operational change. Because this is an observational before-versus-after comparison rather than a randomized experiment, I would not claim that the reference-data update caused the increase unless competing explanations are adequately ruled out.

Finally, I would separate statistical significance from operational significance. Statistical significance asks whether the observed difference is unlikely to be explained by sampling variation under the model. Operational significance asks whether the magnitude matters to the business. At the stated volume, +0.3 percentage points corresponds to roughly 600 additional failed settlements per day if exposure and mix are comparable. I would evaluate the cost, client impact, regulatory or risk implications, and any predefined operational threshold. I would recommend action only after confirming that the adjusted effect persists after the dependence, mix-shift, and time-trend checks.

Technical Approach
  1. Define the settlement population, failure-rate denominator, eligibility rules, and fixed comparable pre- and post-update windows.
  2. Compute the observed failure rates and effect size: 1.3% - 1.0% = +0.3 percentage points, which is +30% relative to the 1.0% baseline.
  3. State H0: p_before = p_after and H1: p_before != p_after.
  4. For large independent binomial samples, run a two-proportion z-test using the pooled proportion under H0 for the hypothesis-test standard error.
  5. Report a 95% confidence interval for p_after - p_before using an interval standard error appropriate for estimating the difference, such as an adjusted-Wald method, rather than automatically reusing the null-pooled standard error.
  6. Check dependence by day, account, counterparty, security, venue, or other natural clusters. If independence is not credible, use cluster-robust standard errors, GEE, or an appropriate aggregation level.
  7. Check mix shifts across key strata such as asset class, region, counterparty, venue, instrument type, and currency. Standardize to a common mix or fit adjusted logistic regression if needed.
  8. Plot daily failure rates around the update to check for a level shift, outlier days, pre-existing trends, and concurrent changes.
  9. Confirm whether the adjusted effect remains after dependence and mix-shift corrections.
  10. Separate statistical significance from operational significance and compare the magnitude, approximately 600 additional failures per day at the stated volume if comparable, with business-risk thresholds.
Practical Insights

The basic two-proportion test is computationally inexpensive because it needs only failure counts and total settlement counts for the two periods. The larger effort is validating the comparison: choosing comparable windows, checking dependence, examining mix shifts, and fitting adjusted models when necessary. Cluster-robust, GEE, or regression approaches add analytical complexity but provide more credible uncertainty estimates when settlements are not independent. With very large samples, small effects can become statistically detectable, so the effect size and business impact must still be evaluated separately.

Why Interviewers Ask This

This tests whether the candidate can choose an appropriate statistical test for a change in proportions, quantify effect size and uncertainty, recognize dependence and composition shifts, and distinguish statistical significance from operational importance.

Common interview mistakes

Common mistakes include declaring the change real from 1.0% versus 1.3% without quantifying uncertainty; reporting only a p value instead of the +0.3 percentage-point effect; confusing a 30% relative increase with a 30-percentage-point increase; reusing the pooled-null standard error as the confidence-interval standard error without justification; assuming every settlement is independent despite clustering; ignoring changes in settlement mix; using non-comparable pre- and post-periods; claiming causation from a simple before-and-after comparison; and treating statistical significance as proof that the operational impact is important.

Interview tip

Present the answer in the diagram's order: define the metric and comparable windows, state H0 and H1, choose the two-proportion z-test, report the +0.3 percentage-point effect and confidence interval, check dependence and mix shifts, inspect the time trend, and finish by separating statistical from operational significance. Explicitly mention that the conclusion should be based on the adjusted analysis, not only the naive test.

Interviewer may ask next
What would you change if settlement failures are strongly correlated within each day?

I would not rely on the naive settlement-level independence assumption because it could make the standard error too small. I would account for day-level dependence using cluster-robust standard errors if there are enough independent day clusters, use GEE with an appropriate working correlation structure, or aggregate to daily failure rates if day is the appropriate independent unit. I would then report the adjusted effect and confidence interval and compare them with the naive result as a sensitivity check.

What if the rise from 1.0% to 1.3% is mostly caused by a different mix of settlements after the update?

I would compare failure rates within important strata such as asset class, region, counterparty, venue, instrument type, and currency. I could standardize both periods to the same settlement mix or fit logistic regression with a Post indicator plus those observed covariates. If the adjusted Post effect becomes small or disappears, the overall rise was largely a composition effect. If it remains elevated after adjustment, the evidence for a real within-mix deterioration is stronger.

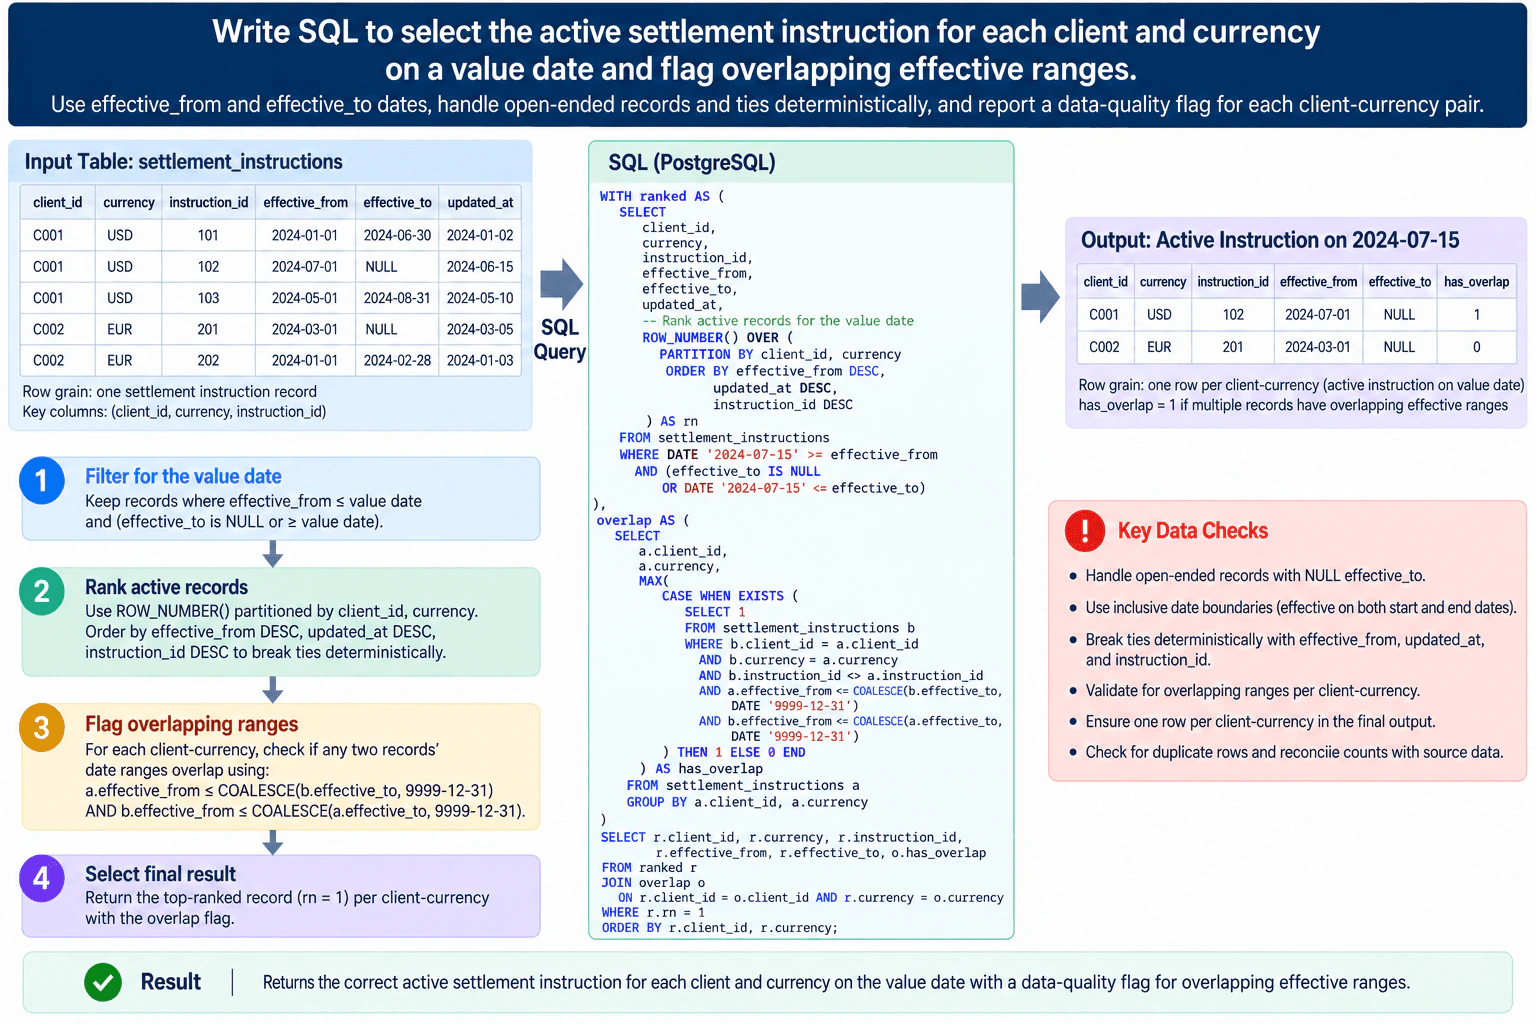
5. Write SQL to select the active settlement instruction for each client and currency on a value date and flag overlapping effective ranges.Sql And DatabasesMediumJpmorgan Chase

Question Details

Use effective_from and effective_to dates, handle open-ended records and ties deterministically, and report a data-quality flag for each client-currency pair.

Short Interview Answer (30-60 seconds)

I would first filter to settlement instructions active on the value date using effective_from <= value_date and either effective_to IS NULL or effective_to >= value_date. Then I would use ROW_NUMBER() partitioned by client and currency, ordered by effective_from DESC, updated_at DESC, and instruction_id DESC so ties are deterministic. Separately, I would detect whether any two effective ranges for that client-currency overlap, reduce that result to one flag per pair, join it back, and return only rn = 1.

Detailed Explanation

See the Code while reading this explanation.

The task is to return one active settlement instruction for each client and currency on a chosen value date. Each source row represents one settlement-instruction record, and effective_from and effective_to define when it applies. A NULL effective_to means the record is open-ended. If several records are active at once, the query must choose one consistently instead of returning duplicates. It must also report whether the client-currency has overlapping effective ranges, because an overlap is a data-quality problem even when one row can still be selected deterministically.

Useful Questions to Ask the Interviewer
  1. Should effective_from and effective_to both be inclusive? The approved diagram assumes yes.
  2. Does NULL effective_to always mean open-ended rather than missing data?
  3. Is the combination of client_id, currency, and instruction_id unique for a settlement-instruction record?
  4. Is updated_at an approved tie-breaker when two active rows have the same effective_from date?
  5. Should the overlap flag describe any overlapping effective ranges for the client-currency, or only multiple records active on the requested value date? The approved diagram flags any overlapping effective ranges.
  6. Should client-currency pairs with no active instruction on the value date be omitted? The approved diagram omits them.
Write SQL to select the active settlement instruction for each client and currency on a value date and flag overlapping effective ranges. diagram
How to Explain It in an Interview

Start with the grain. The source grain is one settlement-instruction record per row. The final grain is one selected active row per client_id and currency. That distinction matters because self-comparisons and joins can otherwise multiply rows.

I would use PostgreSQL and separate the work into two CTEs so each stage has one clear responsibility.

First, the ranked CTE filters the table to records active on the value date. A record is active when effective_from is on or before the value date and effective_to is either NULL or on or after the value date. These are inclusive boundaries, so a record remains active on its effective_from and effective_to dates. The explicit effective_to IS NULL condition is required because comparisons with NULL do not evaluate to TRUE.

Next, ROW_NUMBER() ranks only those active rows within each client_id and currency. Ordering by effective_from DESC prefers the instruction with the latest effective start date. updated_at DESC breaks a remaining tie, and instruction_id DESC is the final deterministic tie-breaker. ROW_NUMBER() is appropriate because the required output is one selected row per client-currency. RANK() could assign the same rank to tied rows and would not by itself guarantee one result.

The overlap CTE then examines the full settlement_instructions table for intersecting effective ranges within each client and currency. Two inclusive date ranges overlap when a.effective_from is on or before b's effective end and b.effective_from is on or before a's effective end. COALESCE(effective_to, DATE '9999-12-31') treats an open-ended range as continuing indefinitely for this comparison. The condition b.instruction_id <> a.instruction_id prevents a record from being compared with itself.

For each source row, CASE WHEN EXISTS returns 1 if another record for the same client-currency overlaps it and 0 otherwise. MAX() then reduces those row-level results to exactly one has_overlap flag per client_id and currency. This GROUP BY step is important because joining a row-level overlap result directly to the ranked CTE could duplicate the selected instruction.

Finally, join ranked to overlap on client_id and currency, keep only rn = 1, and return the selected instruction together with has_overlap. Because ranked contains only records active on the value date, client-currency pairs with no active instruction do not appear in the final result.

The main data checks are: verify at most one final row per client_id and currency; test dates exactly equal to effective_from and effective_to; test NULL effective_to; test ties in effective_from and updated_at; review every pair where has_overlap = 1; and compare source, active-set, and final row counts to detect accidental row multiplication. For performance, correctness comes first. On a large table, I would inspect the actual execution plan and available indexes only after confirming the required semantics.

Technical Approach
  1. Define the source grain as one settlement-instruction record per row and the output grain as one active row per client_id and currency.
  2. Filter rows where effective_from <= value_date and effective_to is NULL or effective_to >= value_date.
  3. Within each active client-currency group, assign ROW_NUMBER() ordered by effective_from DESC, updated_at DESC, instruction_id DESC.
  4. Self-compare settlement-instruction records for the same client and currency to detect inclusive effective-range intersections, treating NULL effective_to as open-ended.
  5. Aggregate the row-level overlap checks with MAX() so there is exactly one has_overlap flag per client-currency pair.
  6. Join the one-row-per-pair overlap result to the ranked active rows on client_id and currency.
  7. Keep rn = 1 to return exactly one selected active instruction per pair.
  8. Validate final uniqueness, date boundaries, NULL end dates, deterministic ties, overlap flags, and row counts.
Time & Space Complexity

The active-record step filters rows and sorts records within each client-currency group for ROW_NUMBER(). The overlap step uses a correlated EXISTS check against the same table, so it can become expensive when a client-currency has many historical records because multiple effective ranges may need to be compared. GROUP BY then reduces the result to one overlap flag per pair. For a large table, I would inspect the actual execution plan and existing indexes before recommending a specific optimization.

Example

The PostgreSQL implementation matches the approved diagram. The ranked CTE keeps only records active on DATE '2024-07-15' and assigns a deterministic ROW_NUMBER() within each client-currency. The overlap CTE checks the full settlement_instructions table for intersecting effective ranges, treats NULL effective_to as open-ended, and uses MAX() with GROUP BY so it returns exactly one has_overlap flag per client-currency. The final query joins those two results and keeps rn = 1.

Code
WITH
  ranked AS (
    SELECT
      client_id,
      currency,
      instruction_id,
      effective_from,
      effective_to,
      updated_at,
      ROW_NUMBER() OVER (
        PARTITION BY
          client_id,
          currency
        ORDER BY
          effective_from DESC,
          updated_at DESC,
          instruction_id DESC
      ) AS rn
    FROM
      settlement_instructions
    WHERE
      DATE '2024-07-15' >= effective_from
      AND (
        effective_to IS NULL
        OR DATE '2024-07-15' <= effective_to
      )
  ),
  overlap AS (
    SELECT
      a.client_id,
      a.currency,
      MAX(
        CASE
          WHEN EXISTS (
            SELECT
              1
            FROM
              settlement_instructions b
            WHERE
              b.client_id = a.client_id
              AND b.currency = a.currency
              AND b.instruction_id <> a.instruction_id
              AND a.effective_from <= COALESCE(b.effective_to, DATE '9999-12-31')
              AND b.effective_from <= COALESCE(a.effective_to, DATE '9999-12-31')
          ) THEN 1
          ELSE 0
        END
      ) AS has_overlap
    FROM
      settlement_instructions a
    GROUP BY
      a.client_id,
      a.currency
  )
SELECT
  r.client_id,
  r.currency,
  r.instruction_id,
  r.effective_from,
  r.effective_to,
  o.has_overlap
FROM
  ranked r
  JOIN overlap o ON r.client_id = o.client_id
  AND r.currency = o.currency
WHERE
  r.rn = 1
ORDER BY
  r.client_id,
  r.currency;
Where it is used

This pattern is useful for effective-dated reference data such as settlement instructions, account configurations, pricing rules, client mandates, eligibility records, or other master-data records where exactly one version should apply on a business date and overlapping validity periods indicate a data-quality issue.

Why Interviewers Ask This

This tests whether you can reason about effective-dated data at the correct grain, handle NULL end dates and inclusive date boundaries, choose one active record deterministically when several rows qualify, detect overlapping ranges without multiplying rows, and validate that the final output contains one selected instruction per client-currency pair.

Common interview mistakes

Common mistakes are comparing effective_to directly with the value date without handling NULL; using exclusive boundaries when the requirement is inclusive; ranking all historical records before filtering to active ones; using RANK() and accidentally allowing multiple top rows; omitting deterministic tie-breakers; comparing an effective range with itself; using only one side of the interval-overlap condition; joining a row-level overlap result without first reducing it to one row per client-currency; and failing to verify the final output grain.

Interview tip

State the grain first, then explain the query in four steps: filter active rows, rank them deterministically, reduce overlap detection to one flag per client-currency, and select rn = 1. Explicitly call out NULL effective_to and inclusive date boundaries because those are common sources of subtle SQL errors.

Interviewer may ask next
What changes if the overlap flag should only indicate multiple instructions active on the requested value date rather than any historical overlap?

I would calculate the flag from the same active set used for ranking instead of comparing every historical effective range. After filtering to the value date, I could compute COUNT(*) OVER (PARTITION BY client_id, currency) and set has_overlap to 1 when that count is greater than 1. ROW_NUMBER() would still select one deterministic active instruction, while the count would show that multiple instructions were simultaneously active on that value date.

How would you change the design if updated_at is not an approved business tie-breaker?

I would ask for the authoritative business precedence field or rule rather than inventing one. instruction_id can provide reproducible technical ordering if it is unique, but that does not necessarily mean it identifies the correct business instruction. If no business tie-breaker exists, I would surface the ambiguity as a data-quality issue instead of presenting an arbitrary technical ordering as business truth.

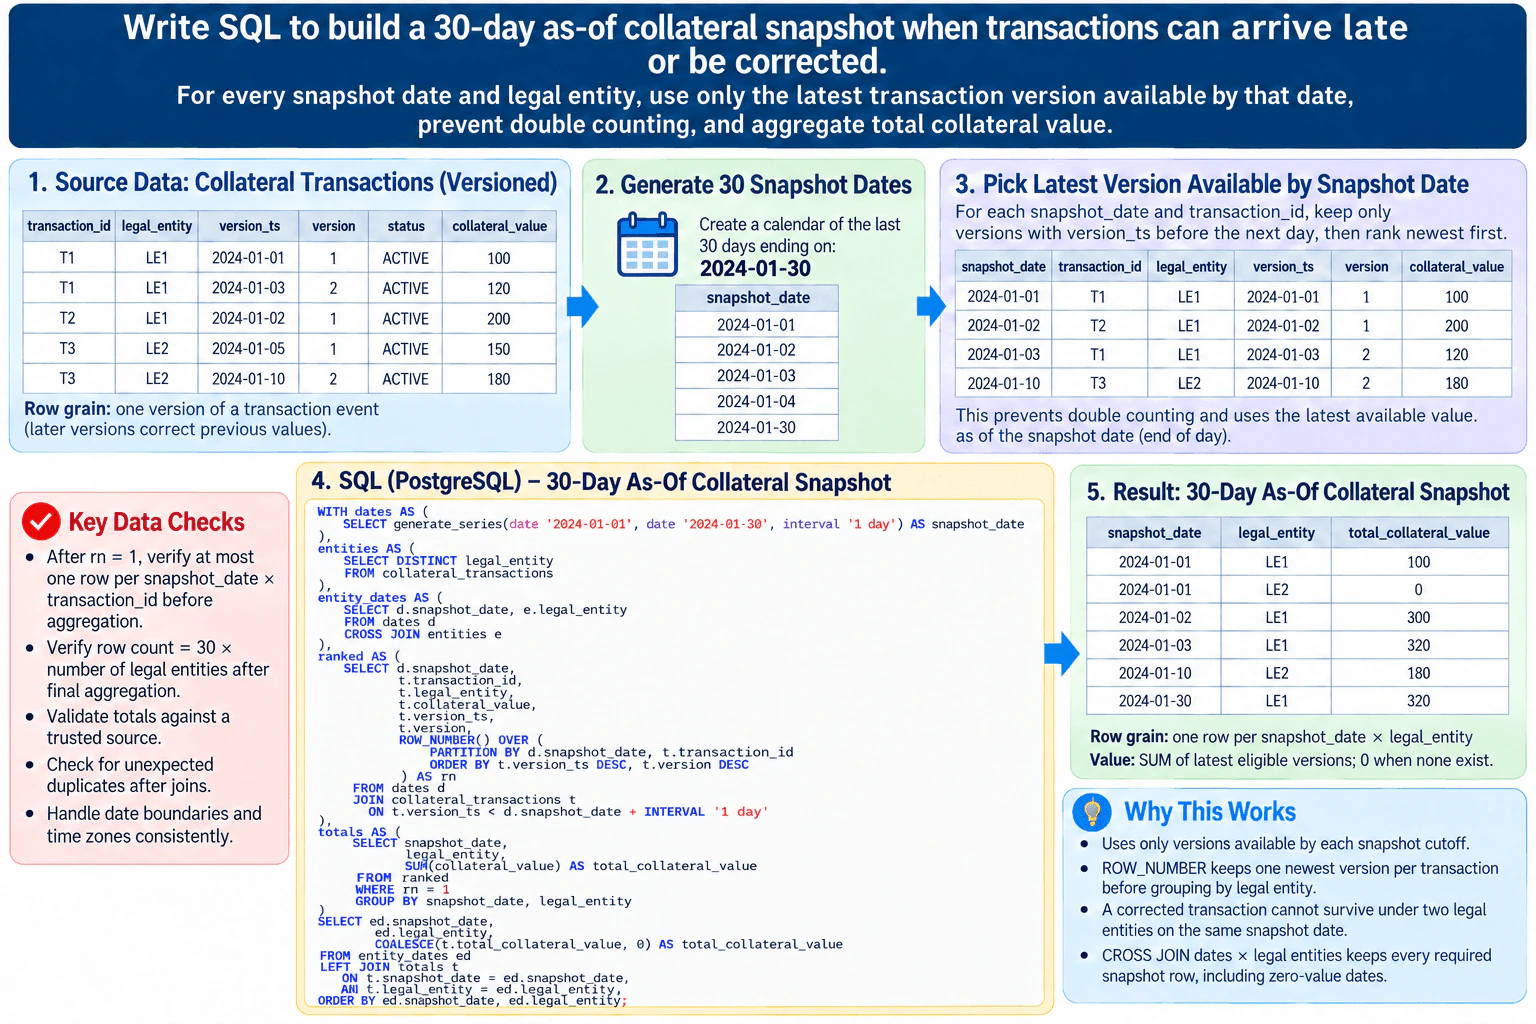
6. Write SQL to build a 30-day as-of collateral snapshot when transactions can arrive late or be corrected.Sql And DatabasesHardJpmorgan Chase

Question Details

For every snapshot date and legal entity, use only the latest transaction version available by that date, prevent double counting, and aggregate total collateral value.

Short Interview Answer (30-60 seconds)

I would generate the 30 snapshot dates, build the legal-entity population, and separately create an as-of transaction set for each date. For each snapshot date and transaction_id, I would keep only versions available before the next day, rank them by version_ts DESC and version DESC, and keep rn = 1. Then I would aggregate those latest versions by snapshot_date and the selected version's legal_entity. Finally, I would LEFT JOIN the totals to the complete snapshot-date × legal-entity grid so combinations with no eligible collateral return zero. I would validate transaction uniqueness, output row count, boundary handling, and control totals.

Detailed Explanation

See the Code while reading this explanation.

The task is to rebuild what collateral looked like on each day in a 30-day window, even when a transaction is corrected later. Each source row is one version of a transaction. For a given snapshot date, first keep only versions that were available by the end of that day. Then use ROW_NUMBER to choose one newest version per transaction so corrections are not counted twice. After that, sum collateral_value by snapshot date and legal entity. Finally, keep every date and legal-entity combination and return zero when no eligible collateral exists.

Useful Questions to Ask the Interviewer
  1. Does "available by that date" mean through the end of the snapshot date, and what time zone defines that boundary?
  2. Is transaction_id the stable logical transaction key across corrections, and is version unique within a transaction when version_ts ties?
  3. Should every legal entity appear on every one of the 30 dates, even before it has an eligible transaction?
  4. Can legal_entity change on a corrected transaction version, and should the latest version's legal_entity control the snapshot?
  5. What should status mean for cancelled or inactive versions? The approved diagram does not filter status, so that business rule must be confirmed.
  6. Can collateral_value or version_ts be NULL, and should an unknown collateral value remain unknown rather than being converted to zero?
Write SQL to build a 30-day as-of collateral snapshot when transactions can arrive late or be corrected. diagram
How to Explain It in an Interview

Start with the grain. The source table collateral_transactions has one row per transaction version. transaction_id identifies the logical transaction, version_ts says when that version became available, version provides a tie-breaker, legal_entity is the entity on that version, and collateral_value is the amount to aggregate. The required output grain is one row per snapshot_date × legal_entity.

Query Plan: 1. Generate the 30 daily snapshot dates with generate_series. 2. Build the legal-entity population with SELECT DISTINCT legal_entity, then CROSS JOIN those entities to the dates. This creates the complete reporting grid, including combinations that may have no eligible collateral. 3. Build the as-of transaction set separately. Join each snapshot date to transaction versions where version_ts < snapshot_date + INTERVAL '1 day'. This is a half-open end-of-day boundary: versions available during the snapshot date qualify; later versions do not. 4. Use ROW_NUMBER() OVER (PARTITION BY snapshot_date, transaction_id ORDER BY version_ts DESC, version DESC). Keeping rn = 1 selects one newest available version per logical transaction before legal-entity aggregation. legal_entity must not be in this partition because a correction could change legal_entity; including it could allow the same transaction to survive twice under different entities. 5. GROUP BY snapshot_date, legal_entity and SUM(collateral_value) only after filtering to rn = 1. This prevents corrected versions from being double counted. 6. LEFT JOIN those totals back to the complete date × legal-entity grid. COALESCE the missing aggregate row to zero so a required reporting combination still appears when it has no eligible collateral.

SQL Reasoning: ROW_NUMBER is appropriate because the requirement is to keep exactly one latest version per transaction for each snapshot date. version_ts DESC chooses the most recently available version, and version DESC is the stated secondary ordering. If version_ts and version can both tie for the same transaction, another stable unique version-row key is needed for fully deterministic ordering; no such field is supplied, so I would ask for it rather than invent one.

The legal-entity grid and transaction ranking solve different problems. entity_dates guarantees output completeness. ranked guarantees transaction-level correctness. Keeping those steps separate means an empty date/entity placeholder never participates in ROW_NUMBER, while the legal_entity from the selected latest transaction version determines where that transaction is aggregated.

Data Checks:

  • After rn = 1, verify there is at most one row per snapshot_date × transaction_id.
  • After the final LEFT JOIN, verify the output row count is 30 × the number of legal entities in the reporting population.
  • Reconcile total collateral for selected snapshot dates to a trusted control source.
  • Test a transaction with multiple corrections and confirm that only the newest version available at each snapshot cutoff contributes.
  • Test versions around midnight and confirm the intended time zone and the < next-day boundary.
  • Check NULL behavior explicitly. A NULL version_ts does not satisfy the cutoff and is therefore excluded. SUM ignores NULL collateral_value values. If a group contains only NULL collateral values, SUM returns NULL and the final COALESCE would turn that into zero, so the shown query assumes collateral_value is non-NULL or that this treatment is approved. Otherwise, distinguish "no eligible transaction" from "eligible transaction with unknown value."
  • Confirm status semantics before adding a status filter. Filtering versions by status before selecting the latest correction can produce an incorrect as-of state if a newer version changes status.

Correctness comes before optimization. The as-of join can expand because each transaction version may match multiple later snapshot dates. With only 30 dates, the multiplier is bounded, but on a large history table I would inspect the execution plan and tune access paths only after confirming that any optimization preserves the same point-in-time result.

Technical Approach

1. Generate 30 snapshot dates. 2. Select DISTINCT legal entities and CROSS JOIN them to the dates for complete output coverage. 3. Join dates to transaction versions available before the next-day cutoff. 4. Rank versions with ROW_NUMBER by snapshot_date and transaction_id, ordered by version_ts DESC and version DESC. 5. Keep rn = 1. 6. Aggregate collateral_value by snapshot_date and the selected version's legal_entity. 7. LEFT JOIN the totals to the complete date × legal-entity grid and COALESCE missing totals to zero. 8. Validate transaction uniqueness, expected output row count, date boundaries, NULL behavior, and trusted control totals.

Practical Complexity & Trade-offs

The most expensive step is the as-of join because one historical transaction version can match several snapshot dates. ROW_NUMBER then orders eligible versions within each snapshot-date/transaction group, and GROUP BY aggregates only the surviving latest versions. With 30 dates, the date multiplier is bounded, but actual cost depends on table size, data distribution, indexes, and the PostgreSQL execution plan. Establish correctness first, then use EXPLAIN or EXPLAIN ANALYZE before deciding on performance changes.

Example

PostgreSQL implementation matching the approved diagram. The query separates reporting completeness from version selection: entity_dates creates every required snapshot_date × legal_entity row, ranked selects one latest available version per transaction, totals aggregates those selected versions by legal entity, and the final LEFT JOIN restores combinations with no eligible collateral as zero. It assumes transaction_id is the stable logical transaction key and that version_ts plus version provides the intended ordering. The end-of-day rule uses the half-open boundary version_ts < snapshot_date + INTERVAL '1 day'.

Code
WITH
  dates AS (
    SELECT
      generate_series (
        DATE '2024-01-01',
        DATE '2024-01-30',
        INTERVAL '1 day'
      ) AS snapshot_date
  ),
  entities AS (
    SELECT DISTINCT
      legal_entity
    FROM
      collateral_transactions
  ),
  entity_dates AS (
    SELECT
      d.snapshot_date,
      e.legal_entity
    FROM
      dates d
      CROSS JOIN entities e
  ),
  ranked AS (
    SELECT
      d.snapshot_date,
      t.transaction_id,
      t.legal_entity,
      t.collateral_value,
      t.version_ts,
      t.version,
      ROW_NUMBER() OVER (
        PARTITION BY
          d.snapshot_date,
          t.transaction_id
        ORDER BY
          t.version_ts DESC,
          t.version DESC
      ) AS rn
    FROM
      dates d
      JOIN collateral_transactions t ON t.version_ts < d.snapshot_date + INTERVAL '1 day'
  ),
  totals AS (
    SELECT
      snapshot_date,
      legal_entity,
      SUM(collateral_value) AS total_collateral_value
    FROM
      ranked
    WHERE
      rn = 1
    GROUP BY
      snapshot_date,
      legal_entity
  )
SELECT
  ed.snapshot_date,
  ed.legal_entity,
  COALESCE(t.total_collateral_value, 0) AS total_collateral_value
FROM
  entity_dates ed
  LEFT JOIN totals t ON t.snapshot_date = ed.snapshot_date
  AND t.legal_entity = ed.legal_entity
ORDER BY
  ed.snapshot_date,
  ed.legal_entity;
Where it is used

This pattern is useful for point-in-time reporting over versioned data where corrections can arrive after the original event, such as collateral, balances, positions, limits, reference data, or other daily operational and regulatory snapshots.

Why Interviewers Ask This

This tests whether you can reason correctly about data grain, late-arriving corrections, as-of date boundaries, deterministic window-function deduplication, complete date/entity coverage, aggregation, and validation without double counting.

Common interview mistakes

Common mistakes are adding legal_entity to the ROW_NUMBER partition, which can let one corrected transaction survive twice if its entity changes; aggregating before deduplicating versions; using version_ts <= snapshot_date when snapshot_date represents midnight and unintentionally excluding same-day arrivals; filtering status before choosing the latest version without confirmed business semantics; using RANK when exactly one version is required; failing to define a deterministic tie-breaker; using an INNER JOIN for the final output and dropping zero-value date/entity combinations; converting unknown NULL collateral values to zero without agreement; and checking only aggregate totals without validating the transaction-level grain.

Interview tip

State the two grains first: one source row per transaction version and one output row per snapshot_date × legal_entity. Then explain the flow in order: availability cutoff, ROW_NUMBER per transaction, rn = 1, aggregation, LEFT JOIN to the complete date/entity grid, and validation. Explicitly explaining why legal_entity is excluded from the ranking partition demonstrates strong point-in-time correctness reasoning.

Interviewer may ask next
What if two versions of the same transaction have the same version_ts?

Use version DESC as the next tie-breaker, as shown in the diagram and query. If version_ts and version can both tie, the ordering is still not deterministic. I would ask for the stable unique version-row key and add it as another ORDER BY expression rather than inventing one. I would also validate that no snapshot_date × transaction_id has multiple candidate rows with identical ordering fields.

What changes if the history grows from 30 days to several years?

The same as-of logic remains correct, but the date-to-version join can become much larger because each version may match many later snapshot dates. I would keep the point-in-time semantics unchanged, inspect the PostgreSQL execution plan, and consider optimizations such as effective validity ranges or materialized periodic snapshots only if they reproduce the same latest-version result. I would validate the optimized result against the original query on selected dates, transaction-level uniqueness checks, and control totals.

7. Which three visuals would you use to brief a collateral-management executive on margin-call volume, dollar exposure, and limit breaches?Data Visualization And StorytellingMediumJpmorgan Chase

Question Details

Explain visual choice and hierarchy, then specify definitions and footnotes for netting, currency conversion, limits, dates, and outliers.

Short Interview Answer (30-60 seconds)

I would use three visuals. First, a line chart for margin-call volume over time because the key comparison is trend. Second, a ranked horizontal bar chart for dollar exposure so the executive can quickly see which approved groups carry the largest amounts. Third, a bullet-style or bar-with-limit-marker chart for limit breaches so actual exposure is directly compared with the applicable limit. I would keep all three views on the same reporting scope and add concise footnotes for netting, currency conversion, limits, dates, and outlier treatment.

Detailed Explanation

The goal is to help a collateral-management executive answer three questions quickly: Is margin-call activity changing? Where is the largest dollar exposure? Which exposures are beyond their limits? I would not force these into one chart because they are different comparisons. The dashboard should move from overall activity, to financial magnitude, to exceptions that may require attention. Before building it, I would confirm the reporting population, time window, data grain, netting method, reporting currency, FX convention, limit definition, effective dates, and outlier treatment so all three visuals use consistent rules.

Useful Questions to Ask the Interviewer
  1. What reporting period and time grain should be used for margin-call volume?
  2. Should dollar exposure be shown gross or after an approved netting treatment, and what is the permitted netting scope?
  3. What reporting currency should be used, and what FX source, rate convention, and conversion date or time should apply?
  4. Which limit definition is authoritative, and are the limits effective-dated or otherwise time-varying?
  5. What approved grouping should be used for the exposure comparison, such as an existing business, portfolio, counterparty, or risk grouping?
  6. How should outliers be handled: included, annotated, transformed under an approved rule, or reviewed separately?
How to Explain It in an Interview

I would start with the executive decision, then choose each chart from the comparison being made. That keeps the dashboard simple and prevents one visual from trying to answer several different questions.

  1. Margin-call volume: line chart over time.

A line chart is the best fit because the main comparison is change across ordered time periods. The x-axis would show the agreed reporting dates or intervals, and the y-axis would show margin-call count at the agreed grain. I would keep the time interval consistent and avoid silently joining missing periods as if data existed. Important spikes or changes can be annotated if there is a verified explanation. I would not use a pie chart because the executive needs a trend, not a part-to-whole comparison.

The definition must be clear. I would state exactly what counts as one margin call, which reporting population is included, the reporting cutoff, and the time zone if it affects date assignment. Duplicates, null dates, and missing reporting periods should be checked before plotting.

  1. Dollar exposure: ranked horizontal bar chart.

A bar chart is appropriate because the executive is comparing magnitudes across discrete groups. I would use the approved business or risk grouping already defined for the data rather than inventing a grouping. I would sort the bars from largest to smallest so concentration is easy to see. A horizontal layout is especially helpful when labels are long.

The measure must say whether exposure is gross or net. If netting is applied, the footnote should state the approved netting scope and method. If multiple currencies are involved, every value should be converted using the same reporting-currency convention before comparison. The footnote should identify the reporting currency, FX source, rate type or convention, and conversion date or time basis. I would use a consistent unit and avoid mixing currencies or scales in the same comparison.

For ordinary non-negative magnitude comparisons, I would use a zero baseline. If the defined exposure measure can legitimately be negative, I would preserve those values and use a scale that truthfully represents both signs rather than forcing the chart into a positive-only design.

  1. Limit breaches: bullet-style chart or bar with a limit marker.

For limit breaches, the most useful executive visual compares the observed exposure directly with the applicable limit. A bullet-style chart, or a horizontal bar with a clearly marked limit reference, makes that relationship easy to see. The actual value and the limit must use compatible units and the same scope. Items that exceed the limit should be visually emphasized, but I would also use a label, symbol, or status text so the meaning does not depend on color alone.

The limit definition is critical. I would state the authoritative limit source, the scope to which it applies, and its effective date. If limits change over time, each exposure must be compared with the limit valid for that reporting date. The exact boundary rule also needs to be explicit: for example, whether a value equal to the limit is compliant or considered a breach according to the governing business definition.

If the available data contains only a breach flag or breach count and does not contain both the observed exposure and the applicable limit, I would not fabricate a threshold comparison. In that case, I would use a ranked breach-count or breach-status bar chart and clearly state the limitation.

Visual hierarchy and story logic.

I would place the margin-call trend first because it gives the executive context about activity. Dollar exposure comes second because it shows financial scale and concentration. Limit breaches come third because they identify exceptions that may need action. This creates a simple story: what is happening, how large it is, and where attention may be required.

The three visuals must use the same reporting population, cutoff date, and relevant filters unless a difference is clearly disclosed. Otherwise the executive may compare numbers that look related but were calculated from different scopes.

I would remove decoration that does not support the decision. Gridlines, labels, legends, and annotations should be kept only when they improve interpretation. I would not use unnecessary 3D effects, excessive colors, or dense operational detail. Important changes should be annotated selectively rather than labeling every data point.

Required definitions and footnotes.

For netting, I would state whether exposure is gross or net and describe the approved scope of any netting applied.

For currency conversion, I would state the reporting currency, authoritative FX source, rate convention, and conversion date or time basis.

For limits, I would state the limit definition, source, scope, effective date, and boundary rule used to determine a breach.

For dates, I would state the reporting cutoff, aggregation interval, and time zone when it materially affects the result.

For outliers, I would state whether they are included, annotated, capped, transformed, or excluded under an approved rule. I would never silently remove an extreme value merely because it makes the chart harder to display.

Validation.

Before presenting the dashboard, I would reconcile margin-call counts to trusted source totals at the same reporting grain. I would reconcile dollar exposure before and after any approved netting and currency-conversion steps. Where both exposure and limit inputs exist, I would independently recompute breach status and compare it with the dashboard result. I would also check duplicates, nulls, missing reporting periods, missing FX rates, stale or overlapping limits, inconsistent currencies or units, and boundary dates.

If a required FX rate or valid limit is missing, I would flag that record or metric as unresolved rather than silently substituting a value. Any unresolved data-quality issue should be communicated as a limitation.

Tradeoff between executive and operational views.

An executive dashboard should be fast to understand, so I would show the main trend, largest exposures, and material exceptions without crowding the page with record-level detail. An operational view can contain filters, drill-through, transaction-level records, additional history, and investigation fields. The tradeoff is that the executive view contains less detail, but it gives a clearer decision signal. The underlying operational detail remains available for validation and follow-up.

Technical Approach
  1. Confirm the reporting population, executive decision, reporting window, time grain, currency basis, netting treatment, limit definition, limit effective-date logic, and outlier rule.
  2. Define margin-call volume at the agreed grain and aggregate it by the agreed time interval.
  3. Define dollar exposure using the approved gross or net treatment and convert values to one reporting currency using the approved FX convention when required.
  4. Match each exposure to the applicable limit using the correct scope and effective date, then derive breach status only when the necessary inputs are available.
  5. Use a line chart for margin-call trend, a ranked horizontal bar chart for exposure comparison, and a bullet-style or bar-with-limit-marker view for observed exposure versus limit.
  6. Apply consistent reporting scope, dates, units, filters, accessible visual cues, and concise annotations.
  7. Reconcile margin-call counts, exposure totals, currency conversions, and breach calculations to trusted controls.
  8. Add explicit footnotes for netting, currency conversion, limits, dates, and outlier treatment.
  9. Keep the executive page concise and provide drill-through or an operational view for detailed investigation.
Practical Insights

The difficult part is usually not drawing the charts. It is making sure the three measures use compatible definitions and dates. More historical periods, finer time intervals, more groups, and record-level drill-through increase processing and rendering work. Netting, currency conversion, and effective-dated limits also increase validation work because a correct value can become incorrect if it is matched to the wrong scope, currency convention, or date. For an executive view, I would prefer reconciled aggregates and keep detailed records behind drill-through.

Why Interviewers Ask This

This tests whether the candidate can translate three different business questions into appropriate executive visuals without mixing their meanings. The interviewer is judging chart selection, visual hierarchy, metric definition, truthful scaling, executive communication, and whether important reporting rules such as netting, currency conversion, limits, dates, and outlier handling are made explicit.

Common interview mistakes

Using one chart type for all three questions; mixing gross and net exposure without defining the treatment; combining currencies without a documented FX convention; comparing exposure with a stale, overlapping, or incorrectly scoped limit; hiding the reporting cutoff or time grain; silently removing outliers or missing periods; using color alone to communicate breaches; using inconsistent units or filters across visuals; truncating axes in a misleading way; overcrowding the executive page with operational detail; and showing a threshold comparison when the underlying limit value is not actually available.

Interview tip

Explain the dashboard as three comparisons: trend for margin-call volume, magnitude for dollar exposure, and actual-versus-threshold for limit breaches. Then name the five required footnotes—netting, currency conversion, limits, dates, and outliers—and finish with one concrete reconciliation check.

Interviewer may ask next
How would you validate the breach visual if limits can change over time?

I would treat the limits as effective-dated inputs and match each exposure observation to the limit that was valid for that observation's reporting date and scope. I would test boundary dates, missing limits, overlapping effective periods, and the exact rule for whether equality to the limit is compliant or a breach. I would then independently recompute breach status for control totals or a representative validation set and reconcile it with the dashboard. If no valid historical limit is available for an observation, I would flag it as unresolved rather than applying the current limit retroactively.

What would you change if the executive wants one screen but there are too many exposure groups and breaches to display clearly?

I would preserve the three-part hierarchy but reduce displayed detail rather than changing the metric definitions. The first screen would keep the margin-call trend, show the most decision-relevant ranked exposure groups, and summarize the most important breach exceptions with a clear path to drill-through. Any aggregation of remaining groups would use an approved business definition rather than an arbitrary cutoff. I would not hide a material exception simply to make the page cleaner. The tradeoff is less immediate detail in exchange for faster executive comprehension, while the operational view retains the complete investigation detail.

8. Where do you see yourself in the next 5 years?BehavioralEasyJpmorgan Chase

Interview tip:

Use STAR to structure your answer: briefly explain the Situation and Task, make Action the most detailed part, and finish with the Result. For example, describe your current direction as a Data Analyst, the skills and responsibilities you want to develop, the steps you plan to take, how you will work with business partners, and the type of trusted analytical role you hope to grow into.

Situation

At this stage of my career, I want to keep building strong Data Analyst skills while also learning more about how analysis supports important business decisions. I enjoy working with data, but I also want to become better at understanding the business problem behind the numbers and communicating useful insights clearly.

Task

Over the next five years, my goal is to grow from someone who can complete reliable analysis into a trusted analyst who can take more ownership of business questions. I want to become stronger at working with stakeholders, understanding changing requirements, explaining uncertainty, and helping teams make informed decisions.

Action

I plan to build that growth step by step. First, I want to deepen my core analytical skills so I can work confidently with complex data and produce accurate results. At the same time, I want to learn more about the business areas I support because good analysis starts with understanding the decision that needs to be made. I also want to improve how I communicate with stakeholders. That means asking clear questions, confirming requirements early, explaining assumptions, and presenting findings in a way that makes sense to both technical and nontechnical audiences. As I gain experience, I would like to take ownership of larger analytical problems, help newer team members when appropriate, and become someone business partners trust for thoughtful and reliable decision support.

Result

In five years, I hope to be a well rounded Data Analyst with strong technical skills, good business judgment, and a record of being dependable with stakeholders. I am not focused only on a job title. I am more interested in becoming someone who can handle greater responsibility, continue learning, and use data to support meaningful business decisions. I also expect my goals to evolve as I learn more, so I want to stay open to feedback and new opportunities.

Why Interviewers Ask This

Interviewers ask this question to understand whether the candidate has realistic career goals, wants to keep learning, and can connect personal growth with the responsibilities of a Data Analyst. A strong answer shows ambition without sounding rigid, explains how the candidate plans to develop, and demonstrates interest in taking on greater responsibility over time.

Interviewer may ask next
What skills would you most like to develop over those five years?

I would focus on three areas. I want to deepen my analytical skills so I can work confidently with more complex data. I also want to improve my business understanding so I can connect analysis to the decision a stakeholder needs to make. Finally, I want to strengthen my communication skills so I can explain findings, assumptions, and uncertainty clearly to different audiences.

Would you eventually want to move into a leadership role?

I would be open to it, but I would not want to rush into leadership just for the title. My first priority is becoming a strong and dependable analyst who can take ownership of important work. As I gain experience, I would like to support other analysts, share what I have learned, and take on more responsibility. If that naturally develops into a leadership role, I would be interested in exploring it.

9. Tell me about a time you went above and beyond.BehavioralMediumJpmorgan Chase

Interview tip:

Use STAR to structure your answer: briefly explain the Situation and Task, make Action the most detailed part, and finish with the Result. For example, describe a time when you noticed an important business need beyond the original request, took ownership of additional analysis, communicated with stakeholders, checked your assumptions carefully, and delivered useful insight that helped them make a better decision.

Situation

During a previous project, I was asked to prepare an analysis for a business team that needed to make a decision based on recent performance. While reviewing the data, I noticed that the original request would answer the immediate question, but it would not explain an important pattern that could affect the decision.

Task

My responsibility was to deliver the requested analysis accurately and on time. I also wanted to make sure the team understood the reason behind the pattern instead of receiving only a summary of what had happened.

Action

I first completed the core analysis so I did not put the original deadline at risk. Then I reviewed the underlying data in more detail and compared the pattern across relevant groups and time periods. I found that one assumption in the original request did not fully match what the data showed. Before doing extra work, I spoke with the business partner and explained what I had noticed, why it could matter to the decision, and what additional analysis I wanted to perform. After confirming that it would be useful, I investigated the issue further and checked the result from more than one angle to make sure I was not reacting to a data quality problem or a temporary change. I then updated the final presentation so the requested answer came first, followed by the additional finding and a simple explanation of its business impact. I was careful to separate what the data clearly showed from what still required judgment.

Result

The team received the original analysis on time and also had additional context that helped them make a more informed decision. The extra work led to a better discussion because the stakeholders understood both the result and the reason behind it. I learned that going above and beyond does not mean adding unnecessary work. It means recognizing when additional effort can improve the quality of a decision while still protecting the original commitment.

Why Interviewers Ask This

Interviewers ask this question to understand whether a candidate takes ownership beyond the minimum requirement while still using good judgment. A strong answer shows initiative, awareness of business needs, clear stakeholder communication, respect for deadlines, and the ability to add value without creating unnecessary work.

Interviewer may ask next
How did you decide that the additional analysis was worth doing?

I considered whether the extra analysis could change how the stakeholders understood the decision. Because the pattern appeared important and the original analysis did not explain it, I believed it was worth investigating. I also protected the original deadline first and confirmed the value of the additional work with the business partner before spending more time on it.

What would you do differently if you faced a similar situation now?

I would raise the potential additional question with the stakeholder even earlier. In this case, I completed the main analysis before discussing the extra investigation. Now I would share the observation sooner so we could agree on priorities early while still keeping the original request on track.

Disclaimer: This interview guide is for educational and informational purposes only. It is designed to help readers prepare, but it does not guarantee any interview result, hiring decision, offer, or outcome. Interview questions, hiring criteria, and preferred answers can vary by employer, interviewer, industry, location, and time. All answers, examples, and explanations in this guide are suggested examples for interview preparation, not definitive answers or instructions for professional practice. They are based on research and judgment, are provided without warranties of any kind, and should be adapted to the question, role, and applicable laws and professional requirements. Diagrams are simplified illustrations intended to highlight the main concepts and their relationships; actual situations, systems, and practices may be more complex. Alternative approaches may be equally valid or better suited to a particular question, context, or interviewer. To the fullest extent permitted by applicable law, the contributors and publisher are not liable for decisions made, actions taken, or losses incurred based on this guide.

State Laws and Professional Responsibilities: Laws and requirements governing an occupation vary by state and jurisdiction. You are responsible for checking the current laws, licensing requirements, and scope-of-practice rules that apply to your location and role, and for ensuring that your answers and actions comply with them. Adapt examples in this guide to those requirements. This guide is not legal advice.

Company Notice: This guide is an independent educational resource and is not affiliated with, endorsed by, sponsored by, or approved by the company named in this guide. Company names identify reported interview experiences or the employer context of clearly labeled original practice exercises. Interview practices can change without notice, and inclusion of company-specific content does not mean these questions are official, complete, or guaranteed to be asked. To the fullest extent permitted by law, the author, contributors, and publisher are not responsible for outcomes related to use of this material.

Content Accuracy and Verification: To the fullest extent permitted by applicable law, we do not represent or warrant that interview guides, questions, answers, examples, or diagrams are accurate, complete, current, error-free, or suitable for any particular purpose. You are responsible for independently reviewing and verifying the information before relying on it.