This interview guide is for educational and informational purposes only. It is designed to help readers prepare, but it does not guarantee any interview result, hiring decision, offer, or outcome. Interview questions, hiring criteria, and preferred answers can vary by employer, interviewer, industry, location, and time. All answers, examples, and explanations in this guide are suggested examples for interview preparation, not definitive answers or instructions for professional practice. They are based on research and judgment, are provided without warranties of any kind, and should be adapted to the question, role, and applicable laws and professional requirements. Diagrams are simplified illustrations intended to highlight the main concepts and their relationships; actual situations, systems, and practices may be more complex. Alternative approaches may be equally valid or better suited to a particular question, context, or interviewer. To the fullest extent permitted by applicable law, the contributors and publisher are not liable for decisions made, actions taken, or losses incurred based on this guide.
State Laws and Professional Responsibilities
Laws and requirements governing an occupation vary by state and jurisdiction. You are responsible for checking the current laws, licensing requirements, and scope-of-practice rules that apply to your location and role, and for ensuring that your answers and actions comply with them. Adapt examples in this guide to those requirements. This guide is not legal advice.
Identity, Image, and Privacy Notice
To respect individual privacy, some names, profile photographs, avatars, biographical details, and other identifying information displayed in this guide may be replaced with pseudonyms, licensed stock images, illustrative avatars, composite images, or representative descriptions. Unless a person is expressly identified as an actual contributor, a displayed name, image, or profile should not be understood as depicting or identifying a specific candidate, interviewer, employee, or other real individual. These representations are provided for editorial and illustrative purposes only and do not imply endorsement, employment, participation, or affiliation with this guide or any company mentioned in it. Any resemblance to an actual person is coincidental.
Company Notice
This guide is an independent educational resource and is not affiliated with, endorsed by, sponsored by, or approved by the company named in this guide. Company names identify reported interview experiences or the employer context of clearly labeled original practice exercises. Interview practices can change without notice, and inclusion of company-specific content does not mean these questions are official, complete, or guaranteed to be asked. To the fullest extent permitted by law, the author, contributors, and publisher are not responsible for outcomes related to use of this material.
Content Accuracy and Verification
To the fullest extent permitted by applicable law, we do not represent or warrant that interview guides, questions, answers, examples, or diagrams are accurate, complete, current, error-free, or suitable for any particular purpose. You are responsible for independently reviewing and verifying the information before relying on it.
Questions or comments?
Contact us for general questions, or share feedback, technical corrections, and comments with the community.
1. What does the future of retail look like?Data AnalysisMediumTarget
Short Interview Answer (30-60 seconds)
I think the future of retail will be increasingly connected across physical stores, digital channels, fulfillment, and customer service. I would not treat that as a single prediction, though. I would analyze how customer behavior, channel usage, conversion, retention, revenue, fulfillment preferences, and operating economics are changing over time and across meaningful segments. I would then separate trends we can observe from causes we can prove and from future scenarios we are forecasting. The goal is to identify which changes are durable enough to justify investment and define KPIs that show whether those investments improve customer experience and business performance.
Detailed Explanation
The question is really asking how I would form a defensible view of where retail is going, rather than simply list technology trends. I would begin with the business decisions the outlook needs to support, such as where to invest, which customer experiences to improve, or which operating capabilities may become more important. Then I would use historical and current data to study customer behavior, channels, revenue, conversion, retention, and fulfillment patterns. I would separate measured trends from possible explanations and forecasts, because a useful retail outlook should show both what the evidence supports and what remains uncertain.
Useful Questions to Ask the Interviewer
What decision should this analysis support: customer experience, channel investment, store strategy, fulfillment, merchandising, or another area?
What time horizon do we mean by the future: the next year, several years, or a longer strategic horizon?
Which customer populations, markets, product categories, or channels are in scope?
Which outcomes matter most, such as revenue, conversion, retention, profitability, customer satisfaction, or fulfillment performance?
What historical data and external context are available, and are there known changes in measurement or instrumentation?
Should the final output be an evidence-based trend assessment, a forecast, or a set of strategic scenarios?
How to Explain It in an Interview
I would start with the decision, because "the future of retail" is too broad to analyze without knowing what action the business may take. For example, a decision about store investment requires different evidence from a decision about fulfillment or digital experience.
Next, I would define the population, unit of analysis, time window, comparison baseline, and KPIs before looking for patterns. A KPI is a clearly defined measure tied to the decision. For a conversion rate, for example, I would specify exactly what counts as a conversion and exactly which eligible visits or customers form the denominator. I would do the same for retention, revenue, order frequency, or other measures that are actually relevant. This prevents changes in definitions from being mistaken for changes in customer behavior.
I would then use descriptive analysis to establish what has happened. Descriptive analysis summarizes observed patterns without claiming why they happened. I would examine time-series trends and compare meaningful dimensions such as channel, customer segment, geography, product category, or fulfillment method when those dimensions exist in the available data. Segmentation analysis is useful because an overall average can hide very different behavior among groups.
Where customer journeys are measurable, I could use funnel analysis to see where customers progress or drop out between defined stages. Where repeat behavior matters, cohort analysis could compare groups that started at different times and show whether retention or purchasing patterns are changing. These methods are useful only when the underlying events, populations, denominators, and time windows are consistently defined.
After describing the patterns, I would move to diagnostic analysis, which asks what may explain the changes. I would drill down across relevant dimensions and examine whether changes line up with factors such as channel mix, customer mix, product mix, availability, fulfillment experience, promotions, or other variables actually present in the data. I would avoid saying that one factor caused another simply because they moved together. Correlation can identify a useful hypothesis, but causal claims require stronger evidence, such as a controlled experiment or another credible causal design.
For the forward-looking part, I would distinguish prediction from observation. Predictive analysis estimates what may happen under stated assumptions. I could build forecasts or scenarios from historical patterns if the data supports them, but I would show uncertainty rather than present one forecast as guaranteed. Structural changes, unusual periods, new competitive conditions, policy changes, or shifts in customer behavior can make historical patterns less reliable.
I would organize the outlook around a few evidence-supported themes rather than a long list of buzzwords. Depending on what the data shows, themes might include the relationship between physical and digital shopping, changing fulfillment expectations, greater use of personalization and automation, evolving store roles, or the growing importance of reliable customer data. I would present these as hypotheses to test unless the supplied evidence actually demonstrates them.
Business checks are critical before trusting the result. I would verify data freshness, missing periods, duplicate records, outliers, changes in instrumentation, and whether definitions stayed consistent over time. I would reconcile important totals against an independent source when possible and repeat key calculations at different aggregation levels. I would also check whether sparse segments, unusual periods, or denominator changes are driving the conclusion.
Finally, I would turn the analysis into a proportional recommendation. Prescriptive analysis means deciding what action makes sense given the evidence, expected benefit, uncertainty, cost, and risk. Instead of saying the retailer should make a large investment because a trend looks promising, I might recommend testing a specific capability with a defined customer population and measuring agreed KPIs against a baseline. The recommendation should include what evidence would make us continue, change, or stop the investment.
My conclusion would therefore be that retail is likely to become more integrated across customer touchpoints and increasingly data-informed, but I would not treat that statement alone as sufficient evidence for a business decision. I would identify which changes are measurable in the relevant business, determine which appear durable, quantify uncertainty, and connect each recommendation to a KPI and a measurement plan.
Technical Approach
Clarify the business decision and the time horizon meant by the future of retail.
Define the population, unit of analysis, reporting window, comparison baseline, and relevant KPIs.
Validate data freshness, completeness, duplicates, instrumentation changes, outliers, and metric definitions.
Perform descriptive trend analysis to establish what has changed over time.
Compare relevant customer, channel, product, geographic, or fulfillment segments when supported by the data.
Use funnel or cohort analysis only where the required journey or repeat-behavior data exists.
Drill down diagnostically to identify plausible explanations while separating correlation from causal evidence.
Build forecasts or scenarios only when the data and assumptions support predictive analysis, and communicate uncertainty.
Translate supported findings into proportional strategic options rather than unsupported predictions.
Define a measurement plan with baselines, KPIs, validation checks, and evidence that would cause the recommendation to be revised.
Practical Insights
The main cost is usually not one calculation but the breadth of the analysis. More years, customers, transactions, channels, products, and segments increase data-processing and validation work. Very detailed segmentation can reveal important differences but can also create small, noisy groups. Forecasting adds modeling and monitoring cost and becomes less reliable when past behavior is not representative of the future. A simpler, interpretable analysis is often preferable for strategic discussion unless a more complex model provides enough additional decision value to justify its cost and uncertainty.
Why Interviewers Ask This
The interviewer is testing whether the candidate can turn a broad strategic question into a structured, evidence-based analysis, distinguish observed trends from assumptions, define meaningful retail KPIs and segments, and connect findings to decisions without making unsupported predictions.
Common interview mistakes
Common mistakes are answering with a list of fashionable technologies instead of a business analysis; making unsupported claims about what customers will do; using KPIs without defining their population, numerator, denominator, or time window; treating company-wide averages as representative of every segment; confusing correlation with causation; ignoring changes in data collection or metric definitions; forecasting from unusual historical periods without testing sensitivity; and giving a major investment recommendation without defining how its impact would be measured.
Interview tip
Structure the answer as decision, evidence, interpretation, uncertainty, and action. Give a few plausible retail themes, but label them as hypotheses until data supports them. Emphasize that a Data Analyst should measure which trends matter for the specific business rather than confidently predict the future from intuition alone.
Interviewer may ask next
How would you determine whether an increase in digital sales represents a lasting change in customer behavior rather than a temporary shift?
I would first define digital sales and the eligible customer population consistently across the full period. Then I would analyze the trend over multiple comparable periods and segment it by customer cohort, product category, geography, and other relevant dimensions supported by the data. I would check whether repeat customers continue using the digital channel, whether newly acquired cohorts retain that behavior, and whether measurement or channel definitions changed. I would also examine alternative explanations such as temporary availability or operational changes. A sustained pattern across periods and cohorts would provide stronger evidence of a durable shift, but it still would not prove a specific cause without stronger causal evidence.
What would you do if leadership wanted a five-year retail forecast but recent historical data had been highly unstable?
I would avoid presenting a single precise five-year forecast as if it were reliable. I would identify which variables are relatively stable, document structural breaks or unusual periods, and test how sensitive forecasts are to different historical windows and assumptions. I would likely present multiple scenarios with clearly stated assumptions and ranges rather than one deterministic outcome. I would explain which indicators should be monitored as reality develops and define points at which the forecast should be revised. That trades some apparent precision for a more honest and decision-useful representation of uncertainty.
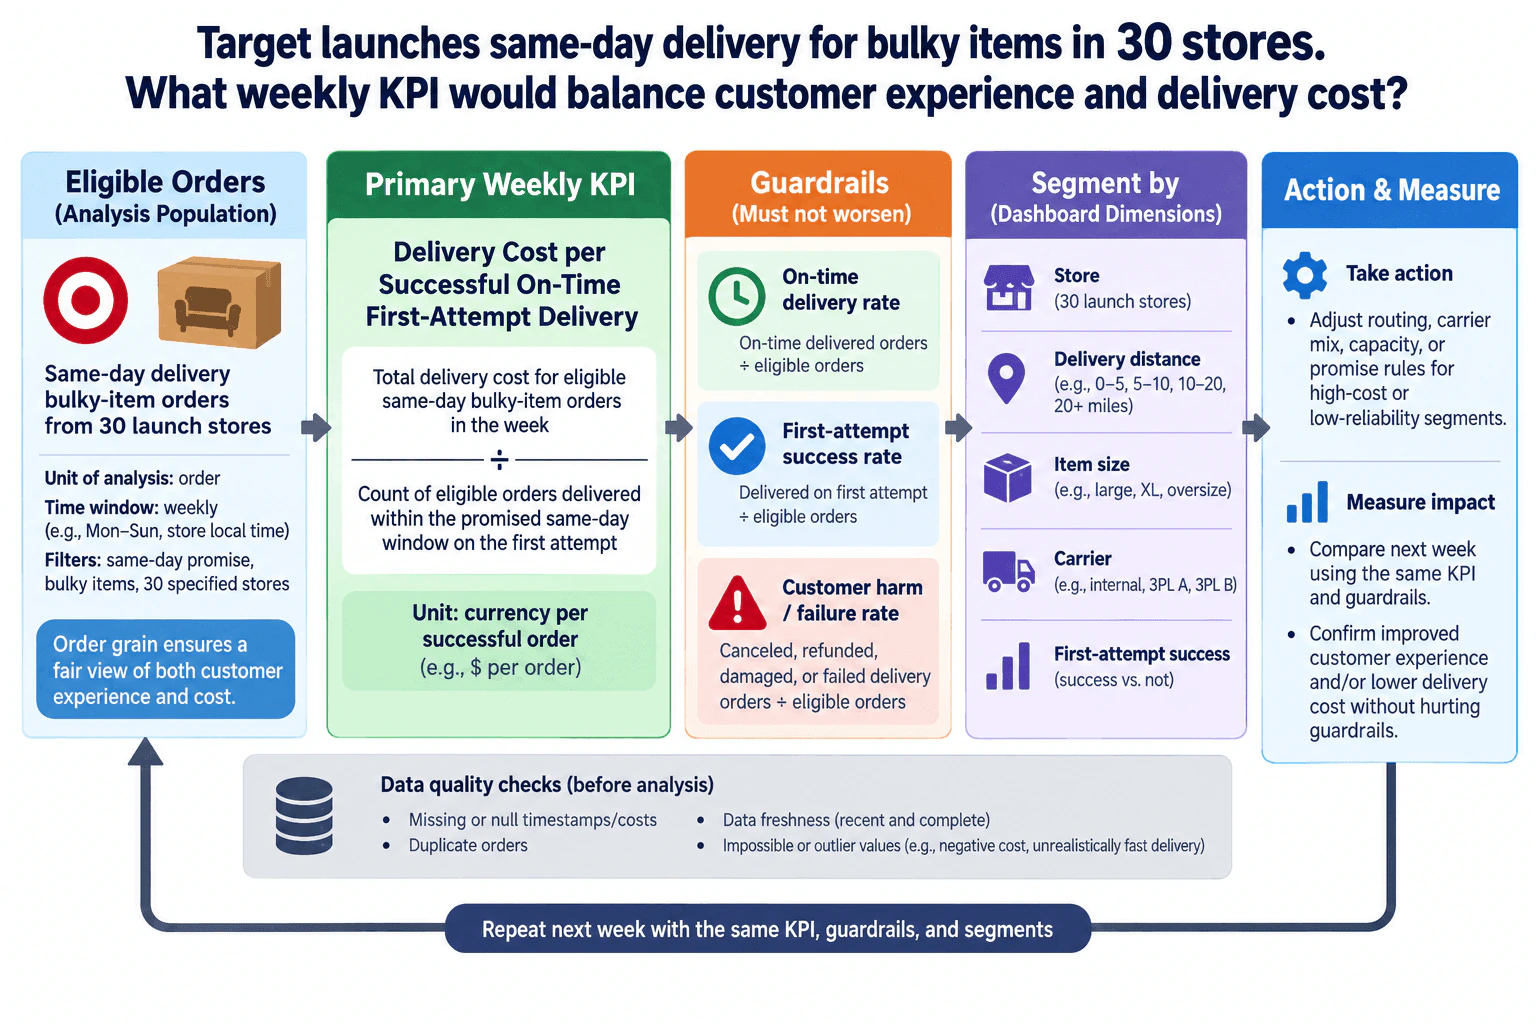
2. Target launches same-day delivery for bulky items in 30 stores. What weekly KPI would balance customer experience and delivery cost?Data AnalysisEasyTarget
i Question Details
Define the KPI at order grain, name necessary guardrails, and identify dashboard segments such as store, distance, item size, carrier, and first-attempt success.
Short Interview Answer (30-60 seconds)
I would use weekly delivery cost per successful on-time first-attempt delivery. The numerator is total delivery cost for eligible same-day bulky-item orders, and the denominator is the number of eligible orders delivered within the promised same-day window on the first attempt. I would protect that KPI with on-time delivery rate, first-attempt success rate, and a customer harm or failure rate. Then I would break the results down by store, distance, item size, carrier, and first-attempt success to find where cost or reliability is driving the result.
Detailed Explanation
The goal is to measure whether the bulky-item delivery launch is becoming more efficient without making the customer experience worse. I would calculate one primary KPI each week at order grain: delivery cost per successful on-time first-attempt delivery. This rewards lower cost only when customers actually receive their orders within the promised same-day window on the first attempt. I would then protect the KPI with service guardrails, check data quality, and segment results across operational dimensions so a good overall average cannot hide expensive stores, difficult routes, or unreliable carriers.
Useful Questions to Ask the Interviewer
What exactly makes an order eligible for this launch: same-day promise, bulky-item classification, and one of the 30 stores?
What is the official promised-delivery timestamp or window, and which time zone defines the reporting week for each store?
Which cost components belong in delivery cost, and are they captured consistently for every eligible order?
Can canceled, refunded, damaged, and failed-delivery outcomes overlap on the same order, or should the customer-harm guardrail count each affected order only once?
Is there a pre-launch baseline or another comparable delivery population that should be shown beside the weekly trend?
How to Explain It in an Interview
Start with the business decision: Target needs to know whether same-day bulky-item delivery can become less expensive while maintaining reliable customer service.
Define the population before calculating anything. Include only eligible same-day bulky-item orders from the 30 launch stores for the selected week. Keep one analytical row per order. Use one agreed weekly boundary and time-zone rule consistently; for example, Monday through Sunday in each store's local time if that is the business convention.
The primary weekly KPI is:
Delivery cost per successful on-time first-attempt delivery = total delivery cost for all eligible same-day bulky-item orders in the week / count of eligible orders delivered within the promised same-day window on the first attempt.
The unit is currency per successful order. This connects the two sides of the business problem. Lower delivery cost helps, but the denominator increases only when an eligible order is successfully delivered on time and on the first attempt. A lower KPI is therefore desirable only when the underlying service measures remain healthy.
I would pair it with three guardrails. On-time delivery rate is the number of eligible orders delivered within the promised window divided by all eligible orders. First-attempt success rate is the number of eligible orders delivered successfully on the first attempt divided by all eligible orders. Customer harm or failure rate is the number of distinct eligible orders with at least one defined harmful outcome, such as cancellation, refund, damage, or failed delivery, divided by all eligible orders. If those flags overlap, count each affected order once in that guardrail so the rate is not inflated by double-counting the same order.
Next, use segmentation analysis, meaning calculate the same KPI and guardrails for meaningful groups rather than relying only on the overall average. The dashboard should support drill-down by store, delivery-distance band, item size, carrier, and first-attempt success. This can show whether a weekly cost or reliability problem is concentrated in a particular store, distance band, item-size group, or carrier. Those are descriptive and diagnostic findings; they identify where a pattern occurs but do not prove that the segment itself caused the outcome.
Before interpreting the numbers, validate the data. Check missing or null delivery timestamps and costs, duplicate orders, stale or incomplete records, and impossible or suspicious outliers such as negative delivery cost or an implausibly fast delivery. Reconcile the eligible-order count to a trusted control total when one exists, and verify that the numerator, denominator, guardrails, and dashboard segments all use the same eligibility and reporting-week rules.
Trend the KPI and guardrails week over week using unchanged definitions. If a prior period or pre-launch baseline is available and genuinely comparable, show it as context rather than inventing a target. Treat sparse segments carefully because a small number of orders can create unstable weekly rates or cost-per-success values.
The recommendation should depend on the segment evidence. For high-cost or low-reliability segments, investigate operational levers such as routing, carrier mix, capacity, or promise rules. Do not claim those changes caused an improvement unless they are evaluated appropriately. After an action, measure the next week using the same KPI, guardrails, population, and segments. I would call the change successful only when delivery cost per successful on-time first-attempt delivery improves without a material deterioration in on-time delivery, first-attempt success, or customer-harm outcomes.
Technical Approach
Define the eligible population as same-day bulky-item orders from the 30 launch stores for the selected week.
Preserve one row per order and identify the promised delivery window, actual delivery outcome, first-attempt outcome, delivery cost, store, distance, item size, and carrier.
Validate missing values, duplicate orders, data freshness, impossible values, and outliers.
Sum delivery cost across all eligible orders and count eligible orders delivered within the promise window on the first attempt.
Compute delivery cost per successful on-time first-attempt delivery.
Calculate on-time delivery rate, first-attempt success rate, and distinct-order customer harm/failure rate as guardrails.
Recalculate the KPI and guardrails by store, distance, item size, carrier, and first-attempt success.
Compare weekly trends and any valid baseline without interpreting correlation as causation.
Investigate high-cost or low-reliability segments and select a proportional operational action.
Measure the following week using unchanged definitions and guardrails.
Practical Insights
The arithmetic is simple because each eligible order is processed once and then aggregated. The harder tradeoff is metric design: optimizing cost alone could encourage slower or less reliable service, while optimizing service alone could ignore unsustainable delivery cost. The combined KPI makes successful customer outcomes part of the cost denominator, and the guardrails prevent an apparently better KPI from masking worse reliability or customer harm. Small segments also need caution because one or two orders can move their weekly rates sharply.
Why Interviewers Ask This
The interviewer is testing whether the candidate can define one decision-useful KPI that balances cost efficiency with successful customer outcomes, preserve the correct order grain and denominator, add guardrails so cost improvement cannot hide service degradation, and design meaningful segmentation for operational diagnosis.
Common interview mistakes
Common mistakes are using cost per eligible order without incorporating delivery success, averaging store-level ratios instead of recomputing the KPI from underlying orders, mixing different eligibility rules between numerator and denominator, excluding failed eligible orders from the cost numerator without a business rule, double-counting overlapping customer-harm outcomes, changing weekly definitions over time, overlooking missing timestamps or costs, treating tiny segments as stable, and assuming a carrier or distance segment caused an outcome merely because it is correlated with it.
Interview tip
State the KPI formula first, including population, grain, numerator, denominator, unit, and weekly window. Then name the three guardrails and the requested dashboard segments. Finish by explaining that you would act only on diagnosed segments and judge success the following week using the same definitions.
Interviewer may ask next
What would you do if an order can be canceled, refunded, and marked as a failed delivery at the same time?
For the customer harm/failure guardrail, I would count distinct affected orders rather than summing overlapping event flags. The numerator would be the number of eligible orders with at least one defined harm or failure outcome, and the denominator would remain all eligible orders. I would still keep the individual event flags available for diagnostic drill-down so the team can see whether cancellations, refunds, damage, or failed deliveries are driving the rate.
What if delivery cost falls next week but first-attempt success also falls?
I would not call that a successful improvement. The primary KPI must be interpreted with its guardrails. A lower cost that comes with weaker first-attempt success means the operation may be shifting cost onto the customer experience or creating future reattempt costs. I would segment the change by store, distance, item size, and carrier, identify where reliability deteriorated, and adjust the operational action. The goal is lower cost per successful on-time first-attempt delivery without a material worsening of the service guardrails.
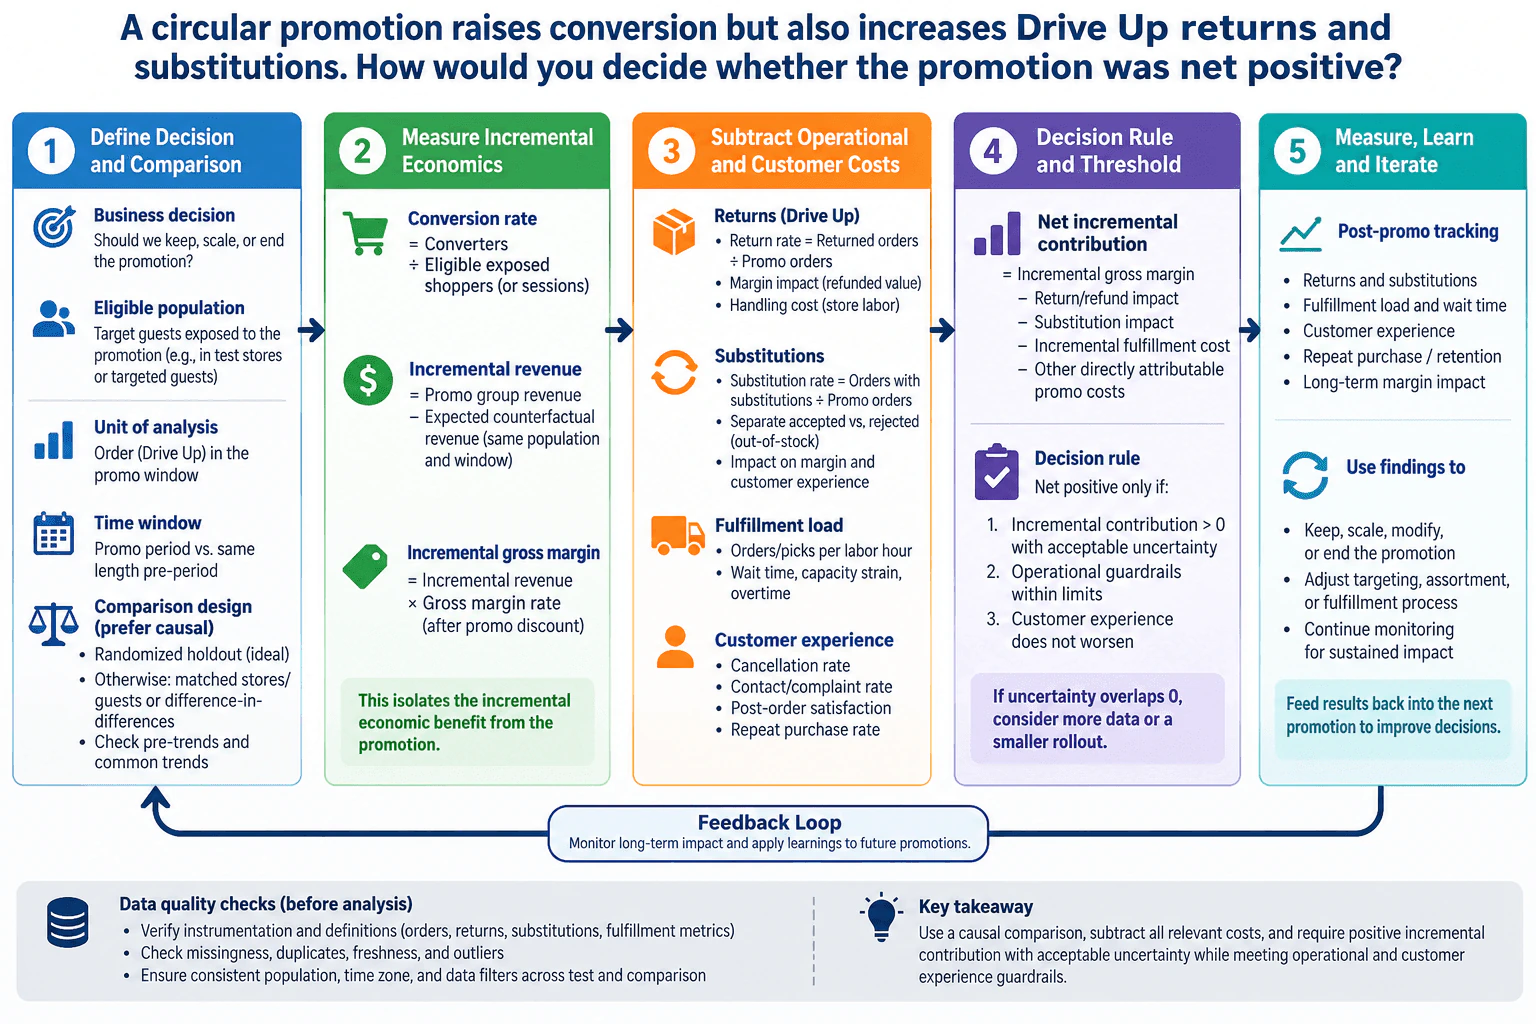
3. A circular promotion raises conversion but also increases Drive Up returns and substitutions. How would you decide whether the promotion was net positive?Data AnalysisMediumTarget
i Question Details
Build a metric framework covering incremental revenue, margin, returns, substitutions, fulfillment load, customer experience, comparison design, and decision thresholds.
Short Interview Answer (30-60 seconds)
I would not call the promotion successful just because conversion increased. I would define the eligible Drive Up population and order-level grain, compare promoted performance with a credible counterfactual, ideally a randomized holdout, and estimate incremental revenue and gross margin. Then I would subtract return and refund impact, substitution impact, incremental fulfillment cost, and other attributable promotion costs. I would scale only if incremental contribution is positive with acceptable uncertainty, operating guardrails remain within limits, and customer experience does not worsen. Otherwise I would modify, test further, or end the promotion.
Detailed Explanation
The task is to decide whether the promotion created more value than it destroyed. Higher conversion is only one part of the answer. I would compare the promoted population with a credible counterfactual, calculate incremental revenue and gross margin, and then subtract the economic effects of Drive Up returns, substitutions, extra fulfillment work, and other directly attributable promotion costs. I would also check customer experience and operating capacity. The promotion is net positive only when incremental contribution is above zero with acceptable uncertainty, operational guardrails remain within limits, and customer experience does not worsen.
Useful Questions to Ask the Interviewer
What decision will this analysis support: keep, scale, modify, or end the promotion?
Who is eligible for the promotion, and can we identify the guests, stores, or orders actually exposed?
Is a randomized holdout available, or do we need a matched comparison group?
Should the analysis grain be a Drive Up order, guest, store, or another level?
What promotion window, same-length comparison window, and time zone should be used consistently?
How are revenue, gross margin, returns, substitutions, fulfillment load, wait time, complaints, satisfaction, and repeat purchase defined?
What operational or customer-experience thresholds would make the promotion unacceptable even if contribution is positive?
Are there known instrumentation gaps, delayed returns, duplicate orders, missing fulfillment records, or freshness issues?
How to Explain It in an Interview
I would explain the analysis as the same five-step flow shown in the diagram.
1. Define the decision and comparison
Start with the business decision: keep, scale, modify, or end the promotion. Define the eligible population as the guests, stores, or orders exposed to the promotion, and keep the unit of analysis consistent. If the analysis is order-level, each observation should represent a Drive Up order in the promotion window.
Use a comparison that estimates what would have happened without the promotion. A randomized holdout is the preferred causal design when it is feasible. If randomization is not available, use a credible matched comparison, such as comparable stores or guests, and a difference-in-differences design when its assumptions are reasonable. Check pre-promotion trends and common-trend plausibility before interpreting the estimate as causal. A simple before-versus-after comparison is weaker because seasonality, traffic, assortment, inventory, or other simultaneous changes can move the metrics.
2. Measure incremental economics
Define every KPI before interpreting it. Conversion rate should use the same eligible population and denominator for promoted and comparison groups; for example, converters divided by eligible exposed shoppers or sessions.
Incremental revenue is observed promotion-group revenue minus the expected counterfactual revenue for the same population and time window. That prevents all promoted revenue from being mislabeled as incremental.
Incremental gross margin should reflect the margin on the incremental sales after the promotion discount. If product mix changes materially, item- or category-level margin is preferable to applying one blended rate to all incremental revenue.
3. Subtract operational and customer costs
For Drive Up returns, define return rate as returned orders divided by promotion orders. Estimate the return or refund impact and any directly attributable handling cost, such as store labor. Because returns may occur after the promotion window, test whether delayed returns change the conclusion.
For substitutions, define substitution rate as orders containing substitutions divided by promotion orders. Separate accepted substitutions from rejected substitutions and out-of-stock cases because they can have different effects on revenue, margin, and customer experience. Do not assume every substitution is a loss; measure the actual economic effect relative to the original item or expected order outcome.
Measure fulfillment load with metrics such as orders or picks per labor hour, wait time, capacity strain, and overtime where attributable. Extra demand is not automatically good if the operating system cannot absorb it efficiently.
Use customer-experience measures such as cancellation rate, contact or complaint rate, post-order satisfaction, and repeat-purchase behavior. These are guardrails because a contribution-positive promotion can still be unattractive if it materially damages the customer experience.
Estimate uncertainty with a method appropriate to the design, such as confidence intervals, statistical tests, or resampling. A positive point estimate is not enough if the plausible range includes zero or the result is highly sensitive to reasonable assumptions.
The decision rule is: continue or scale only when incremental contribution is above zero with acceptable uncertainty, operational guardrails remain within agreed limits, and customer experience does not worsen. If uncertainty overlaps zero, gather more data or use a smaller rollout. If economics are positive only for certain stores, categories, guest segments, or fulfillment conditions, modify or target the promotion rather than scaling universally. If contribution is negative or guardrails fail, end or redesign it.
5. Validate, monitor, and feed results back
Before trusting the result, verify instrumentation and metric definitions, reconcile control totals, check missingness, duplicates, freshness, and outliers, and confirm that promoted and comparison groups use the same population rules, time zone, filters, and window. Check whether one segment or extreme observation is driving the aggregate result.
After the decision, continue tracking returns and substitutions, fulfillment load and wait time, customer experience, repeat purchase or retention, and longer-term margin. Feed those findings into the next promotion design. This keeps the conclusion proportional to the evidence: conversion shows one benefit, while incremental contribution plus operational and customer guardrails determines whether the promotion was truly net positive.
Technical Approach
Define the decision: keep, scale, modify, or end the promotion.
Define the eligible population, order-level grain, promotion window, same-length comparison window, time zone, and consistent metric denominators.
Choose a comparison design: randomized holdout when feasible; otherwise use a credible matched comparison and difference-in-differences with pre-trend checks.
Calculate conversion rate, incremental revenue, and incremental gross margin relative to the counterfactual.
Measure returns, substitutions, fulfillment load, and customer-experience outcomes with consistent definitions.
Convert relevant negative effects into attributable economic impacts without assuming every return or substitution has the same cost.
Calculate net incremental contribution by subtracting return/refund impact, substitution impact, incremental fulfillment cost, and other directly attributable promotion costs from incremental gross margin.
Quantify uncertainty and run sensitivity checks for reasonable assumptions, delayed returns, and meaningful segments.
Apply the decision threshold: positive contribution with acceptable uncertainty, operations within limits, and no material customer-experience deterioration.
Continue post-promotion monitoring and use the findings to refine future promotions.
Practical Insights
The arithmetic is straightforward; the difficult part is building a fair counterfactual and keeping every benefit and cost on the same population, grain, and time window. A randomized holdout is easier to interpret but may be harder to operate. A matched difference-in-differences design can use observational data but depends more on comparison quality and credible pre-trends. More detailed item, labor, return, and customer-experience data can improve accuracy but requires more reconciliation work. Waiting for delayed returns or repeat-purchase outcomes improves completeness but slows the decision. The tradeoff is speed versus confidence: decide quickly enough to be useful without overstating uncertain evidence.
Why Interviewers Ask This
The interviewer is testing whether I can look beyond a headline conversion lift and make a defensible business decision using causal comparison, incremental economics, downstream costs, operational constraints, customer experience, uncertainty, and explicit decision thresholds.
Common interview mistakes
Common mistakes are declaring success from conversion alone; treating all promoted revenue as incremental; using a simple pre/post comparison without considering other changes; changing denominators between groups; ignoring promotion discounts when calculating margin; assuming every substitution is automatically negative; ignoring return handling and fulfillment labor; mixing populations, time windows, or time zones; failing to allow for delayed returns; overlooking missing or duplicate records; letting an aggregate average hide harmful segments; treating correlation as causal evidence; and scaling when the point estimate is positive but uncertainty, capacity, or customer-experience guardrails are unacceptable.
Interview tip
Lead with the decision rule, not a list of metrics. Say that you would estimate incremental contribution against a credible counterfactual, subtract returns, substitutions, fulfillment, and other attributable costs, then use uncertainty, operational capacity, and customer experience as guardrails. That shows that higher conversion matters only if it creates sustainable incremental value.
Interviewer may ask next
What would you do if you could not run a randomized holdout?
I would build the strongest observational counterfactual available, such as matched stores or guests that were not exposed, and use difference-in-differences when its assumptions are credible. I would compare pre-promotion trends, keep definitions and windows identical, test alternative matched groups or specifications, and avoid claiming stronger causality than the design supports. If pre-trends are poor or the conclusion is highly sensitive to the comparison group, I would recommend a smaller controlled test before scaling.
What if incremental contribution is positive but Drive Up wait times and complaints increase materially?
I would not automatically scale the promotion because operational and customer-experience guardrails are part of the decision rule. I would segment the effect by store, time, category, guest group, or fulfillment conditions to identify where the pressure occurs. Then I would consider a constrained rollout, adjusted targeting, assortment or substitution changes, or added fulfillment capacity only if the economics support it. I would scale only after the modified version remains contribution-positive while wait time, capacity, and customer-experience measures stay within agreed limits.
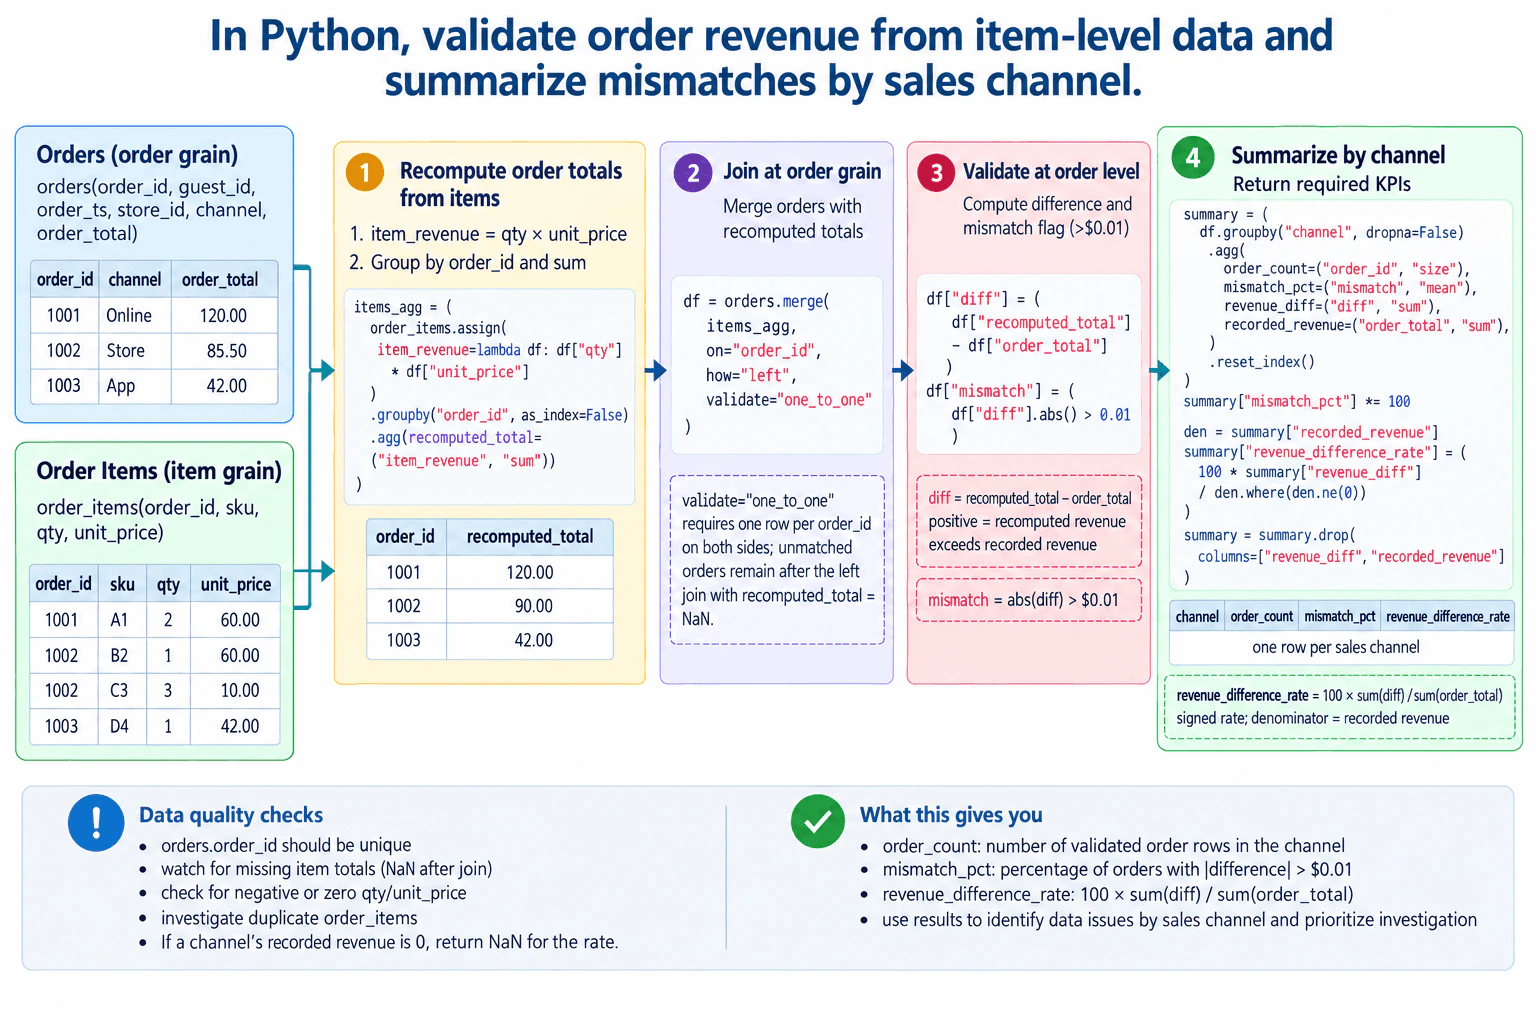
4. In Python, validate order revenue from item-level data and summarize mismatches by sales channel.Data AnalysisMediumTarget
i Question Details
Use pandas DataFrames orders(order_id, guest_id, order_ts, store_id, channel, order_total) and order_items(order_id, sku, qty, unit_price). Recompute each order total, join at order grain, and return order_count, mismatch percentage above $0.01, and revenue difference rate by channel.
Short Interview Answer (30-60 seconds)
I would first compute item revenue as qty times unit_price and sum it by order_id so the item table is at order grain. Then I would left-join it to orders with validate="one_to_one", calculate diff = recomputed_total - order_total, and flag abs(diff) > 0.01. Finally, I would group by channel to return order_count, mismatch percentage, and 100 times total signed difference divided by recorded order revenue. I would also check duplicate order IDs, missing item totals, invalid inputs, and zero denominators before trusting the summary.
The goal is to check whether recorded order revenue agrees with revenue rebuilt from item-level data, then show where mismatches occur by sales channel. The key is to compare values at the same grain. order_items may contain several rows per order, so first calculate qty times unit_price and sum those values to one row per order_id. Join that result to orders, compare recomputed and recorded totals, flag differences greater than $0.01, and then calculate the requested channel-level KPIs. Missing matches and invalid inputs must remain visible as data-quality issues.
Useful Questions to Ask the Interviewer
Should an order with no matching item rows fail the validation, be reported separately, or be excluded from the channel KPIs?
Should refunds, returns, or negative order totals remain in the recorded-revenue denominator?
Should missing channel values be retained as their own group, and are any order statuses outside the eligible population?
How to Explain It in an Interview
Start with the business task: reconcile recorded order revenue against revenue rebuilt from the item table and summarize the resulting data-quality signal by sales channel.
The inputs have different grains. orders is expected to have one row per order_id, while order_items can have several rows for the same order. A direct join before aggregation would duplicate order-level values, so first calculate item_revenue = qty * unit_price and group order_items by order_id to produce recomputed_total.
Before merging, verify that orders.order_id is unique. The aggregated item table should also have one row per order_id by construction. Then perform a left join from orders to the recomputed totals and use validate="one_to_one". The left join keeps every recorded order. If an order has no item total, recomputed_total remains NaN instead of being silently converted to zero. That missing value is a data-quality failure that should be investigated or handled according to an agreed business rule before publishing the KPIs.
For orders that pass the required data-quality checks, calculate the signed difference:
diff = recomputed_total - order_total
A positive diff means recomputed item revenue exceeds recorded revenue. A negative diff means recorded revenue is higher.
Then define the mismatch flag exactly as:
mismatch = abs(diff) > 0.01
The wording says above $0.01, so a difference of exactly $0.01 is not a mismatch.
Next, group the validated order-level rows by channel and calculate three requested metrics. order_count is the number of order rows in the channel. mismatch_pct is 100 times the mean of the Boolean mismatch flag. revenue_difference_rate is:
100 * sum(diff) / sum(order_total)
The denominator is recorded revenue, matching the diagram. This rate is signed, so positive and negative order differences can offset each other. For that reason, interpret it together with mismatch_pct. If a channel's recorded revenue sums to zero, return NaN for revenue_difference_rate rather than divide by zero.
Data-quality checks matter because otherwise the reconciliation can look better or worse than it really is. Check duplicate order IDs, missing order IDs, missing qty or unit_price values, missing recorded totals, unmatched orders, and quantities or prices that violate the business rules. Repeated item rows are not automatically duplicates because an order can legitimately contain multiple item records.
For validation, confirm that the left join does not change the number of order rows, inspect all unmatched orders, manually reproduce several item totals, and verify that channel-level revenue_diff values reconcile to the overall signed difference. If money is stored as binary floating-point values, also consider the source system's currency precision; integer cents or decimal arithmetic can be preferable when exact financial reconciliation is required.
The final output is one row per sales channel containing channel, order_count, mismatch_pct, and revenue_difference_rate. Do not invent numeric channel results when the actual DataFrames are not supplied.
Key Insight / Why This Solution Works
Validate required identifiers and recorded totals, especially uniqueness of orders.order_id.
Compute item_revenue = qty * unit_price for every item row.
Group order_items by order_id and sum item_revenue into recomputed_total.
Left-join the order-level totals to orders on order_id with validate="one_to_one".
Keep unmatched orders visible as recomputed_total = NaN and treat them as explicit data-quality failures rather than zero revenue.
For validated rows, compute diff = recomputed_total - order_total.
Compute mismatch = abs(diff) > 0.01.
Group by channel with missing channel values retained if they are in scope.
Calculate order_count, mismatch_pct, revenue_diff, and recorded_revenue.
Calculate revenue_difference_rate = 100 * revenue_diff / recorded_revenue, returning NaN when recorded_revenue is zero.
Return channel, order_count, mismatch_pct, and revenue_difference_rate and reconcile the grouped totals back to the order-level data.
This tests whether the candidate can preserve data grain, reconcile recorded revenue with item-level detail, use pandas aggregation and joins safely, define KPI numerators and denominators correctly, handle missing and duplicate data, and turn row-level validation into an interpretable channel-level summary.
Common interview mistakes
Common mistakes are joining item rows directly to orders before aggregating to order grain; using an inner join and silently dropping orders with no item rows; allowing duplicate order_id values in orders to multiply records; filling missing recomputed totals with zero; using >= 0.01 when the requirement says above $0.01; losing the sign of diff before calculating revenue_difference_rate; using recomputed revenue instead of recorded order_total as the denominator; dividing by zero for a channel with no recorded revenue; and inventing channel results when the real DataFrames are unavailable.
Interview tip
Lead with the grain and KPI definitions before the pandas syntax: aggregate items to one row per order, validate the left join, define the signed difference and strict tolerance, then summarize by channel using the recorded-revenue denominator and explicit data-quality checks.
Interviewer may ask next
How would you handle orders that exist in orders but have no matching rows in order_items?
I would keep them visible through the left join so recomputed_total is NaN, then treat them as a separate data-quality failure rather than replacing the missing value with zero. Before publishing the requested KPIs, I would either stop the validation, report the unmatched orders separately, or apply an explicit business rule for exclusion. The important point is that missing item data must not silently become a successful revenue match.
What tradeoff comes from using the signed revenue_difference_rate rather than an absolute difference rate?
The signed rate keeps direction, so it shows whether recomputed revenue is net above or below recorded revenue. Its limitation is cancellation: positive and negative order differences can offset each other. That is why it should be interpreted together with mismatch_pct. If the business also needs total error magnitude, I could add a separate metric such as 100 * sum(abs(diff)) / sum(order_total), but I would not replace the requested signed rate without agreement.
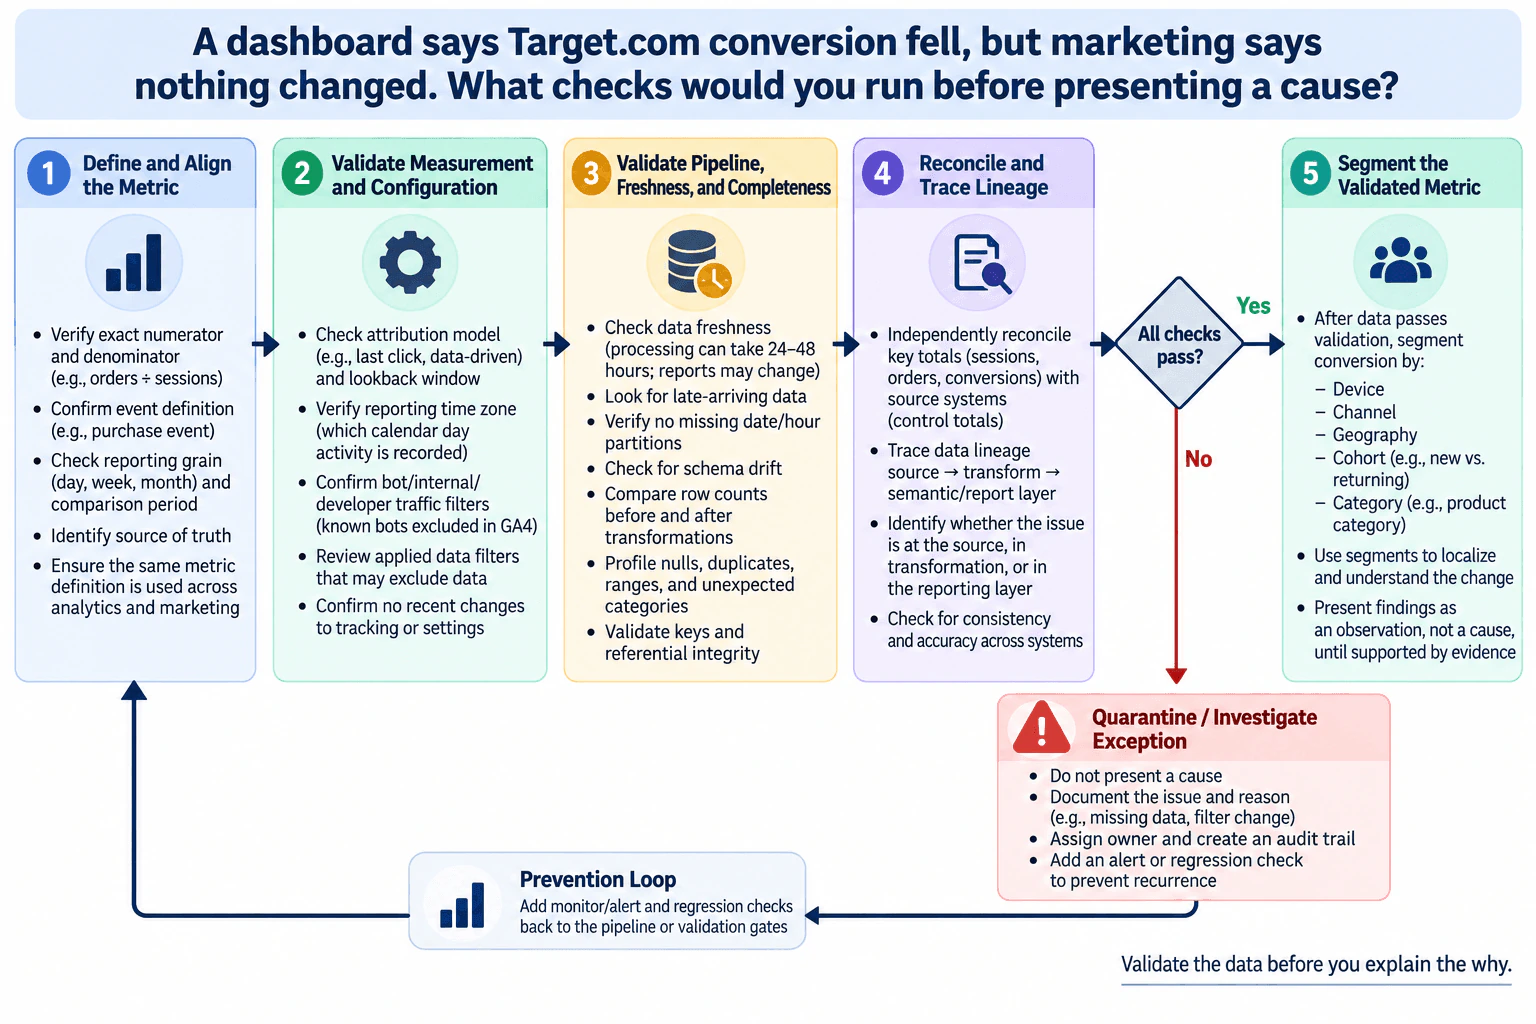
5. A dashboard says Target.com conversion fell, but marketing says nothing changed. What checks would you run before presenting a cause?Data Quality And ValidationMediumTarget
i Question Details
Validate definitions, attribution windows, bot filters, time zones, freshness, missing partitions, and independent totals; then segment by device, channel, geography, cohort, and category.
Short Interview Answer (30-60 seconds)
Before presenting a cause, I would first prove that the conversion decline is real. I would confirm the metric definition, numerator and denominator, purchase event, reporting grain, comparison period, attribution window, time zone, bot and internal-traffic filters, other filters, and tracking settings. Then I would check freshness, late data, missing partitions, schema drift, row counts, nulls, duplicates, ranges, keys, and referential integrity. I would reconcile sessions, orders, and conversions to independent source totals and trace lineage. Only if those checks pass would I segment by device, channel, geography, cohort, and category. If a validation check fails, I would stop the causal explanation, document the exception, assign an owner, and revalidate after correction.
Detailed Explanation
The main task is to decide whether the reported conversion drop is a trustworthy observation before explaining why it happened. A dashboard can change because the business changed, but it can also change because a metric definition, filter, attribution rule, time zone, source feed, transformation, or reporting layer changed. I would therefore validate the metric from source to report, reconcile independent totals, and trace its lineage. If those checks pass, I would segment the validated metric to locate the change. If they fail, I would stop, document the exception, and avoid presenting a cause.
Useful Questions to Ask the Interviewer
What exact numerator and denominator define conversion in this dashboard?
What purchase event, reporting grain, and comparison period are being used?
Which system is the source of truth for sessions, orders, and completed purchases?
What attribution model and lookback window are expected for this metric?
Which reporting time zone, bot or internal/developer-traffic filters, and other data filters are applied?
Were any tracking, event-definition, transformation, schema, or reporting settings recently changed?
How fresh is the dashboard data, and can records arrive late?
Are there independent control totals that I can reconcile against the dashboard?
How to Explain It in an Interview
I would work from the metric definition backward to the source and then forward through the reporting pipeline.
First, I would define and align the metric. I would confirm the exact numerator and denominator, the purchase-event definition, reporting grain, comparison period, and source of truth. This establishes consistency: analytics and marketing must be discussing the same metric before their statements can be compared. I would not assume that terms such as conversion, session, or order have identical definitions across systems.
Second, I would validate measurement and configuration. I would check the attribution model and lookback window, reporting time zone, bot or internal/developer-traffic filtering, other applied data filters, and recent tracking or configuration changes. If GA4 is the analytics source, I would also confirm that its bot-handling and configured traffic filters are understood rather than assuming that every type of internal or developer traffic is automatically removed. A change in any of these settings can alter measured conversion without an underlying business change.
Third, I would validate pipeline completeness and timeliness. Completeness means the expected records are present; timeliness means the data is available when the report claims it is. I would check freshness, late-arriving records, missing date or hour partitions, and schema drift. I would compare row counts before and after transformations to detect unexpected record loss or duplication. I would also perform data profiling: null checks for required fields, duplicate checks where uniqueness is expected, range and category checks for invalid or unexpected values, and key and referential-integrity checks where records should map to valid related entities.
Fourth, I would reconcile the metric independently. Reconciliation means comparing key totals produced by the reporting pipeline with trusted source-system totals at a compatible grain, time window, and scope. I would compare sessions, orders, and conversions against available control totals rather than assuming the dashboard is correct. I would also trace data lineage from the source through transformations to the semantic or reporting layer. That helps distinguish a source defect from a transformation defect or reporting-layer defect.
The important data-quality dimensions here are completeness, accuracy, consistency, validity, uniqueness, and timeliness. Completeness asks whether expected data is present. Accuracy asks whether reported values agree with trustworthy evidence. Consistency asks whether definitions and values agree across systems. Validity asks whether values follow expected business and structural rules. Uniqueness checks that records that should be unique are not duplicated. Timeliness checks whether data is current enough for the reporting period.
After those checks, I would use a decision gate. If the checks do not pass, I would not present a business cause. I would quarantine or clearly isolate the affected records or output with a reason, document the failed rule and known limitation, assess downstream decision impact, assign an owner, and maintain an audit trail. I would never silently drop, overwrite, impute, or repair records without a justified auditable rule. After correction or reprocessing, I would rerun the validation and reconciliation. I would also add an alert, monitor, or regression check so the same failure is detected earlier next time.
If all checks pass, I would segment the validated conversion metric by device, channel, geography, cohort such as new versus returning users, and category. Segmentation helps localize where the decline appears. I would preserve the same metric definition, filters, time window, attribution treatment, denominator, and comparison basis across segments. Sparse, incomplete, or unstable groups would be treated cautiously rather than overinterpreted.
Finally, I would separate observation from interpretation. A segment showing a larger decline tells me where the change is concentrated; it does not by itself prove why it happened. I would present the validated pattern, the checks completed, known data limits, and the next evidence needed before making a causal statement. The prevention loop is equally important: monitoring, regression checks, documented ownership, exception handling, and recovery evidence make future reporting safer.
Technical Approach
Confirm the conversion numerator, denominator, purchase-event definition, reporting grain, comparison period, and source of truth.
Verify that analytics and marketing are using the same metric definition and scope.
Check the attribution model, lookback window, reporting time zone, bot/internal/developer-traffic filters, other applied filters, and recent tracking or configuration changes.
Check data freshness and late-arriving records.
Verify that expected date/hour partitions are present and inspect for schema drift.
Compare row counts before and after transformations.
Profile required data for nulls, duplicates, invalid ranges, and unexpected categories.
Validate keys and referential integrity where relationships require them.
Independently reconcile sessions, orders, and conversions with compatible source-system control totals at the same grain, scope, and time window.
Trace lineage from source through transformations to the semantic/reporting layer and determine whether any discrepancy originates in the source, transformation, or report.
If any validation fails, stop the causal claim, isolate and document the exception, assess downstream impact, assign ownership, retain an audit trail, correct or reprocess under an auditable rule, and rerun validation.
If validation passes, segment conversion by device, channel, geography, cohort, and category using the same definition and comparison basis.
Present segment differences as observations, not causes, until additional evidence supports causality.
Add alerts, monitoring, regression checks, and recovery verification to prevent recurrence.
Practical Insights
The main cost depends on how many reporting periods, partitions, records, transformations, source systems, and segments must be checked. Definition and configuration checks are usually inexpensive. Full reconciliation and data profiling can cost more because they may scan large source and transformed datasets. Segmentation adds grouped calculations but should happen only after the base metric is trusted. The tradeoff is worthwhile: spending more time on validation reduces the much larger risk of giving stakeholders a confident explanation for a measurement or pipeline error.
Why Interviewers Ask This
The interviewer is testing whether I can distinguish a real business change from a measurement or data-quality problem. They want to see disciplined metric validation, reconciliation, source-to-report lineage tracing, safe exception handling, ownership, and evidence-based communication before I make a causal claim.
Common interview mistakes
Common mistakes are jumping directly to marketing or customer-behavior explanations; comparing teams that use different conversion definitions; checking only the dashboard instead of independent source totals; ignoring attribution-window, time-zone, filter, or tracking changes; overlooking stale data, late arrivals, missing partitions, schema drift, nulls, duplicates, or broken keys; reconciling totals at mismatched grains or windows; treating a segment difference as proof of causation; silently repairing or excluding bad records without an auditable rule; and failing to document the exception, owner, downstream impact, and prevention step.
Interview tip
Use a clear sequence: define and align the metric, validate measurement settings, validate pipeline freshness and completeness, reconcile totals and trace lineage, then segment. Explicitly say, "I would not present a cause until the data passes validation." That shows disciplined judgment and keeps the conclusion no stronger than the evidence.
Interviewer may ask next
What would you do if the dashboard total matches the source overall, but one device segment shows a large unexplained drop?
I would keep the validated overall total but investigate the device segment independently. I would confirm that device classification is defined consistently, check whether null or unknown device values changed, compare segment row counts and shares across the same periods, validate filters and joins that create the device dimension, and reconcile the affected segment where an independent source is available. I would also check whether sparse or late-arriving records could distort the subgroup. Until those checks pass, I would describe the device pattern as a localized observation rather than a business cause.
What if a missing partition is discovered, but stakeholders need an answer immediately?
I would not silently fill the gap or present the incomplete dashboard as reliable. I would label the result as affected by a known completeness failure, explain which reporting interval or population is missing, assess which downstream totals and segments could be affected, and quarantine or suppress the unreliable output if that is the safer failure mode. I would assign an owner, restore or reprocess the missing data under an auditable rule, reconcile the recovered totals, and rerun validation before presenting a cause. If an interim view must be discussed, I would clearly separate verified observations from unavailable or uncertain evidence.
6. A new app module shows a 0.6% conversion lift with p = 0.04 after four days of a planned 14-day test. What would you check before declaring a win?Statistics And ExperimentationMediumTarget
i Question Details
Cover randomization, sample-ratio mismatch, pre-period balance, peeking, multiple testing, metric stability, guardrails, practical significance, and the ship-or-wait decision.
Short Interview Answer (30-60 seconds)
I would not call this a win yet. Four days into a planned 14-day test, p = 0.04 can be misleading if this was an unplanned interim look. First I would verify randomization, sample-ratio mismatch, pre-period balance, sample size, data quality, and metric stability. Then I would check peeking and multiple testing, report an appropriate confidence interval around the 0.6% lift, review guardrails, and ask whether the effect is large enough to matter. If the experiment uses a fixed-horizon design, I would normally wait for the planned stopping point; if it uses a valid pre-specified sequential method, I would follow that rule instead.
Detailed Explanation
The key question is not simply whether p = 0.04 is below a familiar threshold. It is whether the experiment is valid and the result is reliable, meaningful, and safe enough to support a product decision. The test has run only four days of a planned 14-day period, so I would first check assignment and data quality, then whether early peeking or multiple testing changed the false-positive risk. I would examine uncertainty around the 0.6% lift, metric stability, guardrails, and business value before deciding whether to ship or keep collecting data.
Useful Questions to Ask the Interviewer
Was the 14-day duration and stopping rule specified before the experiment started?
Is the reported 0.6% lift relative or absolute, and what is the control conversion rate?
What is the unit of randomization and the unit used to calculate conversion?
What treatment-control allocation was intended, and do observed sample counts match it?
Were the primary metric, guardrails, variants, segments, and hypothesis tests pre-specified?
Has anyone checked the result before day 4, or is this the first interim analysis?
What minimum detectable effect, power target, and sample size were planned?
Which guardrail metrics could block launch even if conversion improves?
Are there known tracking changes, outages, campaigns, seasonality effects, or population shifts during the test?
What size of conversion improvement is large enough to justify shipping the module?
How to Explain It in an Interview
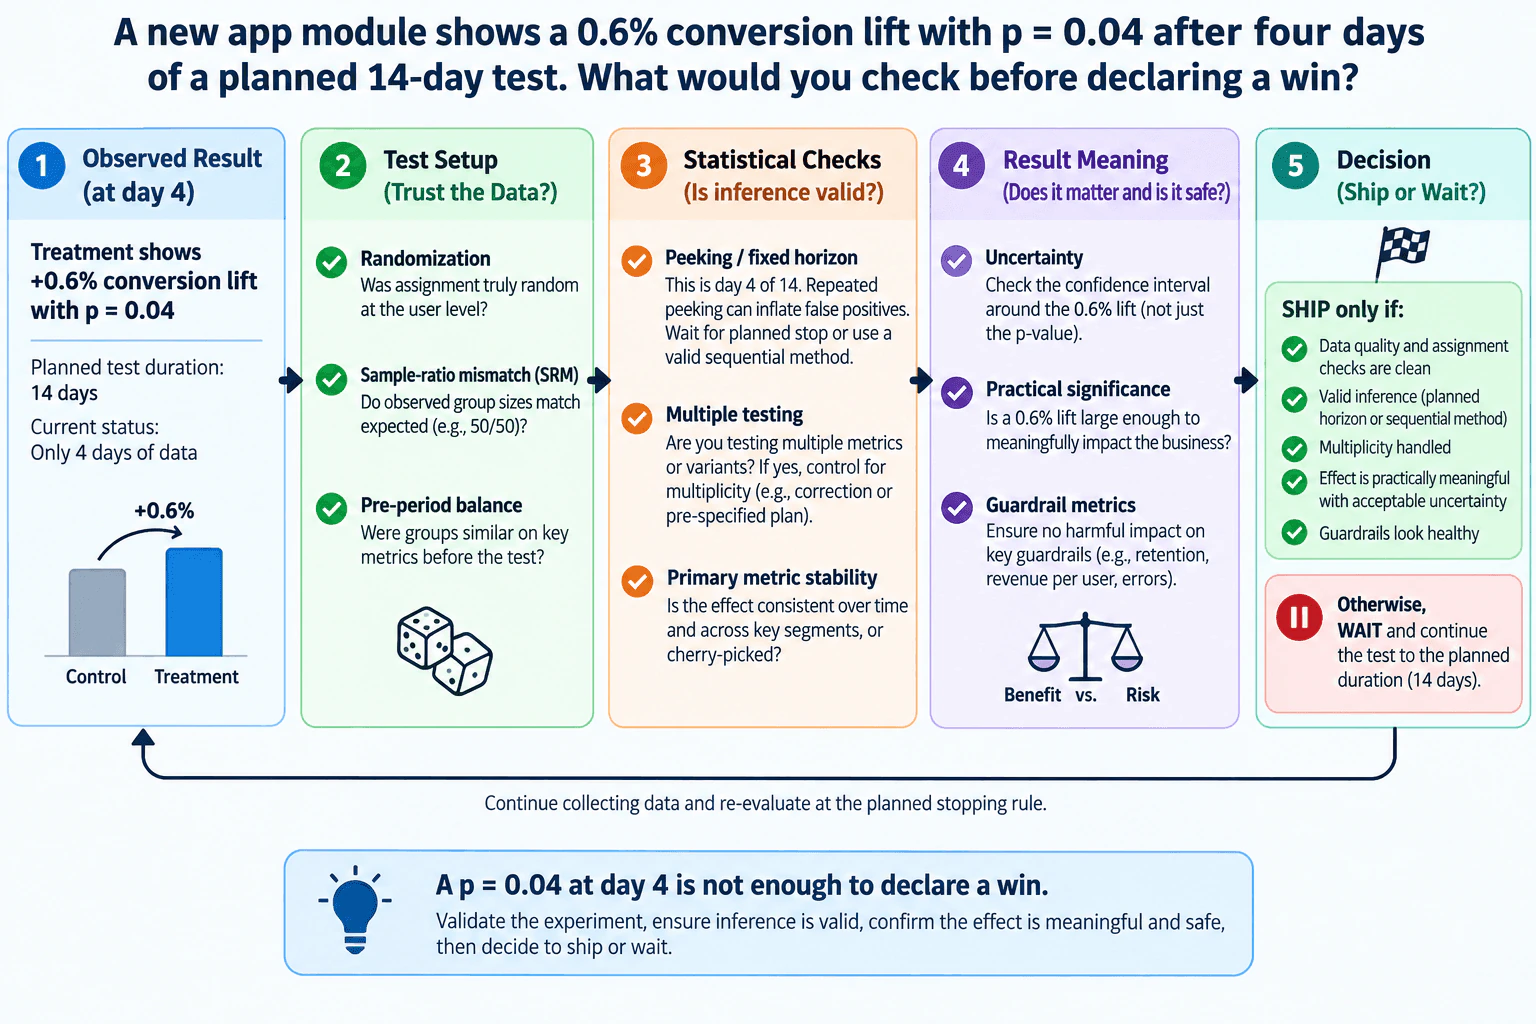
I would work from experiment validity to statistical validity to business value, matching the flow in the diagram.
First, I would define the hypothesis. The null hypothesis is that the treatment does not change the population conversion rate relative to control. The alternative is that the treatment changes conversion; if a one-sided improvement hypothesis was explicitly specified before the experiment, the alternative could instead be that treatment conversion is higher. The observed 0.6% lift is a sample estimate, not automatically the true population effect. The p-value is also not an effect size. Under the assumptions of the chosen hypothesis test, p = 0.04 measures how incompatible the observed result is with the null hypothesis; it does not tell us how large, valuable, or likely the treatment effect is.
Next, I would validate the test setup before interpreting the lift. I would confirm that eligible users were randomly assigned at the intended unit, such as the user level if that was the design, and that assignment, eligibility, exposure, and outcome logging were applied consistently. I would also look for attrition, selection introduced after randomization, or interference between treatment and control because these can weaken the causal interpretation.
I would then run a sample-ratio-mismatch check. The observed treatment and control counts should be statistically consistent with the allocation ratio specified by the experiment. An unexpected mismatch can indicate assignment bugs, filtering differences, missing telemetry, eligibility problems, or other implementation failures. I would investigate a meaningful SRM before trusting the conversion comparison rather than treating it as a harmless imbalance.
I would also check pre-period balance on important baseline metrics or characteristics measured before treatment. Randomization does not guarantee identical groups in every realized sample, so some differences can occur by chance. I would use the balance check mainly as a diagnostic for material or systematic problems with assignment, filtering, or population composition, not reject a sound randomized experiment merely because one of many baseline variables happens to look different.
Sample size and statistical power matter as well. I would compare the accumulated sample with the pre-planned sample size and minimum detectable effect rather than computing post-hoc power from the observed p-value. Four days may not contain enough observations or enough recurring user behavior to estimate the effect precisely. A small p-value by itself does not prove that the experiment has accumulated the information planned for the final decision.
The biggest warning in the question is peeking. If this is a conventional fixed-horizon experiment designed to be evaluated at the planned stopping point, repeatedly checking ordinary fixed-horizon p-values and stopping when one becomes significant increases the chance of a false positive. I would ask whether day 4 was a pre-specified interim analysis. If not, I would normally continue to the planned stopping point. If the experiment was designed in advance with a valid sequential-testing method and stopping boundaries, I would follow that sequential rule instead of automatically waiting for day 14.
I would also check multiple testing. If the team examined many outcome metrics, variants, segments, or hypotheses and highlighted the most favorable result, the nominal p = 0.04 may not reflect the overall false-positive risk. I would identify the pre-specified primary comparison and determine whether the experiment's multiplicity procedure, testing hierarchy, or other planned control was followed. Exploratory segment findings should be treated as exploratory unless the additional testing is properly accounted for.
Then I would evaluate primary-metric stability. I would inspect the conversion effect over time to see whether it is reasonably consistent rather than being driven by one unusual day, a launch spike, a tracking change, or a narrow segment. I would also confirm that the conversion definition, denominator, attribution window, eligibility rules, and instrumentation stayed stable during the test. Segment checks can help diagnose anomalies, but they should not be cherry-picked as new confirmatory results.
For uncertainty, I would report a confidence interval for the treatment-control conversion effect using an analysis method consistent with the experiment design and stopping rule. A confidence interval gives a range of effect sizes compatible with the data and method, rather than reducing the result to a single p-value. I cannot calculate the interval from the supplied information because the group sizes, underlying conversion rates, and exact test are not provided. I would examine whether the interval is precise enough for the decision and whether it still includes effects that are too small to matter or otherwise inconsistent with the desired business outcome.
Next comes practical significance. Even if the final result is statistically significant, a 0.6% lift must be evaluated against the business decision threshold. I would first confirm whether 0.6% means a relative increase or an absolute percentage-point increase because those are different effect sizes. Then I would compare the plausible conversion benefit with implementation cost, operational complexity, user experience, and the minimum effect considered worth shipping.
I would also review the pre-specified guardrail metrics. The diagram gives examples such as retention, revenue per user, and errors. I would use the actual guardrails defined for this experiment and check whether the module produces unacceptable harm on any of them. A conversion improvement is not a win if it causes a material deterioration elsewhere. I would consider uncertainty around guardrails too; failing to observe a statistically significant decline is not the same as proving that a guardrail is unaffected.
Finally, I would make the ship-or-wait decision. I would ship only when assignment and data-quality checks are clean, the inference respects the planned stopping rule, multiplicity is handled, the effect is sufficiently precise and practically meaningful, and guardrails are acceptable. With only the facts given in the question, p = 0.04 on day 4 is not enough to declare victory. For a fixed-horizon 14-day design, I would keep collecting data and re-evaluate at the planned stopping point. For a properly designed sequential experiment, I would use its pre-specified stopping rule. The conclusion should be no stronger than the experiment design and evidence support.
Technical Approach
Confirm the estimand: the treatment-versus-control change in conversion, including whether the reported 0.6% is relative or absolute and what denominator defines conversion.
State the null and alternative hypotheses and identify the pre-specified primary metric, randomization unit, planned duration, sample size, power target, and stopping rule.
Validate random assignment, exposure eligibility, unique assignment, attrition, interference, and logging or tracking quality.
Check observed treatment and control counts against the intended allocation for sample-ratio mismatch and investigate any meaningful discrepancy.
Compare important pre-period metrics and characteristics to detect material or systematic imbalance or implementation problems without over-interpreting isolated chance differences.
Determine whether day 4 is an unplanned peek. For a fixed-horizon test, avoid declaring success from repeated ordinary p-value checks; for a pre-specified sequential design, apply its stopping rule.
Review all tested metrics, variants, segments, and hypotheses and apply the pre-specified multiplicity strategy where required.
Check the primary conversion effect for stability over time, consistency of metric definitions, instrumentation changes, and obvious segment-specific anomalies.
Estimate and report an appropriate confidence interval for the conversion effect using an analysis framework consistent with the hypothesis test and stopping procedure.
Evaluate practical significance by comparing the plausible effect size with the business decision threshold and implementation tradeoffs.
Review pre-specified guardrail metrics for harmful changes and account for their uncertainty.
Ship only if validity checks pass, inference is valid, multiplicity is handled, the effect is meaningfully positive with acceptable uncertainty, and guardrails are healthy; otherwise continue to the planned stopping rule or investigate the failure.
Practical Insights
The main cost is analytical rather than computational. The checks require assignment records, exposure and conversion events, pre-period data, experiment metadata, and guardrail metrics. Most calculations scale roughly with the number of experiment observations being summarized. The more variants, metrics, segments, and interim looks that are examined, the more statistical care is needed because multiplicity and repeated testing increase false-positive risk. Waiting for the planned stopping point costs time, but it usually provides more information and protects the validity of a fixed-horizon decision. A pre-specified sequential design can support earlier decisions, but it requires the correct monitoring and stopping procedure to be chosen in advance.
Why Interviewers Ask This
This tests whether the candidate can resist declaring success from one nominally significant early result and instead evaluate experiment validity, statistical inference, uncertainty, business value, and decision risk. A strong answer separates the observed 0.6% lift and p = 0.04 from evidence that randomization worked, the analysis respected the stopping and multiple-testing plan, the effect is stable, guardrails are healthy, and the magnitude is practically meaningful.
Common interview mistakes
Declaring victory only because p < 0.05; treating the p-value as the effect size or as the probability that the null hypothesis is true; ignoring that the result was observed on day 4 of a planned 14-day fixed-horizon test; repeatedly peeking without a valid sequential method; skipping randomization and sample-ratio-mismatch checks; treating any isolated pre-period difference as proof that randomization failed; ignoring the pre-planned sample size and power design; testing many metrics, segments, or variants and reporting the best one without handling multiplicity; cherry-picking favorable time periods; treating the 0.6% lift as meaningful without confirming whether it is relative or absolute and whether it clears the business threshold; omitting confidence intervals; and declaring a win while guardrail metrics may be harmed.
Interview tip
Organize the answer as Test Setup → Statistical Checks → Result Meaning → Ship or Wait. Start by saying that p = 0.04 at day 4 is not enough by itself. Then name the validity checks, explain peeking and multiple testing, discuss the confidence interval and practical significance, review guardrails, and finish with the decision rule: wait for the planned fixed-horizon stop unless a valid pre-specified sequential rule permits an earlier decision.
Interviewer may ask next
Suppose the treatment and control groups show a statistically significant sample-ratio mismatch. What would you do next?
I would pause interpretation of the conversion lift and investigate why the observed assignment counts differ from the intended allocation. I would check randomization logic, eligibility filters, exposure logging, missing events, duplicate assignments, bots or invalid traffic, delayed data, and any post-randomization filtering that affects one group differently. I would also identify when the mismatch began and whether it is concentrated in a platform, geography, version, or another operational segment. I would not simply reweight the groups and continue unless the cause is understood and the resulting analysis remains defensible. If the SRM indicates broken assignment or measurement, the causal result may be invalid and the safest action can be to repair the experiment and restart it.
What if the team needs a decision before day 14 because the feature has a large opportunity cost?
I would not solve the time pressure by repeatedly checking an ordinary fixed-horizon p-value. If early decisions are important, the experiment should use a pre-specified sequential design or another valid monitoring approach with stopping rules that control the relevant error rate. I would still require clean randomization, no unresolved SRM, stable measurement, appropriate multiplicity handling, acceptable guardrails, and an effect large enough to justify the business tradeoff. If the current experiment was designed only for a fixed 14-day analysis and no valid early-stopping rule was planned, I would explain that an early ship decision carries greater statistical uncertainty and false-positive risk rather than presenting day-4 p = 0.04 as conclusive.
7. What is the order of execution of SQL queries?Sql And DatabasesEasyTarget
Short Interview Answer (30-60 seconds)
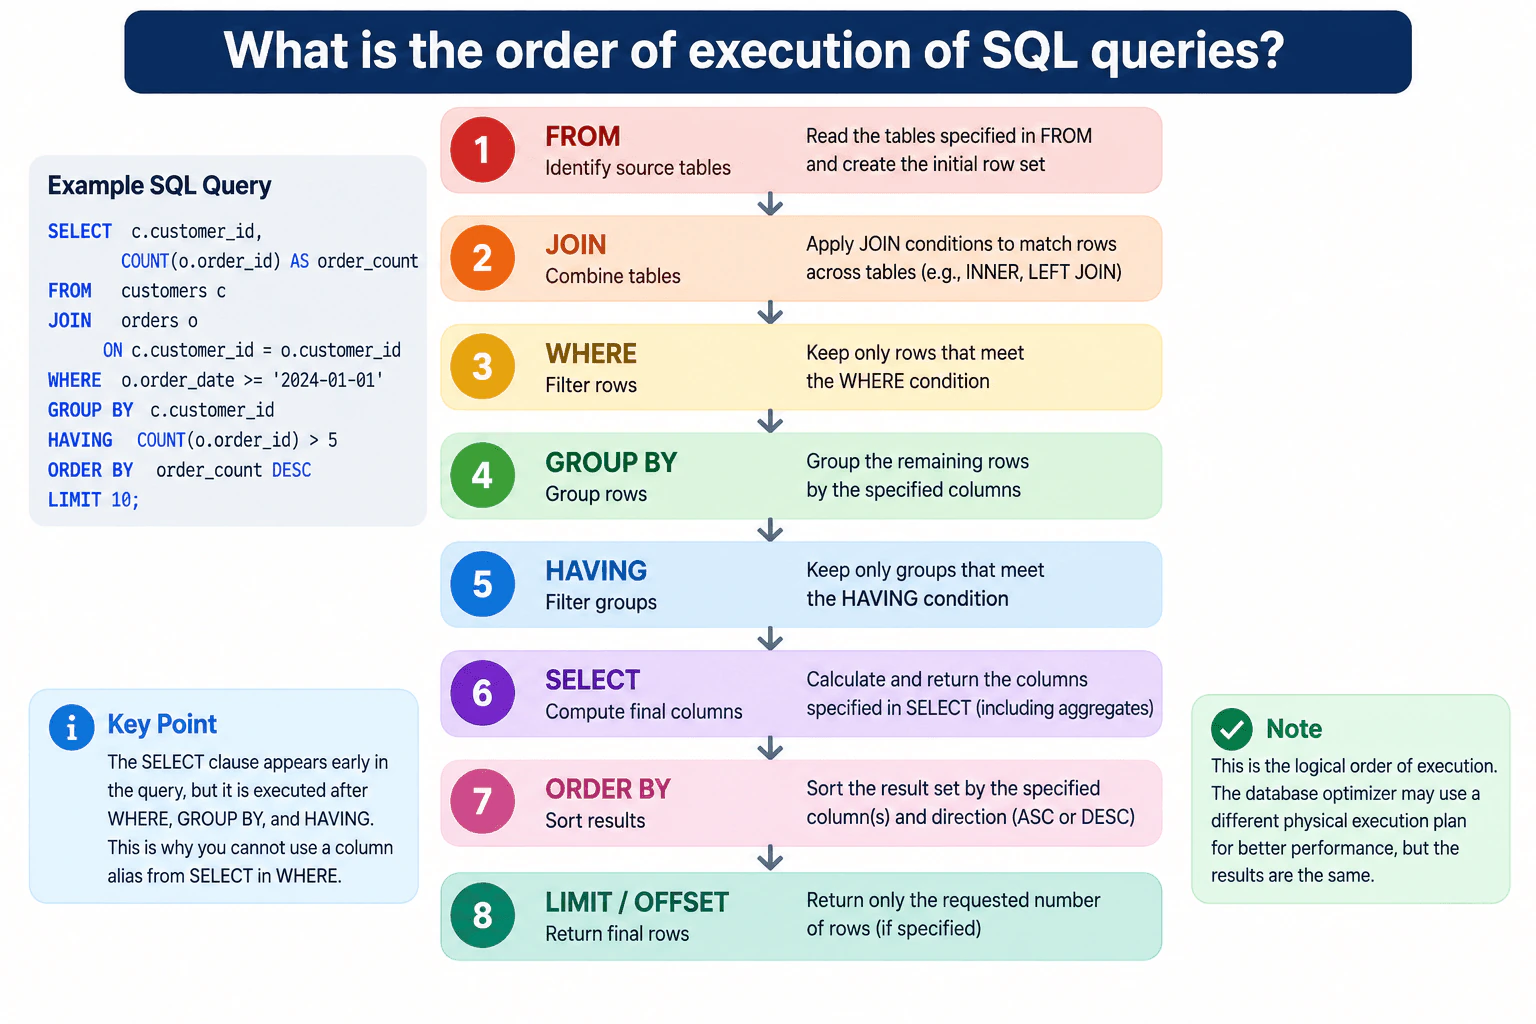
For the SELECT query shown, the logical processing order is FROM, JOIN, WHERE, GROUP BY, HAVING, SELECT, ORDER BY, then LIMIT or OFFSET. FROM and JOIN build the working row set. WHERE filters individual rows. GROUP BY forms groups, and HAVING filters those groups. SELECT computes and returns the requested expressions. ORDER BY sorts the result, and LIMIT or OFFSET returns the requested final rows. This is the logical order; the database optimizer may use a different physical execution plan while preserving the query's semantics.
Detailed Explanation
SQL is usually written beginning with SELECT, but that is not the order in which its clauses are logically processed. For the query shown in the diagram, the database first builds the source row set from FROM and JOIN. It then filters rows with WHERE, forms groups with GROUP BY, filters those groups with HAVING, evaluates the SELECT expressions, sorts with ORDER BY, and finally applies LIMIT or OFFSET. Understanding this order explains common SQL behavior, especially why a SELECT alias generally cannot be referenced from the earlier WHERE stage.
Useful Questions to Ask the Interviewer
Which SQL dialect should I assume, since LIMIT, OFFSET, and alias rules can vary by database?
Are you asking for logical query-processing order or the physical execution plan chosen by the optimizer?
Should I focus only on the clauses shown in the example, or also discuss optional clauses such as DISTINCT and window functions?
How to Explain It in an Interview
Think of the query as a pipeline that transforms a row set from one stage to the next.
FROM: Identify the source tables and create the initial working row set. Before reasoning about later clauses, understand the grain of each source table: what one row represents and which keys identify it.
JOIN: Combine rows from related tables according to the join condition. An INNER JOIN keeps matching rows, while a LEFT JOIN preserves rows from the left table even when no matching row exists on the right. A one-to-many relationship can multiply rows, so the resulting grain and row count should be checked before aggregation.
WHERE: Filter individual rows before grouping. A row passes a WHERE predicate when the condition evaluates to TRUE. SQL uses three-valued logic, so FALSE and UNKNOWN do not pass. NULL comparisons therefore require proper NULL handling, such as IS NULL rather than = NULL.
GROUP BY: Place the remaining rows into groups based on the grouping columns. Aggregate functions such as COUNT, SUM, or AVG then operate at the grouped grain.
HAVING: Filter groups after GROUP BY and aggregation. This is the main difference between WHERE and HAVING: WHERE filters rows before grouping, while HAVING filters grouped results afterward.
SELECT: Evaluate and return the requested output expressions, including selected columns and aggregates. Because WHERE is logically earlier than SELECT, a SELECT alias generally cannot be used in WHERE. Alias visibility in other clauses can depend on the SQL dialect.
ORDER BY: Sort the result rows by the requested expressions and direction, such as ASC or DESC. If stable ordering matters, add enough sort keys to resolve ties deterministically.
LIMIT / OFFSET: Return only the requested portion of the ordered result when the SQL dialect supports these clauses. Using LIMIT without a deterministic ORDER BY can return an arbitrary subset instead of a stable top-N result.
The diagram shows logical processing order, not a literal physical execution sequence. The optimizer may push filters earlier, reorder joins, choose indexes, or use different join algorithms as long as the final query semantics remain the same. For analyst work, I would validate the result by checking row counts after joins, confirming the expected grain before and after GROUP BY, testing NULL and boundary cases, checking duplicate multiplication from one-to-many joins, and comparing important totals with a trusted source.
Technical Approach
Identify the SQL dialect and confirm that the question is about logical processing rather than the physical execution plan.
Start with FROM and JOIN to define the working row set and its grain.
Apply WHERE to filter individual rows.
Apply GROUP BY to form groups and calculate aggregates.
Apply HAVING to filter grouped results.
Evaluate SELECT expressions and output columns.
Apply ORDER BY with deterministic tie-breaking when stable order matters.
Apply LIMIT or OFFSET if supported and requested.
Validate join row counts, duplicate multiplication, NULL behavior, grouped totals, output grain, and final ordering.
Practical Complexity & Trade-offs
There is no single Big-O cost for the logical clause order because physical performance depends on table sizes, indexes, join strategies, filters, grouping, sorting, available memory, and the optimizer's chosen execution plan. JOIN, GROUP BY, and ORDER BY can be expensive on large inputs, while selective filters may reduce later work. LIMIT reduces the number of rows returned, but it does not necessarily mean the database can skip all earlier processing. Logical correctness and physical performance should therefore be discussed separately.
Where it is used
This knowledge is useful when writing and debugging analytical SQL with joins, row filters, aggregates, HAVING conditions, aliases, sorting, and top-N or paginated results. It helps explain inflated totals after one-to-many joins, why aggregate filters belong in HAVING, why some aliases cannot be referenced in WHERE, and why stable limited results normally require deterministic ordering.
Why Interviewers Ask This
The interviewer wants to know whether you understand SQL's logical query-processing order rather than only the order in which clauses are written. That understanding helps explain joins, row filters, aggregation, HAVING, aliases, sorting, row limiting, and why a query can return unexpected results even when its syntax is valid.
Common interview mistakes
Common mistakes are assuming SQL executes from top to bottom as written; using a SELECT alias in WHERE even though WHERE is logically earlier; confusing WHERE with HAVING; forgetting that a one-to-many JOIN can multiply rows before aggregation; comparing NULL with = instead of using proper NULL predicates; using LIMIT without deterministic ORDER BY when stable results are required; and confusing logical query-processing order with the database engine's physical execution plan.
Interview tip
Give the sequence first, then explain each stage in one sentence: FROM/JOIN builds the row set, WHERE filters rows, GROUP BY forms groups, HAVING filters groups, SELECT computes the output, ORDER BY sorts it, and LIMIT/OFFSET trims the final result. Finish by stating that this is logical processing order and the optimizer may choose a different physical plan.
Interviewer may ask next
What changes if a one-to-many JOIN creates duplicate-looking rows before GROUP BY?
The logical processing order does not change, but the joined row set now has a finer grain because one row from one table can match several rows from the other table. Later COUNT, SUM, or other aggregates operate on that multiplied row set unless the query intentionally changes the grain first. I would verify the join keys and cardinality, compare row counts before and after the join, inspect duplicate keys, and confirm that grouped totals match the intended business grain.
Does the database always physically execute the query in this exact order?
No. This sequence describes logical SQL processing. The optimizer may push predicates closer to scans, reorder joins, choose different join algorithms, use indexes, or make other transformations for performance. Those physical choices are valid only when they preserve the query's required semantics. If performance matters, I would inspect the database's execution plan instead of assuming the logical clause order is the physical execution order.
8. Write SQL to calculate weekly net sales by department for Drive Up orders after cancellations and returns.Sql And DatabasesMediumTarget
i Question Details
Use orders(order_id, guest_id, order_ts, store_id, channel, status), order_items(order_id, item_id, dept, qty, unit_price, line_status), and returns(order_id, item_id, return_ts, return_qty, return_amount). Aggregate returns before joining so repeated return events do not duplicate sales.
Short Interview Answer (30-60 seconds)
I would first aggregate returns to one row per order_id and item_id because the returns table can contain multiple events for the same item. Then I would join orders to order_items, LEFT JOIN the aggregated returns, keep Drive Up orders, and exclude cancelled orders and cancelled line items. For each eligible item, net sales are qty * unit_price minus COALESCE(return_amount, 0). Finally, I would use date_trunc('week', order_ts), group by week and department, and validate that the return join does not increase the eligible item row count.
The main risk is joining the raw returns table directly to sales items. One item can have several return events, so that join could repeat the original sale and overstate revenue. I first reduce returns to one row for each order and item. Then I join eligible Drive Up order items to that result, subtract the total returned amount, and group the remaining net sales by the order week and department. A LEFT JOIN keeps items that were never returned, while COALESCE treats their missing return amount as zero. The final grain is one row per week and department.
Useful Questions to Ask the Interviewer
Which SQL dialect should I use? I will use PostgreSQL syntax here because the approved diagram uses date_trunc.
What exact values represent cancelled orders and cancelled line items, including capitalization?
Can status or line_status be NULL, and if so, should NULL rows be treated as eligible or excluded?
Which time zone should define the reporting week for order_ts?
Should returns reduce the original order week, as shown in the approved diagram, or be reported in the week of return_ts?
Is return_amount already the authoritative monetary amount to subtract for partial and repeated returns?
How to Explain It in an Interview
Start with the grain. orders has one row per order. order_items is treated as one row per (order_id, item_id). returns can have multiple rows for the same (order_id, item_id) because an item may have repeated return events. If I join raw returns directly to order items, the original item sale can be repeated. That would overstate sales. So I aggregate returns first.
The return_agg CTE groups returns by order_id and item_id and calculates SUM(return_qty) and SUM(return_amount). This produces one row per item key before the join. The return quantity is useful for validation, while the net-sales calculation uses the supplied return_amount, matching the approved diagram.
Next, I join orders to order_items on order_id. I keep only o.channel = 'Drive Up', exclude cancelled orders with o.status <> 'cancelled', and exclude cancelled line items with oi.line_status <> 'cancelled'. Those predicates match the approved diagram, but they assume the data uses that exact cancellation value and that NULL status values should not qualify. If NULL has a valid business meaning, I would confirm the rule first.
Then I LEFT JOIN the aggregated return rows using both order_id and item_id. The LEFT JOIN is important because an item with no return still belongs in sales. For those rows, r.return_amount is NULL, so COALESCE(r.return_amount, 0) changes the missing return amount to zero for the arithmetic.
At item grain, the calculation is oi.qty * oi.unit_price - COALESCE(r.return_amount, 0). The final query applies date_trunc('week', o.order_ts) and groups by that week and oi.dept. The output grain is therefore one row per week_start and department with the summed net_sales value.
The week is based on order_ts, not return_ts, so a later return reduces the original order's reporting week in this design. That is consistent with the approved diagram but is a business assumption worth confirming. The reporting time zone should also be confirmed before production use if order_ts can represent multiple time zones.
For validation, I would first confirm that return_agg contains at most one row per (order_id, item_id). Then I would compare the eligible item row count before and after the LEFT JOIN to return_agg; the join should not increase it when the item key is unique. I would also reconcile eligible gross sales minus aggregated return amounts to the final net-sales total and compare the result with a trusted sales control total if one is available. These checks catch duplicate joins, missing filters, unexpected item-key duplicates, and return amounts that do not reconcile.
Technical Approach
Define the input grains: one row per order in orders, one row per order-item key in order_items, and potentially multiple return events per order-item key in returns.
Aggregate returns by order_id and item_id to one row per item key, summing return_qty and return_amount.
Join orders to order_items on order_id.
LEFT JOIN the aggregated returns on both order_id and item_id so items without returns remain in the result.
Filter to channel = 'Drive Up', exclude cancelled orders, and exclude cancelled line items.
Calculate item net sales as qty * unit_price - COALESCE(return_amount, 0).
Derive week_start with date_trunc('week', order_ts).
GROUP BY week_start and dept and SUM the item-level net sales.
ORDER BY week_start and dept for deterministic presentation.
Validate that the return join does not multiply item rows and reconcile gross sales minus returns to net sales.
Practical Complexity & Trade-offs
The main work is scanning and grouping the returns table, joining the inputs, and grouping eligible item rows by week and department. The exact cost depends on table sizes, indexes, statistics, and the database execution plan. Pre-aggregating returns can reduce the number of return rows entering the sales join and, more importantly, prevents incorrect row multiplication. Indexes on join keys may improve performance, but they are a performance consideration rather than part of the correctness logic.
Example
PostgreSQL implementation matching the approved diagram. The CTE aggregates repeated return events to one row per (order_id, item_id). The main query joins orders to items, LEFT JOINs those aggregated returns, filters to eligible Drive Up sales, subtracts returned amounts with COALESCE, and aggregates to one row per week and department.
Code
WITH
return_agg AS (
SELECT
order_id,
item_id,
SUM(return_qty) AS return_qty,
SUM(return_amount) AS return_amount
FROMRETURNSGROUPBY
order_id,
item_id
)
SELECT
date_trunc ('week', o.order_ts) AS week_start,
oi.dept,
SUM(
oi.qty * oi.unit_price -COALESCE(r.return_amount, 0)
) AS net_sales
FROM
orders AS o
JOIN order_items AS oi ON oi.order_id = o.order_id
LEFTJOIN return_agg AS r ON r.order_id = oi.order_id
AND r.item_id = oi.item_id
WHERE
o.channel ='Drive Up'AND o.status <>'cancelled'AND oi.line_status <>'cancelled'GROUPBY1,
2ORDERBY1,
2;
Where it is used
This pattern is useful in retail, e-commerce, fulfillment, and finance reporting when sales transactions and later adjustments are stored in separate one-to-many tables. The same grain-first technique applies to refunds, payments, shipments, promotions, and other event tables that could otherwise multiply fact rows during joins.
Why Interviewers Ask This
This tests whether the candidate can reason about table grain before joining, prevent one-to-many return events from multiplying sales, filter cancelled orders and cancelled line items correctly, handle items with no returns using a LEFT JOIN and COALESCE, group timestamps into reporting weeks, and validate that weekly department totals are trustworthy.
Common interview mistakes
Joining raw returns directly to order_items and duplicating the original sale for repeated return events; joining aggregated returns only by order_id instead of by both order_id and item_id; using an INNER JOIN to returns and dropping items that were never returned; forgetting COALESCE so non-returned items create NULL arithmetic; filtering only the order status but not the line status; grouping by return_ts when this design reports by the original order week; assuming <> 'cancelled' includes NULL statuses; and failing to verify that order_items is unique at the stated item grain.
Interview tip
Lead with grain rather than SQL syntax: explain that returns must first become one row per order-item key to prevent row multiplication. Then explain the LEFT JOIN, cancellation filters, net-sales formula, and weekly department GROUP BY. Finish with two checks: the return join should not increase eligible item rows, and gross eligible sales minus aggregated returns should reconcile to net sales.
Interviewer may ask next
What would you change if status or line_status can be NULL and NULL means the record is still eligible?
I would make that rule explicit because <> 'cancelled' does not evaluate to true for NULL values. In PostgreSQL, if the confirmed business rule is that NULL is eligible, I could use o.status IS DISTINCT FROM 'cancelled' and oi.line_status IS DISTINCT FROM 'cancelled'. That retains NULL values while excluding the cancelled value.
What would change if the business wants returns reported in the week they occurred instead of reducing the original order week?
The current design groups by order_ts, so returns reduce the original order week. If the requirement changes to return-event week, I would keep return timing in the aggregation, for example by aggregating returns by date_trunc('week', return_ts), order_id, and item_id, and then design the weekly report so sales and return adjustments are assigned to their own reporting weeks. That changes the time grain and can create return adjustments in weeks with no original sale, so the output logic and reconciliation checks must change as well.
9. Write SQL to create a daily guest funnel with first visit, first add-to-cart, and first purchase timestamps.NEWSql And DatabasesHardTarget
i Question Details
Use events(guest_id, event_ts, event_name, session_id) and orders(order_id, guest_id, order_ts, status) for the last 30 days. Return one row per guest and day, deduplicate sessions, and exclude cancelled orders.
Short Interview Answer (30-60 seconds)
I would first define the output grain as one row per guest and business day. In PostgreSQL, I would filter events and orders to the same rolling 30-day timestamp window, convert timestamps to the chosen business day, and deduplicate events by guest, day, session, and event type using MIN(event_ts). Then I would aggregate the first visit and add-to-cart timestamps and separately aggregate the first non-cancelled purchase. Finally, I would UNION the event and order guest-days into a spine and LEFT JOIN both aggregates so missing stages remain NULL.
The goal is to create one daily funnel row for every guest who has a relevant event or qualifying order during the last 30 days. Events can repeat inside a session, so those rows must be reduced before calculating the first visit and first add-to-cart. Orders are handled separately because they have a different grain and cancelled orders must not count as purchases. After both sources are aggregated to guest and day, a shared guest-day list prevents one-to-many row multiplication and also keeps days that appear on only one side.
Useful Questions to Ask the Interviewer
Which SQL dialect should I use? I will use PostgreSQL here because the approved diagram uses FILTER, AT TIME ZONE, and PostgreSQL interval syntax.
What business time zone defines a calendar day? I will use America/Los_Angeles to match the approved diagram.
Are event_ts and order_ts stored as timestamptz? The day-conversion expression below assumes they are.
Which event_name values represent the first two funnel stages? I will use visit and add_to_cart, matching the approved diagram.
Can orders.status be NULL? status <> 'cancelled' does not keep NULL statuses, so I would confirm whether that behavior is intended.
How to Explain It in an Interview
The most important decision is the join grain. events starts at one row per event, while orders starts at one row per order. Joining the raw tables directly by guest_id could multiply rows when a guest has several events and several orders. I therefore reduce each source independently before joining, so both sides are at one row per guest_id, day.
First, use the same half-open rolling timestamp window on both sources: timestamps must be greater than or equal to current_timestamp - interval '30 days' and strictly less than current_timestamp. Using identical boundaries keeps the event and order populations aligned.
For events, convert event_ts to the chosen business day and keep only visit and add_to_cart. Deduplicate repeated session activity at the grain guest_id, day, session_id, event_name with MIN(event_ts). This keeps the earliest occurrence of each relevant event type inside each session while preventing repeated event rows from affecting the next aggregation.
Next, aggregate those deduplicated event rows to guest_id, day. MIN(event_ts) FILTER (WHERE event_name = 'visit') gives first_visit_ts, and the same pattern for add_to_cart gives first_add_to_cart_ts. If one of those stages did not occur that day, its result is NULL.
Orders are processed separately. Convert order_ts to the same business day, apply the same rolling 30-day boundaries, exclude cancelled orders before aggregation, and use MIN(order_ts) per guest_id, day as first_purchase_ts.
To retain both event-only and order-only guest-days, create guest_days with a UNION of the guest-day keys from events_agg and orders_agg. UNION removes duplicate keys. LEFT JOIN both aggregates back to that spine using both guest_id and day. That produces exactly one output row per guest and day while allowing any missing funnel stage to remain NULL.
The main failure cases are inconsistent time zones, different date boundaries across sources, joining before aggregation, forgetting session deduplication, filtering cancelled orders after calculating the purchase minimum, or building the output only from event rows and thereby dropping order-only days. I would validate uniqueness of (guest_id, day), confirm that no cancelled order contributes to first_purchase_ts, compare stage counts with trusted source totals, and inspect records around the 30-day cutoff and local-midnight boundaries.
Technical Approach
Define the final grain as exactly one row per guest_id, day.
Use PostgreSQL and one business time zone, America/Los_Angeles, consistently for both source tables.
Filter events to [current_timestamp - interval '30 days', current_timestamp) and to event_name IN ('visit', 'add_to_cart').
Derive the local business day, then deduplicate events by guest_id, day, session_id, event_name using MIN(event_ts).
Aggregate the deduplicated events to guest-day and calculate first_visit_ts and first_add_to_cart_ts with conditional MIN aggregates.
Filter orders to the identical 30-day window and exclude rows where status = 'cancelled'.
Derive the same local business day and aggregate orders to guest-day using MIN(order_ts) as first_purchase_ts.
Build a guest_days spine by taking the UNION of guest-day keys from the event and order aggregates.
LEFT JOIN events_agg and orders_agg to the spine on both guest_id and day.
Validate uniqueness, NULL behavior, cancellation filtering, time-zone boundaries, and stage counts against trusted totals.
Practical Complexity & Trade-offs
The query scans the relevant 30-day portions of events and orders, groups events first at the session-event level and then at the guest-day level, and groups orders at the guest-day level. The main work is reading rows and performing grouping with hashing or sorting. Filtering early reduces the amount of data processed. The guest-day spine is based only on already-aggregated keys, which avoids a large raw-table join. Indexes may improve performance depending on table size, data distribution, and the execution plan, but they are a performance consideration rather than part of the correctness logic.
Example
This PostgreSQL implementation matches the approved diagram. It assumes event_ts and order_ts are timestamptz, uses America/Los_Angeles as the business time zone, applies the same half-open rolling 30-day interval to both sources, deduplicates event sessions before guest-day aggregation, excludes cancelled orders before calculating purchases, and creates a unioned guest-day spine so both event-only and order-only days are retained.
Code
WITH
deduped_events AS (
SELECT
guest_id,
CAST(
event_ts ATTIME ZONE 'America/Los_Angeles'ASdate
) ASDAY,
session_id,
event_name,
MIN(event_ts) AS event_ts
FROM
events
WHERE
event_name IN ('visit', 'add_to_cart')
AND event_ts >=current_timestamp-interval'30 days'AND event_ts <current_timestampGROUPBY
guest_id,
CAST(
event_ts ATTIME ZONE 'America/Los_Angeles'ASdate
),
session_id,
event_name
),
events_agg AS (
SELECT
guest_id,
DAY,
MIN(event_ts) FILTER (
WHERE
event_name ='visit'
) AS first_visit_ts,
MIN(event_ts) FILTER (
WHERE
event_name ='add_to_cart'
) AS first_add_to_cart_ts
FROM
deduped_events
GROUPBY
guest_id,
DAY
),
orders_agg AS (
SELECT
guest_id,
CAST(
order_ts ATTIME ZONE 'America/Los_Angeles'ASdate
) ASDAY,
MIN(order_ts) AS first_purchase_ts
FROM
orders
WHERE
status <>'cancelled'AND order_ts >=current_timestamp-interval'30 days'AND order_ts <current_timestampGROUPBY
guest_id,
CAST(
order_ts ATTIME ZONE 'America/Los_Angeles'ASdate
)
),
guest_days AS (
SELECT
guest_id,
DAYFROM
events_agg
UNIONSELECT
guest_id,
DAYFROM
orders_agg
)
SELECT
g.guest_id,
g.day,
e.first_visit_ts,
e.first_add_to_cart_ts,
o.first_purchase_ts
FROM
guest_days AS g
LEFTJOIN events_agg AS e ON g.guest_id = e.guest_id
AND g.day = e.day
LEFTJOIN orders_agg AS o ON g.guest_id = o.guest_id
AND g.day = o.day
ORDERBY
g.guest_id,
g.day;
Where it is used
This pattern is useful for daily ecommerce or product funnels where analysts need a stable guest-day dataset for conversion analysis, cohort reporting, downstream BI metrics, or funnel diagnostics while keeping incomplete journeys instead of dropping rows when one or more stages are missing.
Why Interviewers Ask This
This tests whether the candidate can control data grain across event and order tables, deduplicate repeated session activity, apply consistent date boundaries, exclude cancelled orders, aggregate first timestamps correctly, avoid row multiplication during joins, and validate that the final result contains exactly one row per guest and business day.
Common interview mistakes
Joining raw events and orders before aggregation can multiply rows and corrupt the funnel timestamps. Other common mistakes are deduplicating only by session_id without preserving event_name, using different time zones or date boundaries for events and orders, counting cancelled orders as purchases, using an event-only output spine that drops order-only days, deriving the calendar day before agreeing on the business time zone, and assuming status <> 'cancelled' includes NULL statuses when SQL actually evaluates that comparison to UNKNOWN.
Interview tip
Lead with the grain: one row per guest and business day. Then explain that each source is reduced independently to that grain before joining. Mention session-level event deduplication, the shared half-open 30-day window, cancelled-order filtering, the unioned guest-day spine, LEFT JOINs, and NULLs for missing stages. Finish with uniqueness and trusted-total validation checks.
Interviewer may ask next
What would you change if orders.status can be NULL and NULL means the order should still count as non-cancelled?
The current predicate status <> 'cancelled' does not retain NULL because SQL comparisons with NULL evaluate to UNKNOWN. If NULL should count as non-cancelled, I would make that rule explicit in PostgreSQL with status IS DISTINCT FROM 'cancelled'. I would confirm the business meaning first because deciding that an unknown status is a valid purchase is a data-definition decision, not only a SQL syntax decision.
What changes if the business wants complete local calendar days instead of a rolling 30-day timestamp window?
I would keep the same guest-day aggregation and join strategy but replace the rolling timestamp bounds with explicit business-day boundaries derived in the agreed time zone. Those boundaries should then be applied consistently to both event_ts and order_ts. The important rule is that both source tables use the same time-zone definition and identical lower and upper boundaries so events and orders cannot be assigned to inconsistent reporting windows.
10. How would you design a Power BI dashboard for weekly digital sales and fulfillment health for a Target category lead?Business Intelligence ToolsEasyTarget
i Question Details
Choose between a KPI scorecard and funnel as the leading view, explain the information hierarchy, and define drill paths for BOPIS and Ship-to-Home performance.
Short Interview Answer (30-60 seconds)
I would lead with a KPI scorecard, not a funnel, because the category lead needs to compare parallel weekly health measures rather than follow sequential conversion stages. The top view would use the selected week, category, and applicable channel filters, then show Digital Sales, Orders, Fulfillment Rate, On-time / Ready-on-time, and Cancellation Rate. From those KPIs, I would provide separate Power BI drillthrough paths for BOPIS and Ship-to-Home while carrying the selected filter context. Underneath, I would use Power Query for transformation, a governed star-style semantic model, and reusable DAX measures. Before publishing, I would reconcile totals to a trusted source, check refresh recency and latency, test report performance, and apply row-level security where access differs.
Detailed Explanation
The task is to give a Target category lead one weekly Power BI view that quickly answers two questions: how are digital sales doing, and is fulfillment healthy? I would lead with a KPI scorecard because sales, orders, fulfillment, timeliness, and cancellations are parallel health measures, not steps in one funnel. The user should first see the selected week, category, and relevant channel filters, then the KPIs. From there, they should be able to drill into BOPIS or Ship-to-Home details without losing the selected context.
Useful Questions to Ask the Interviewer
What are the approved business definitions for Digital Sales, Orders, Fulfillment Rate, BOPIS ready-on-time, Ship-to-Home on-time delivery, and Cancellation Rate?
What defines the reporting week, time zone, and source-data cutoff?
What is the source grain for digital orders, fulfillment events, and order items?
Which dimensions are approved for filtering and drillthrough, such as category, product, store, market, fulfillment node, carrier, region, and calendar?
Which source should be treated as the trusted control source for reconciliation?
What refresh recency is required, and how should stale or failed refreshes be surfaced?
Do category leads, store teams, or other users require different row-level access?
How to Explain It in an Interview
I would explain the design as one path from governed data to a business decision.
First, I would use a KPI scorecard as the leading view. A funnel is appropriate when users need to follow sequential stages where records move from one step to the next. This question is different: Digital Sales, Orders, Fulfillment Rate, On-time / Ready-on-time, and Cancellation Rate are parallel weekly health measures. A scorecard lets the category lead scan those measures side by side. Higher is generally better for sales, orders, fulfillment, and timeliness, while lower is better for cancellations. I would not invent targets or thresholds; those would come from approved business definitions.
The top information hierarchy would start with the selected week and filters, including category and any applicable channel filter. The first decision layer would show:
Digital Sales: total sales for the selected weekly context.
Orders: total orders for the selected weekly context.
Fulfillment Rate: filled orders divided by total orders, using the approved business definition.
On-time / Ready-on-time: Ship-to-Home on-time delivery performance or BOPIS ready-within-SLA performance, depending on fulfillment mode.
Cancellation Rate: canceled orders divided by total orders, using the approved cancellation definition.
Behind the report, Power Query would handle source transformation and cleaning. The semantic model would separate descriptive dimensions from measurable events. Consistent with the diagram, descriptive tables can include DimProduct, DimStore, DimDate, DimFulfillment, and DimCustomer, while event facts can include FactOrders, FactFulfillment, and FactOrderItems. The exact production model should keep each fact at its declared grain and relate dimensions through clear keys. This star-style separation helps filtering, metric consistency, and maintainability.
I would keep business calculations in reusable DAX measures rather than hard-coding logic in individual visuals. Measures such as Sales, Orders, Fulfillment Rate, On-time Rate, and Cancellation Rate are evaluated in the report's filter context, so the same governed definition can respond consistently to week, category, store, market, fulfillment mode, carrier, or other approved dimensions. I would keep descriptive dimensions separate from measures and avoid using calculated columns for aggregations that should respond dynamically to filters.
For BOPIS, the drill path would be Category to Store / Market to Order / Item Detail. A category lead could start from a BOPIS KPI and investigate whether a problem is concentrated in particular stores, markets, orders, or items. For Ship-to-Home, the path would be Category to Fulfillment Node / Carrier, or Region where that is the approved operating dimension, and then to Order / Item Detail. That supports investigation of late deliveries, carrier issues, node-level problems, and item-level exceptions.
Power BI drillthrough should carry the selected week, category, and other intended filters into the detail page. I would test this explicitly because an incorrect drillthrough context can make a detail page disagree with the scorecard. The BOPIS and Ship-to-Home pages should use the same governed measures as the leading view rather than redefine them.
For refresh behavior, I would choose Import, DirectQuery, or another supported connectivity approach based on the actual source, model size, required freshness, source latency, and performance needs. I would not claim that one mode is always best. The report should make refresh recency or data latency visible when it could affect interpretation, and refresh failures should be detectable so the user does not act on stale data.
Before publishing, I would reconcile totals against a trusted source, such as the approved order-management control, at the same week, category, and filter scope. I would also check duplicate events, missing keys, null dimensions, missing periods, boundary dates, and mismatched fulfillment classifications. These data-quality issues can distort weekly KPIs even when the visual itself is correct.
If access differs by user role, I would apply row-level security so users see only permitted rows, then test representative roles before release. I would also check dashboard performance: unnecessary high-cardinality fields, inefficient relationships, expensive measures, too many visuals, or overly detailed queries can slow the report.
Finally, I would publish the scorecard and drillthrough pages to the appropriate workspace, share them with authorized users, and assign clear ownership for metric definitions, refresh monitoring, source changes, and validation. The business flow is simple: see weekly health, identify the metric that moved, drill into BOPIS or Ship-to-Home, find the operational driver such as a delay, cancellation, store, node, or carrier issue, validate it, and take action with the relevant store, supply-chain, or merchandising partners.
Technical Approach
Confirm KPI definitions, reporting week, time zone, source grain, source latency, access rules, and the trusted reconciliation source.
Transform and clean digital-order and fulfillment inputs in Power Query while preserving the required grain.
Build a star-style Power BI semantic model with descriptive dimensions separated from FactOrders, FactFulfillment, and FactOrderItems.
Create governed reusable DAX measures for Digital Sales, Orders, Fulfillment Rate, On-time / Ready-on-time, and Cancellation Rate.
Lead with week, category, and applicable channel filters plus a KPI scorecard rather than a funnel.
Add the BOPIS drill path: Category → Store / Market → Order / Item Detail.
Add the Ship-to-Home drill path: Category → Fulfillment Node / Carrier (or Region) → Order / Item Detail.
Preserve intended filter context through drillthrough and validate the detail totals against the originating KPIs.
Reconcile totals with the trusted source, check refresh recency and latency, and test model and report performance.
Apply row-level security where access differs, publish to the appropriate workspace, share with authorized users, and assign metric and refresh ownership.
Practical Insights
This is not mainly a Big-O algorithm problem. The important costs are semantic-model size, refresh time, source latency, query time, and report complexity. A clean star-style model and reusable DAX measures reduce duplicated logic and make the report easier to maintain. Import can make report interaction fast but depends on refresh freshness. DirectQuery can reduce data-copy latency but makes performance more dependent on the source and query design. More detailed drillthrough helps investigation but can increase query cost, so the final choice should balance freshness, speed, scale, and governance.
Why Interviewers Ask This
This tests whether the candidate can turn a weekly business-monitoring need into a clear Power BI information hierarchy, choose the right leading view, model reusable metrics correctly, design useful drill paths, and account for validation, refresh latency, security, performance, publishing, and ownership.
Common interview mistakes
Common mistakes are leading with a funnel even though the measures are not sequential stages; inventing KPI targets or sample values; mixing Power Query transformation with DAX business logic; failing to define fact-table grain before relationships; duplicating formulas across visuals instead of using reusable measures; using inconsistent denominators; losing week or category context during drillthrough; forcing BOPIS and Ship-to-Home into one incorrect hierarchy; ignoring source latency or stale refreshes; skipping control-total reconciliation; using calculated columns for logic that should be filter-responsive measures; applying row-level security without role testing; and publishing without checking semantic-model or dashboard performance.
Interview tip
Lead with the design decision: choose a KPI scorecard because the measures are parallel weekly health signals, not funnel stages. Then walk through the hierarchy from filters to KPIs to the separate BOPIS and Ship-to-Home drill paths. Finish with the semantic model, reusable DAX measures, validation, refresh latency, row-level security, performance, publishing, and ownership.
Interviewer may ask next
How would you validate that the BOPIS and Ship-to-Home drillthrough pages are showing the correct data after a user selects a week and category?
I would test known week-and-category combinations and compare each drillthrough page with both the originating KPI and the trusted source at the same filter scope. I would verify that the intended week, category, and other drillthrough filters carry to the detail page. I would also test duplicate events, multiple items per order, null or unmapped dimensions, boundary dates, and missing fulfillment classifications. If totals disagree, I would inspect grain, relationships, filter direction, Power Query transformations, and DAX measure definitions before publishing.
What would you change if the category lead needed near-real-time fulfillment monitoring instead of a weekly management dashboard?
I would keep the governed metric definitions and drill paths, but I would reassess connectivity, storage mode, source latency, refresh behavior, and the information hierarchy. A near-real-time use case may favor a more direct connection or another architecture that reduces refresh delay, but that can increase source load and make report performance more dependent on upstream systems. I would emphasize current exceptions and data-freshness indicators while preserving BOPIS and Ship-to-Home investigation paths. The final design would depend on source capabilities, acceptable latency, query volume, reliability, and governance constraints rather than assuming one Power BI mode is always best.
Data Analyst Resume Examples
Explore the resume examples below to find the one that best matches your target Data Analyst role.
Disclaimer: This interview guide is for educational and informational purposes only. It is designed to help readers prepare, but it does not guarantee any interview result, hiring decision, offer, or outcome. Interview questions, hiring criteria, and preferred answers can vary by employer, interviewer, industry, location, and time. All answers, examples, and explanations in this guide are suggested examples for interview preparation, not definitive answers or instructions for professional practice. They are based on research and judgment, are provided without warranties of any kind, and should be adapted to the question, role, and applicable laws and professional requirements. Diagrams are simplified illustrations intended to highlight the main concepts and their relationships; actual situations, systems, and practices may be more complex. Alternative approaches may be equally valid or better suited to a particular question, context, or interviewer. To the fullest extent permitted by applicable law, the contributors and publisher are not liable for decisions made, actions taken, or losses incurred based on this guide.
State Laws and Professional Responsibilities: Laws and requirements governing an occupation vary by state and jurisdiction. You are responsible for checking the current laws, licensing requirements, and scope-of-practice rules that apply to your location and role, and for ensuring that your answers and actions comply with them. Adapt examples in this guide to those requirements. This guide is not legal advice.
Company Notice: This guide is an independent educational resource and is not affiliated with, endorsed by, sponsored by, or approved by the company named in this guide. Company names identify reported interview experiences or the employer context of clearly labeled original practice exercises. Interview practices can change without notice, and inclusion of company-specific content does not mean these questions are official, complete, or guaranteed to be asked. To the fullest extent permitted by law, the author, contributors, and publisher are not responsible for outcomes related to use of this material.
Content Accuracy and Verification: To the fullest extent permitted by applicable law, we do not represent or warrant that interview guides, questions, answers, examples, or diagrams are accurate, complete, current, error-free, or suitable for any particular purpose. You are responsible for independently reviewing and verifying the information before relying on it.