11. An ALB is healthy, but 20% of requests return 502. How do you isolate the failing hop?
Correlate ALB access logs, target health and reason codes, connection metrics, any intermediate NLB observations, application logs, traces, and deployment versions for the same request population. Separate failures generated by the load balancer from target resets, timeouts, malformed responses, port or protocol mismatch, and application errors. State what a passing health check proves and what it cannot prove about real requests.
I would correlate the same failing requests across ALB logs, target health, connection signals, optional NLB evidence, application telemetry, traces, and deployment versions. I would first separate ALB-returned 502s from target-returned 502s, identify the first failing hop, correct that boundary, and verify the 502 rate returns to baseline.
The system passes its simple health test, but one out of every five real requests still fails. The goal is to find the first place where those failing requests stop working correctly. I would compare evidence from each step of the request journey during the same time period. I would also check whether failures appeared after a release, settings change, or scaling event. Passing a simple health test only proves that one configured test request works. It does not prove that normal customer requests, heavier traffic, connected services, or every running application version work correctly.
- Are clients receiving the 502 directly from the ALB, and is there an intermediate NLB anywhere in the affected request path?
- Are ALB access logs available, and can requests be correlated with timestamps, request IDs, or trace IDs?
- Did the 20% failure rate begin after a deployment, configuration change, scaling event, or target replacement?
- Are failures concentrated on specific targets, Availability Zones, deployment versions, routes, or request types?
- What protocol, port, path, thresholds, and accepted response codes are configured for the target health check?
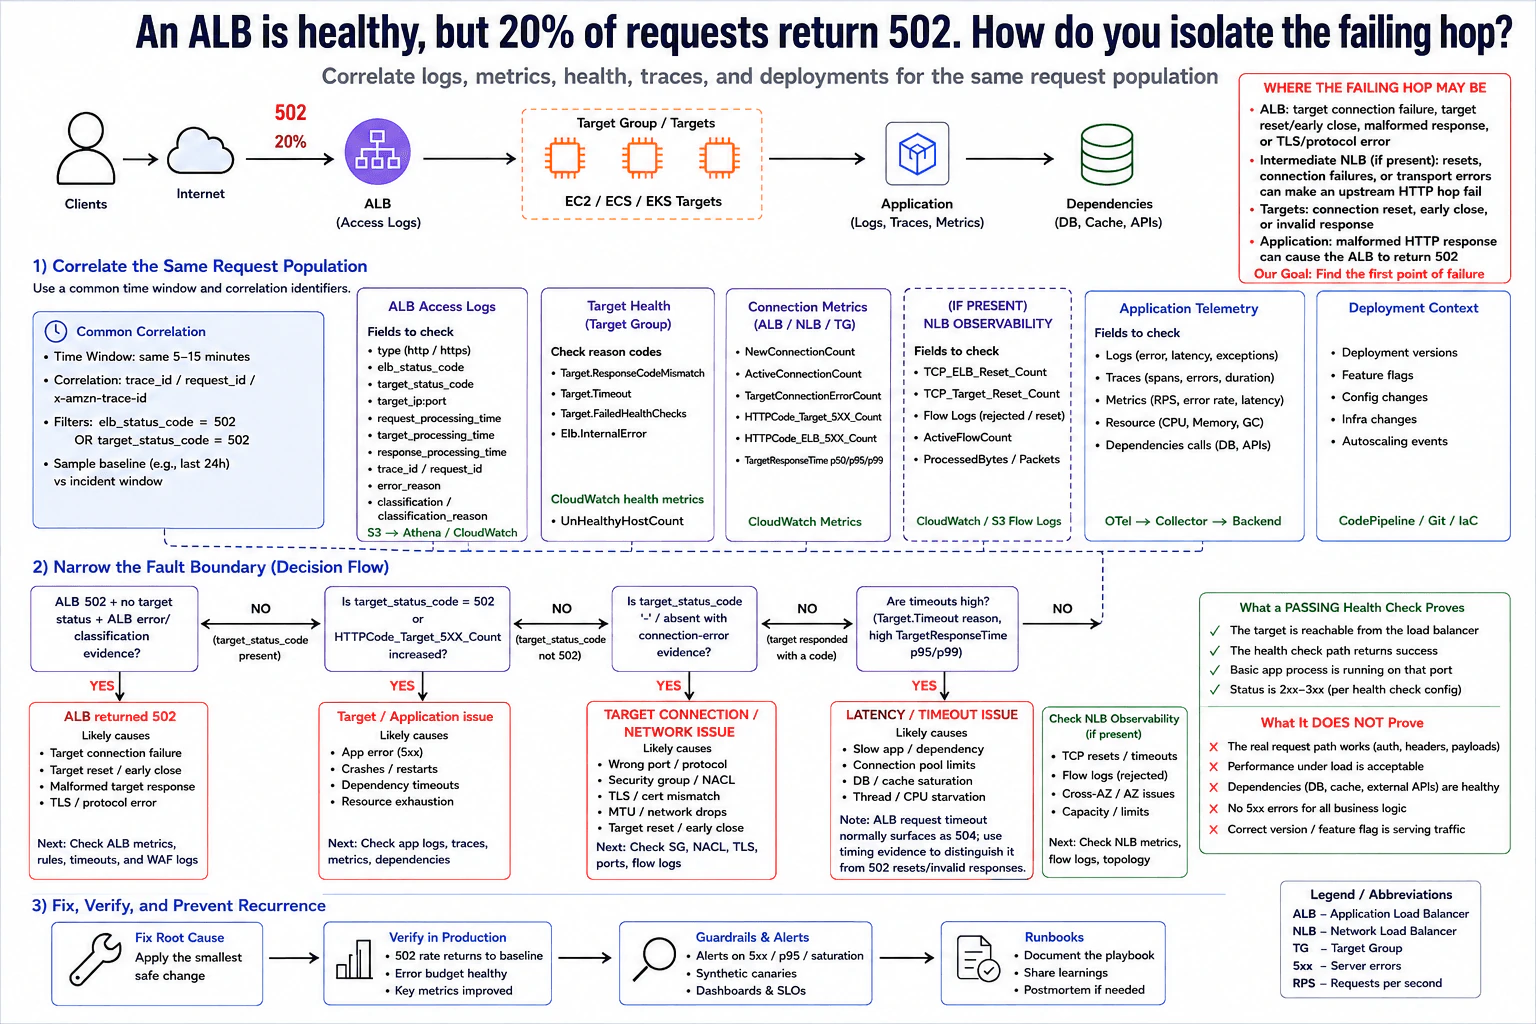
I would treat this as a fault-boundary isolation problem. First I define one incident window and preserve evidence before changing code or configuration. Then I correlate the same request population across ALB access logs, target health, connection metrics, application telemetry, traces, optional NLB observations, and deployment versions.
I start with the ALB access log because it tells me what the ALB returned and what it observed from the target. I compare elb_status_code, target_status_code, target:port, request_processing_time, target_processing_time, response_processing_time, trace_id, error_reason, classification, and classification_reason when populated. If target_status_code is 502, the target produced an HTTP 502, so I move into application logs and traces. If the ALB returned 502 while the target status is missing and the ALB has connection, protocol, or response-classification evidence, I investigate the ALB-to-target boundary.
For that boundary, I look for target connection failures, resets or early closes, malformed HTTP responses, incorrect target port or protocol, TLS problems, security-group or network-ACL issues, and network-path problems. Connection metrics such as TargetConnectionErrorCount, connection counts, and reset-related evidence help show whether failures cluster around transport behavior. I correlate metrics by the same incident window because aggregate metrics do not identify an individual request by themselves.
Next I examine target health. Target-health reason codes such as Target.ResponseCodeMismatch, Target.Timeout, Target.FailedHealthChecks, and Elb.InternalError describe why a target may not be considered healthy. UnHealthyHostCount is different: it is a CloudWatch health metric, not a reason code. A passing health check proves that the load balancer can reach the target using the configured health-check protocol and port and that the configured health-check path returns an accepted result. It does not prove that real request paths, authentication, headers, payloads, dependencies, capacity under load, every business route, or the intended deployment version work correctly.
If the target returned 502, I correlate the request or trace identifier with application logs and distributed traces. I look for the first failing span or application event, including application-generated 5xx responses, malformed HTTP responses, crashes or restarts, connection-pool exhaustion, downstream database, cache, or API failures, and other resource pressure. Traces may be sampled, so the absence of a trace is not proof that a request did not occur. Logs and metrics still need to be correlated.
If an NLB is actually present in the architecture, I inspect it as an additional transport hop. I look for TCP resets, connection failures, rejected flow evidence, Availability Zone patterns, and capacity indicators. An NLB works at the transport layer and does not itself create an HTTP 502 response, but a reset or failed connection at that hop can cause an upstream HTTP component to fail the request.
I also treat timeout evidence separately. Target.Timeout, high target response time, slow application work, saturated connection pools, database or cache waits, and CPU pressure can identify a latency problem. However, an ALB request timeout normally appears as HTTP 504, so I do not label every timeout as a 502. I use timing evidence to distinguish timeout failures from 502 cases caused by resets, connection failures, early closes, or malformed responses.
Finally, I overlay deployment versions, feature flags, configuration changes, infrastructure changes, and scaling events on the failure timeline. A 20% failure rate can mean that only a subset of targets or one application version is bad. Once the evidence identifies the first failing boundary, I make the smallest safe correction supported by that evidence, such as correcting the target port or protocol, TLS configuration, network policy, malformed response, application defect, dependency issue, or faulty deployment.
For verification, I use the same production signals. The 502 rate should return to its normal baseline, the associated connection or application errors should disappear, target health should remain stable, and key latency and error indicators should improve. For prevention, I define a user-facing availability SLI, such as successful request ratio, and an appropriate SLO before choosing alert thresholds. I alert on sustained 5xx symptoms and error-budget impact with ownership, severity, runbook context, and noise controls. Dashboards should correlate ALB 5xx, target 5xx, target health, latency, application telemetry, and deployment versions. I also control trace sampling, retention, ingestion cost, high-cardinality attributes, clock skew, and missing telemetry, and I redact credentials, tokens, personal information, and sensitive payloads.
- Define the incident time window and preserve evidence before making changes.
- Correlate the same failing request population using timestamps, target address, request IDs, or trace IDs.
- Inspect ALB access logs and compare elb_status_code with target_status_code plus ALB error or classification evidence.
- If the target returned 502, investigate application logs, traces, dependencies, crashes, malformed responses, and resource pressure.
- If the ALB returned 502 without a valid target response, inspect target connection failures, resets or early closes, port and protocol configuration, TLS, security groups, network ACLs, and network-path evidence.
- Review target-health reason codes separately from CloudWatch health metrics such as UnHealthyHostCount.
- Inspect connection and reset metrics for patterns aligned with the same failure window.
- If an intermediate NLB exists, inspect its TCP reset, connection, flow, Availability Zone, and capacity evidence as an additional transport hop.
- Treat timeout evidence as a separate branch because an ALB request timeout normally surfaces as 504 rather than 502.
- Correlate failures with deployment versions, feature flags, configuration changes, infrastructure changes, and scaling events.
- Apply only the smallest correction supported by the evidence.
- Verify that the 502 rate returns to baseline and that health, connection, application, and latency signals improve, then add SLO-based alerts, dashboards, and a runbook.
The investigation becomes more expensive as traffic volume, target count, telemetry volume, and retention increase. ALB access logs can generate large data sets, while distributed traces consume more storage as sampling increases. High-cardinality values such as unrestricted request IDs should be used for logs and traces rather than careless metric labels because they can make metric systems expensive. Longer retention increases storage and query cost. Sampling lowers trace cost but can miss rare failures, so traces should be supported by logs and metrics. Operators must also account for missing telemetry, different system clocks, ingestion delays, maintenance effort, and privacy controls.
This question tests whether the candidate can isolate an intermittent production failure with correlated evidence instead of assuming that healthy targets mean the real request path is healthy. A strong answer distinguishes an ALB-returned 502 from a target-returned 502, follows the request boundary through network and application evidence, understands the limits of health checks, correlates failures with deployment versions, and makes the smallest correction supported by evidence.
Common mistakes are assuming that healthy targets prove real requests are healthy, treating every ALB 502 as an application-generated 502, or relying on one metric without correlating the same request population. Another mistake is treating UnHealthyHostCount as a target-health reason code. Do not assume an NLB exists in every architecture or claim that an NLB itself generates HTTP 502. Do not classify every timeout as 502 because an ALB request timeout normally appears as 504. Other mistakes include changing configuration before preserving evidence, ignoring deployment versions, treating missing sampled traces as proof, mixing unrelated time windows, and logging credentials or sensitive payloads.
Explain the investigation as a request-by-request fault-boundary exercise. Start with ALB versus target status evidence, then walk through target health, connection behavior, application telemetry, optional NLB evidence, and deployment versions. Explicitly state what a passing health check proves and what it cannot prove about real traffic.