8 Netflix DevOps Engineer Interview Questions & Answers

netflix icon

Questions with Detailed ExplanationsWith Detailed Explanations

(Last Updated: September 1, 2026)

1. What is the difference between Layer 4 and Layer 7 load balancing?Cloud InfrastructureEasyNetflix

Question Details

Compare the two load-balancing boundaries for a cloud-hosted service. Cover the traffic unit each layer understands, available routing inputs, connection and TLS termination, health checking, protocol support, client-address visibility, connection reuse, failure behavior, and the workload characteristics that would make one layer preferable to the other.

Short Interview Answer (30-60 seconds)

At a high level, Layer 4 and Layer 7 load balancers make routing decisions using different information. The main challenge is choosing between simple connection-level routing and richer application-aware routing. I would compare two paths. Layer 4 routes TCP or UDP connections using transport details. Layer 7 understands HTTP or HTTPS requests and can route by host, path, headers, or cookies. Layer 7 gives more control, but it usually requires more processing.

Detailed Explanation

The goal is to decide how incoming traffic should be spread across healthy backend services. The important difference is how much each load balancer understands about the traffic. Layer 4 mainly sees connection information. Layer 7 can understand application requests and make more detailed decisions. This choice affects routing, TLS handling, health checks, client IP visibility, connection reuse, and failure handling. I would explain the design by looking at Layer 4 first, then Layer 7, and finally choosing between them based on the workload.

Useful Questions to Ask the Interviewer
  1. Does the service need TCP or UDP routing, or HTTP-aware routing?
  2. Do we need routing by host, URL path, headers, query values, or cookies?
  3. Where should TLS encryption be terminated?
  4. Does the backend need the original client IP address?
  5. Do we need application-level health checks or request retries?
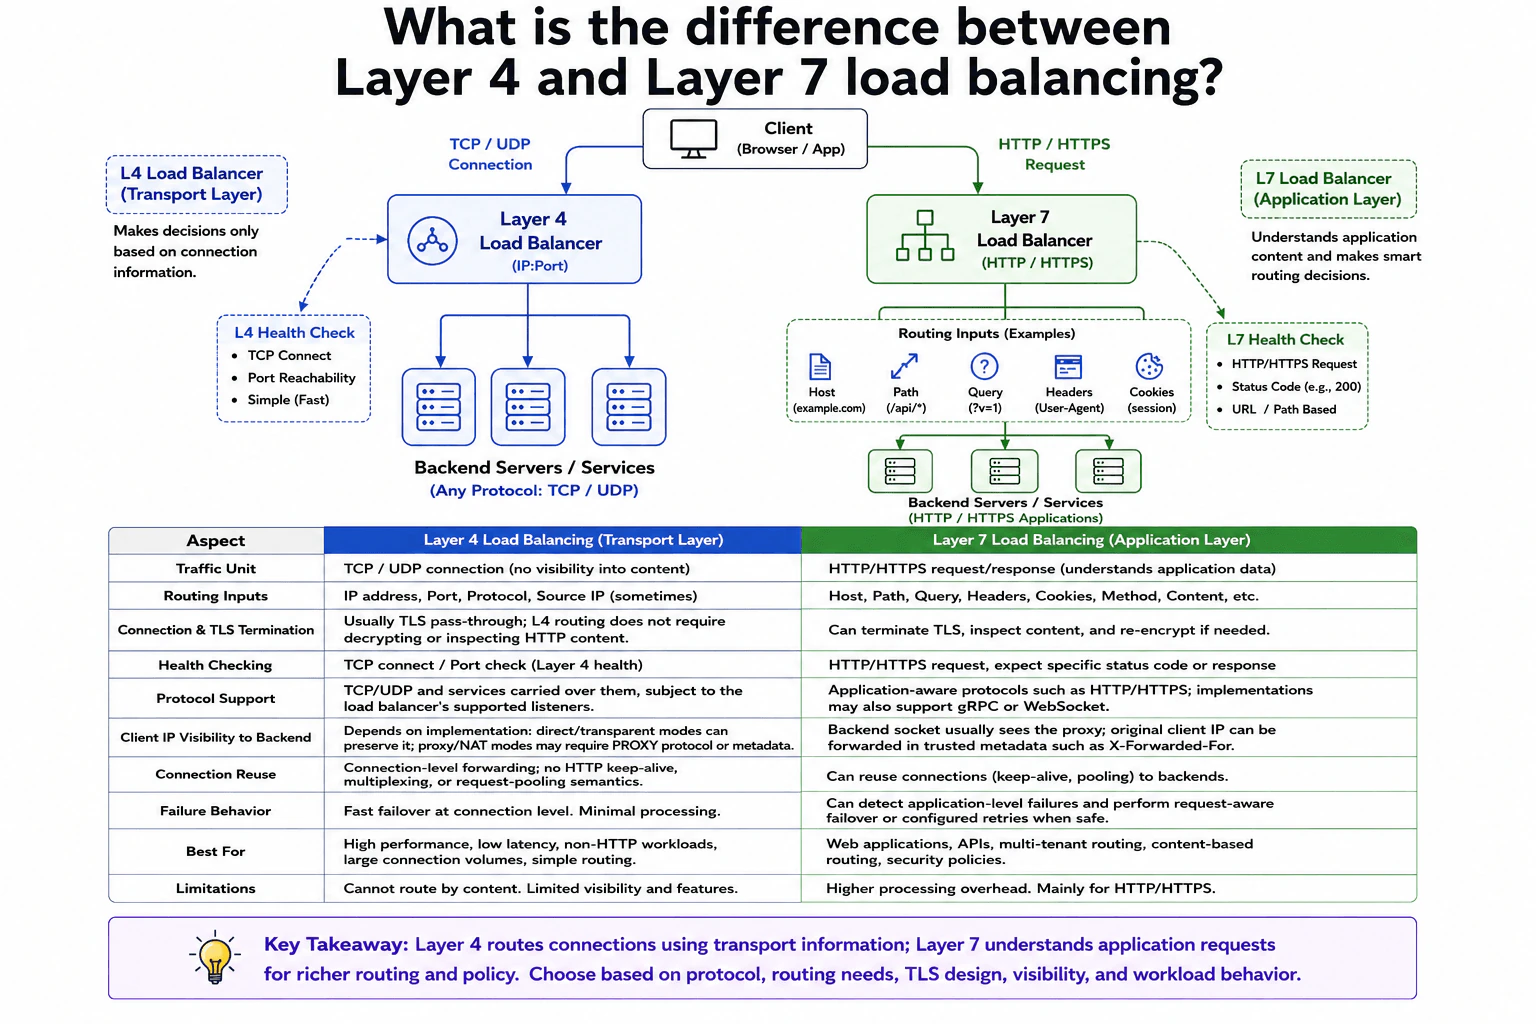
What is the difference between Layer 4 and Layer 7 load balancing? diagram
How to Explain It in an Interview
1. Explain what each layer understands

Layer 4 works at the transport layer. It routes a TCP or UDP connection using information such as IP address, port, protocol, and sometimes source IP. It does not need to inspect the HTTP content inside the connection.

Layer 7 works at the application layer. It understands requests such as HTTP or HTTPS. It can route using the host, URL path, query values, headers, cookies, method, or other application content.

2. Explain the Layer 4 path

For Layer 4, the client creates a TCP or UDP connection. The Layer 4 Load Balancer chooses a healthy Backend Server or Service using connection information. A Layer 4 health check can test whether a TCP connection succeeds or whether a port is reachable.

TLS commonly passes through because the load balancer does not need to decrypt HTTP content. Client IP visibility depends on the implementation. Direct or transparent modes can preserve it. Proxy or NAT modes may need PROXY protocol or other metadata.

3. Explain the Layer 7 path

For Layer 7, the client sends an HTTP or HTTPS request. The Layer 7 Load Balancer understands the request and can make a more specific routing decision. For example, it can choose a backend using the host, path, query value, headers, or cookies.

It can terminate TLS, inspect the request, and encrypt traffic again before sending it to a backend. Its health checks can send HTTP or HTTPS requests and expect a specific status code or response. The backend socket usually sees the proxy address. The original client IP can be passed in trusted metadata such as X-Forwarded-For.

Layer 7 mainly handles application-aware protocols such as HTTP and HTTPS. Some implementations also support gRPC or WebSocket.

4. Compare connection reuse and failures

Layer 4 performs connection-level forwarding. It does not provide HTTP keep-alive, multiplexing, or request-pooling behavior itself. If a backend becomes unhealthy, new connections can be directed to another healthy backend. An already established connection may still fail and need the client to reconnect.

Layer 7 can reuse backend connections with keep-alive or connection pooling. It can also detect application-level failures. When configured safely, it may perform request-aware failover or retries.

5. Choose based on the workload

Layer 4 fits simple routing, high connection volumes, non-HTTP workloads, and cases where low processing overhead matters. Layer 7 fits web applications, APIs, multi-tenant routing, content-based routing, and security policies. The main trade-off is simple connection routing versus richer application control. The choice should follow the protocol, routing needs, TLS design, client visibility, failure behavior, and workload requirements.

Practical Complexity & Trade-offs

The benefit of Layer 4 is simplicity. It can route TCP or UDP connections without understanding the application data inside them. This usually means less processing and works well for non-HTTP traffic. The downside is limited routing control because it cannot choose a backend from a URL path, header, or cookie. Layer 7 gives richer routing and can handle TLS and application-level health checks. It can also reuse backend connections and react to application failures. The downside is more processing and more rules to manage. The right choice depends on what the workload actually needs.

Why Interviewers Ask This

Interviewers ask this question to see whether you understand where load-balancing decisions happen in the network stack. They want to know if you can connect protocol choice with routing, TLS handling, health checks, client IP visibility, connection reuse, failures, and workload needs. The important skill is not memorizing Layer 4 and Layer 7 definitions. It is explaining why one boundary fits a particular service better.
Interviewer may ask next
What would change if the service needed path-based routing for several APIs behind one endpoint?

I would use the Layer 7 path because the routing decision now depends on application information. The Layer 7 Load Balancer can inspect the HTTP request path and send different requests to different Backend Servers or Services. For example, one URL path can go to one API group while another path goes to another group.

The Layer 4 design is not enough for this requirement because it mainly sees connection information such as IP address, port, and protocol. It does not need to understand the URL path inside an HTTP request.

The Layer 7 Load Balancer can also perform HTTP health checks for each backend group. If TLS terminates there, it can inspect the request before routing it and then encrypt the backend connection again if needed. The original client IP can be forwarded using trusted metadata such as X-Forwarded-For.

The downside is more processing and more routing rules to configure and maintain.

What would you choose for a high-volume TCP service that does not use HTTP?

I would start with the Layer 4 design because the service only needs TCP connection routing. The Layer 4 Load Balancer can choose a healthy Backend Server or Service using supported connection information such as IP address, port, and protocol. It does not need to understand application content.

Health checks can stay simple. The load balancer can test whether a TCP connection succeeds or whether the service port is reachable. TLS can also pass through when the load balancer does not need to inspect encrypted application data.

I would still check how client IP visibility works in the chosen implementation. Direct or transparent forwarding may preserve it. Proxy or NAT designs may need PROXY protocol or metadata.

If a backend becomes unhealthy, new connections can go to another healthy backend. Existing connections may still break and require reconnecting. The main downside is that Layer 4 cannot route by URL path, HTTP header, cookie, or other application content.

2. How would you design least-privilege cloud IAM for Kubernetes clusters?Cloud InfrastructureMediumNetflix

Question Details

Define separate principals and trust boundaries for human administrators, cluster components, deployment automation, and application workloads. Cover cloud IAM, Kubernetes RBAC, workload identity, namespace and resource scope, temporary elevation, credential rotation, node permissions, admission controls, audit logs, cross-account access, revocation, and tests that prove each principal can perform required operations but cannot cross its intended boundary.

Short Interview Answer (30-60 seconds)

At a high level, I would give every Kubernetes actor its own identity and only the permissions it needs. The main challenge is stopping human, automation, node, and workload access from crossing trust boundaries. I would explain three paths: human and CI/CD access, workload access to cloud services, and policy plus audit controls. Kubernetes RBAC limits cluster actions, workload identity uses short-lived tokens, and admission rules block unsafe workloads. The trade-off is more identity and policy management.

Detailed Explanation

The goal is to let each person or system perform its required job without giving it extra power. The difficult part is that administrators, deployment tools, cluster nodes, cluster components, and applications all need different access. A stolen identity must not open unrelated parts of the environment. The design handles this by separating identities, limiting their cloud and Kubernetes permissions, checking workloads before they run, recording important activity, and testing both allowed and denied actions.

Useful Questions to Ask the Interviewer
  1. Do administrators need permanent write access, or should privileged access always be temporary?
  2. Which namespaces contain the most sensitive workloads and data?
  3. Do application workloads need access to resources in other cloud accounts?
  4. Are signed images and restricted pod security required for every namespace?
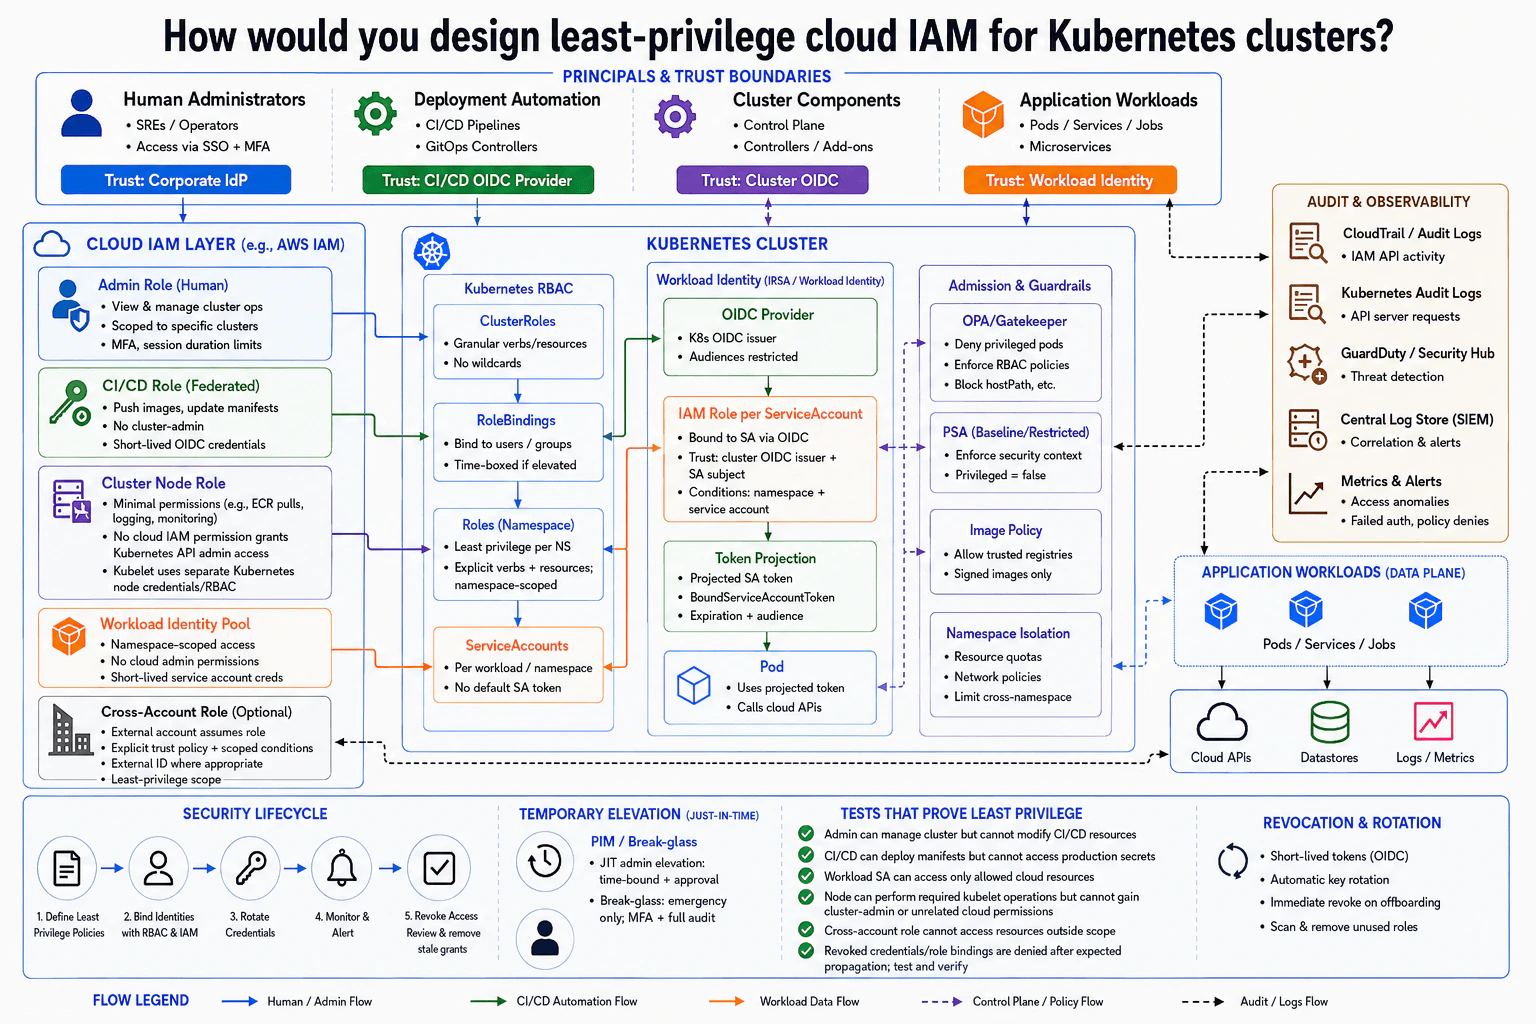
How would you design least-privilege cloud IAM for Kubernetes clusters? diagram
How to Explain It in an Interview
1. Separate principals and trust boundaries

I would start by giving each actor a separate identity. Human Administrators sign in through the Corporate IdP with SSO and MFA. Deployment Automation trusts the CI/CD OIDC Provider. Cluster Components use the cluster identity. Application Workloads use Workload Identity. This limits how far one stolen credential can reach.

2. Limit cloud IAM permissions

The Cloud IAM Layer gives each principal a narrow role. The Admin Role is scoped to specific clusters and has session limits. The CI/CD Role can push images and update manifests, but it is not cluster-admin. The Cluster Node Role only gets minimal cloud permissions for tasks such as image pulls, logging, and monitoring. Kubernetes node access uses separate node credentials and RBAC. The Workload Identity Pool keeps application cloud access namespace-scoped and avoids broad cloud-admin permissions. The optional Cross-Account Role requires an explicit trust policy, scoped conditions, and an External ID where appropriate.

3. Use Kubernetes RBAC for cluster actions

Inside the Kubernetes Cluster, RBAC controls which actions each subject can perform. ClusterRoles define allowed verbs and resources without broad wildcards. RoleBindings connect users, groups, or service accounts to those permissions. Namespace Roles keep access inside one namespace and use explicit verbs and resources. ServiceAccounts are created per workload or namespace. This prevents deployment automation or one application from automatically reaching unrelated workloads.

4. Give workloads short-lived cloud access

For cloud API access, the workload uses the Workload Identity path. The OIDC Provider identifies the Kubernetes service account. The IAM Role per ServiceAccount trusts the cluster OIDC issuer and service-account subject. It also checks the namespace and service-account name. Token Projection gives the Pod a short-lived, audience-bound token. The Pod uses that token to call only approved Cloud APIs. Workloads can also reach approved Datastores and emit Logs and Metrics through the data-plane paths shown in the diagram.

5. Add admission controls and auditing

Admission & Guardrails provide another security layer. OPA/Gatekeeper denies privileged workloads and enforces policy. PSA applies baseline or restricted pod security. Image Policy permits trusted, signed images. Namespace Isolation uses resource quotas and Network Policies to limit cross-namespace access. CloudTrail or Audit Logs record cloud IAM activity. Kubernetes Audit Logs record API requests. GuardDuty or Security Hub detects threats. The Central Log Store, SIEM, and Metrics & Alerts support investigation and alerting.

6. Use temporary elevation, revocation, and boundary tests

Normal access stays small. JIT admin elevation is time-bound and requires approval. Break-glass access is emergency-only, protected by MFA, and fully audited. Credentials are short-lived or rotated. Stale roles are removed. Revoked credentials and role bindings are tested after expected propagation. I would verify negative cases too. CI/CD must not read production secrets. Workloads must not reach unapproved cloud resources. Nodes must perform required kubelet operations without gaining cluster-admin or unrelated cloud permissions. The downside is more policy, identity, and testing work.

Practical Complexity & Trade-offs

The benefit is that one stolen identity has a smaller impact. Human access, CI/CD access, node permissions, and workload permissions stay separate. Short-lived tokens also reduce the value of leaked credentials. Admission controls add another safety check before workloads run. The downside is more configuration. Teams must manage cloud roles, Kubernetes RBAC, service accounts, trust rules, namespace rules, and policy checks together. Temporary elevation also needs an approval process. Audit logs and access tests add operational work. We accept this extra work because it limits mistakes and makes unexpected access easier to detect.

Why Interviewers Ask This

Interviewers ask this to see whether you understand that Kubernetes security needs several permission layers. They want to know if you can separate identities, limit cloud and cluster access, avoid long-lived credentials, and handle emergency access safely. They also want evidence that you test denied actions, not only successful ones. The question mainly tests security judgment, trust-boundary thinking, and clear explanation.

Interviewer may ask next
How would you change this design if administrators should have no permanent privileged cluster access?

I would keep the same architecture, but privileged human access would always use the Temporary Elevation path. Human Administrators would still authenticate through the Corporate IdP with SSO and MFA. Their normal Admin Role and Kubernetes bindings would allow only routine or low-risk operations.

When someone needs a privileged change, JIT admin elevation would grant a time-bound cloud role and the matching Kubernetes permission after approval. The RoleBinding should expire with that elevation. Every elevated action would still appear in CloudTrail or Audit Logs and Kubernetes Audit Logs. Break-glass access would stay separate for emergencies and would require MFA with full auditing.

I would test revocation after the approved period ends. The administrator should then fail when attempting the same privileged action.

The main downside is slower emergency work because engineers may need approval before making sensitive changes.

How would you handle an application workload that needs access to a resource in another cloud account?

I would keep the existing Workload Identity path and extend it through the Cross-Account Role. The Pod would still receive a short-lived projected service-account token. Its IAM Role per ServiceAccount would still be restricted by the cluster OIDC issuer, service-account subject, namespace, and service-account name.

That workload role would be allowed to assume only the specific Cross-Account Role it needs. The destination account would use an explicit trust policy with scoped conditions. An External ID can also be required where appropriate. The cross-account role would expose only the exact resource actions needed by that workload.

I would test both the allowed and denied paths. The workload should reach the approved external resource, but attempts to use another account, another role, or unrelated resources should fail and appear in the audit logs.

The downside is extra trust-policy management across accounts.

3. How would you deliver multi-region failover in three weeks when DNS cutover is not allowed?Cloud InfrastructureHardNetflix

Question Details

Design a realistic cloud failover path under the stated deadline and prohibition on DNS-based switching. Define the existing and target regional boundaries, traffic-steering mechanism, health and capacity inputs, data replication and write authority, dependency readiness, connection behavior, security, observability, staged validation, rollback, failure during failover, cost, and the scope you would explicitly defer rather than claim can be completed safely.

Short Interview Answer (30-60 seconds)

At a high level, the goal is to fail over to a healthy second region without changing DNS. The main challenge is moving traffic safely while keeping one clear write owner and enough standby capacity. I would explain this in three parts: traffic steering, regional promotion, and recovery. The Global Traffic Manager uses health and capacity signals to move new connections. Data copies asynchronously to a warm standby, which stays read-only until promotion. The trade-off is extra cost and possible replication delay.

Detailed Explanation

The goal is to keep the service available when the primary region has a serious problem. We must do this without changing the client-facing DNS setup. The difficult part is moving traffic, protecting writes, and making sure the second region has enough capacity. The diagram solves this with the same client endpoints, a Global Traffic Manager, an active primary region, and a warm standby region. Data is copied to the standby in the background. Only one region accepts writes at a time, and recovery has a controlled rollback path.

Useful Questions to Ask the Interviewer
  1. Which existing IPs and domains must remain unchanged?
  2. How much data delay is acceptable during regional failover?
  3. Which dependencies must be reachable from both regions?
  4. How much standby capacity can remain running before a failure?
  5. Does standby write promotion require human approval?
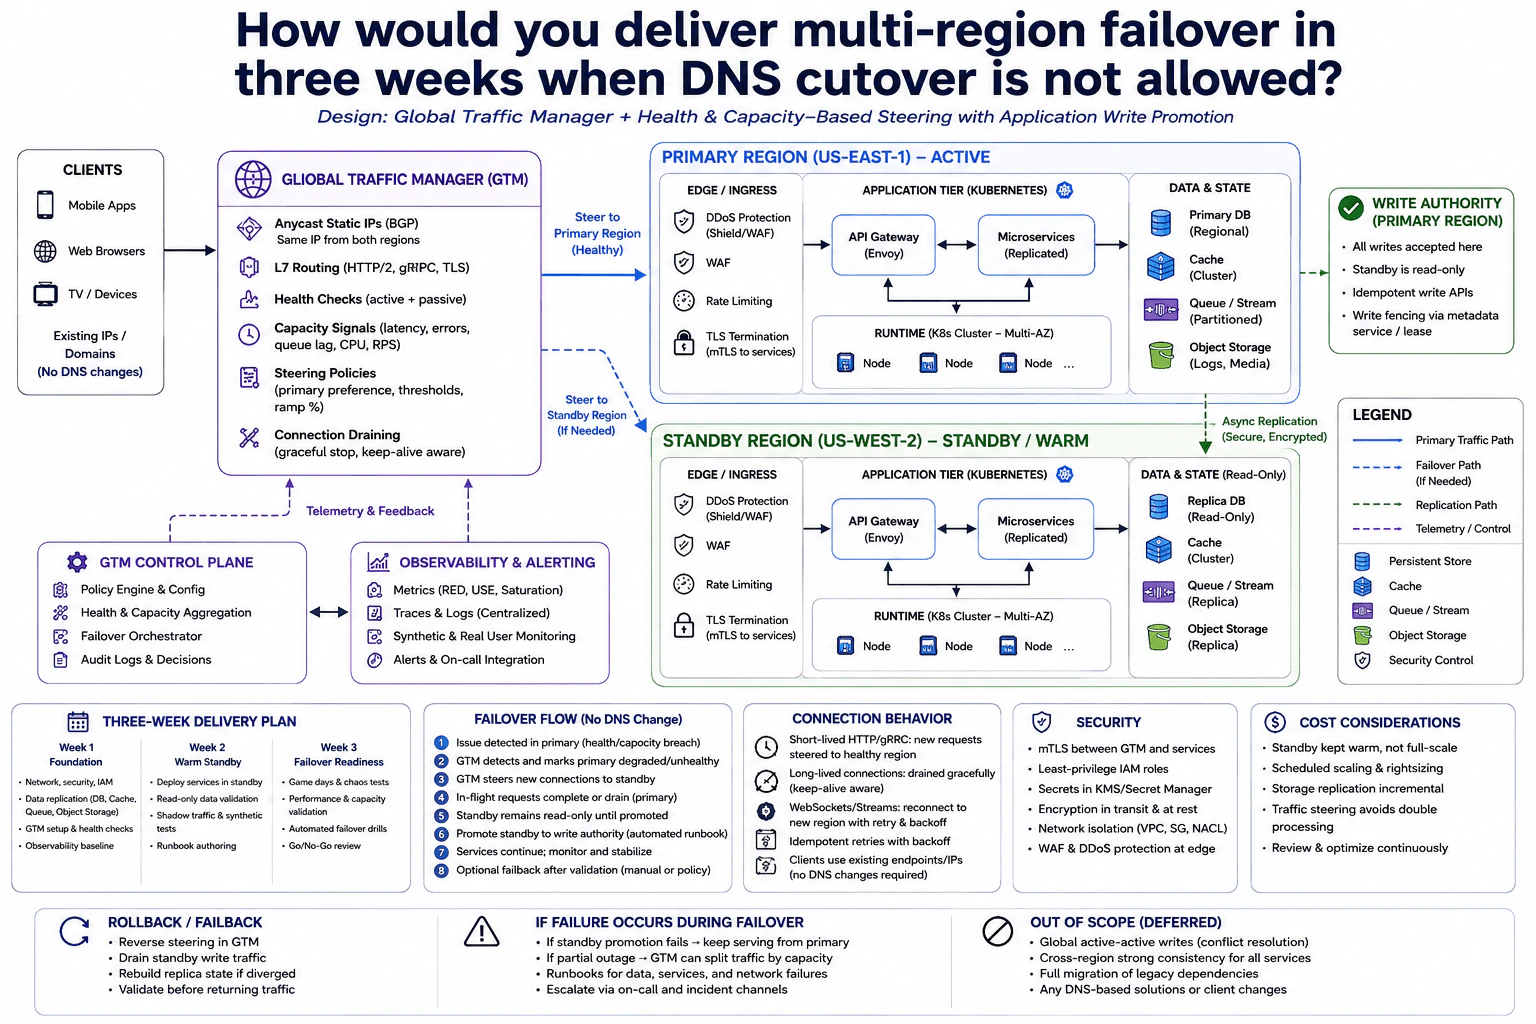
How would you deliver multi-region failover in three weeks when DNS cutover is not allowed? diagram
How to Explain It in an Interview
1. Keep the existing client entry point

I would keep the existing IPs and domains so clients need no DNS change. Mobile apps, web browsers, and TV devices continue using the same endpoints.

The Global Traffic Manager, or GTM, uses Anycast static IPs advertised with BGP. It also performs Layer 7 routing for HTTP/2, gRPC, and TLS traffic. Active and passive health checks show whether a region is healthy. Capacity signals include latency, errors, queue lag, CPU, and requests per second. Steering policies use primary preference, thresholds, traffic ramp percentages, and failback rules.

2. Run normally from the primary region

Healthy traffic goes to the active US-EAST-1 region. The edge applies DDoS protection, WAF filtering, rate limiting, and TLS termination with mTLS toward services.

Requests then reach the Envoy API Gateway and replicated microservices. They run in a multi-AZ Kubernetes cluster. The primary database accepts writes. The application also uses a cache cluster, a partitioned queue or stream, and object storage for logs or media.

3. Keep the standby warm and read-only

US-WEST-2 contains the same main application layers but stays warm instead of running at full scale. Its database is a read-only replica.

The primary copies data to the standby asynchronously over an encrypted replication path. This can create a small delay, so the replica may be slightly behind. The design keeps one write authority to avoid conflicting writes. Write APIs are idempotent, meaning a retry does not create the same change twice. Write fencing uses a metadata service or lease so only the promoted region can write.

4. Fail over without changing DNS

If the primary becomes unhealthy or lacks capacity, the GTM marks it degraded or unavailable. New short-lived HTTP or gRPC connections are steered toward the standby.

Long-lived connections are drained gracefully where possible. WebSocket or streaming clients reconnect to the new region and retry with backoff. The standby remains read-only until the promotion runbook gives it write authority. Operators then watch metrics, traces, logs, synthetic checks, real-user monitoring, alerts, and audit decisions while traffic stabilizes.

5. Validate, roll back, and control scope

Week one builds networking, security, data replication, GTM setup, and the observability baseline. Week two deploys the warm standby, validates read-only behavior, shadows traffic with synthetic tests, and prepares runbooks. Week three runs game days, chaos tests, performance checks, automated failover drills, and a Go or No-Go review.

If promotion fails and the primary is still usable, traffic stays on the primary. During a partial outage, GTM may split traffic according to available capacity. Rollback reverses GTM steering, drains standby write traffic, rebuilds replica state if it diverged, and validates health before traffic returns.

I would defer global active-active writes, cross-region strong consistency for every service, full migration of legacy dependencies, and DNS-based changes. Those changes are too large to promise safely in three weeks.

Practical Complexity & Trade-offs

The benefit is that clients keep the same endpoints, so failover does not depend on a DNS switch. A warm standby gives us real capacity in another region. The downside is cost because that region must stay running and keep data copied. Asynchronous replication can also leave the standby slightly behind. Keeping only one write authority makes data safer, but promotion adds an extra step during failover. Connection draining and retries reduce disruption, but long-lived clients may reconnect. We accept these limits because they make the three-week plan safer and more realistic.

Why Interviewers Ask This

The interviewer wants to see whether you can make safe choices under a hard deadline and a networking restriction. They are testing your judgment about traffic steering, regional capacity, write ownership, replication, connection handling, security, monitoring, rollback, and cost. They also want to see whether you can control scope instead of promising risky active-active features that cannot be delivered safely in three weeks.

Interviewer may ask next
What would you change if the standby had to accept writes before the primary region was completely unavailable?

I would keep one write authority rather than simply allowing both regions to write. The current design avoids conflicting updates by making the primary writable and the standby read-only.

Before moving write traffic, I would use the promotion runbook to stop or fence writes in the primary. Write fencing means the old region loses permission to make new changes. The metadata service or lease then gives write authority to the standby. Only after that step would the GTM steer write traffic toward the promoted region.

Idempotent write APIs would protect retries during the transition. Monitoring and audit logs would also confirm that only one region holds write authority.

The downside is that writes may pause briefly while ownership changes. Supporting simultaneous writes in both regions would require active-active conflict handling, which the diagram explicitly places outside the three-week scope.

What would you do if the warm standby did not have enough capacity during failover?

I would avoid moving all traffic to the standby at once. The GTM already uses health and capacity signals, so I would use those signals to control the traffic ramp.

The steering policy can increase standby traffic gradually while watching latency, errors, queue lag, CPU, and requests per second. If the standby reaches its safe limit, the GTM can stop increasing the ramp. During a partial outage, it can also split traffic according to available capacity when the primary can still serve some requests.

I would test this before production during week three. Game days, chaos tests, performance checks, and automated failover drills show whether the warm standby needs more scheduled capacity.

The downside is cost. Keeping more standby capacity makes failover safer, but it means paying for resources that handle little or no normal production traffic.

4. How would you debug a Kubernetes service that works inside the cluster but fails behind a load balancer?Containers And KubernetesEasyNetflix

Question Details

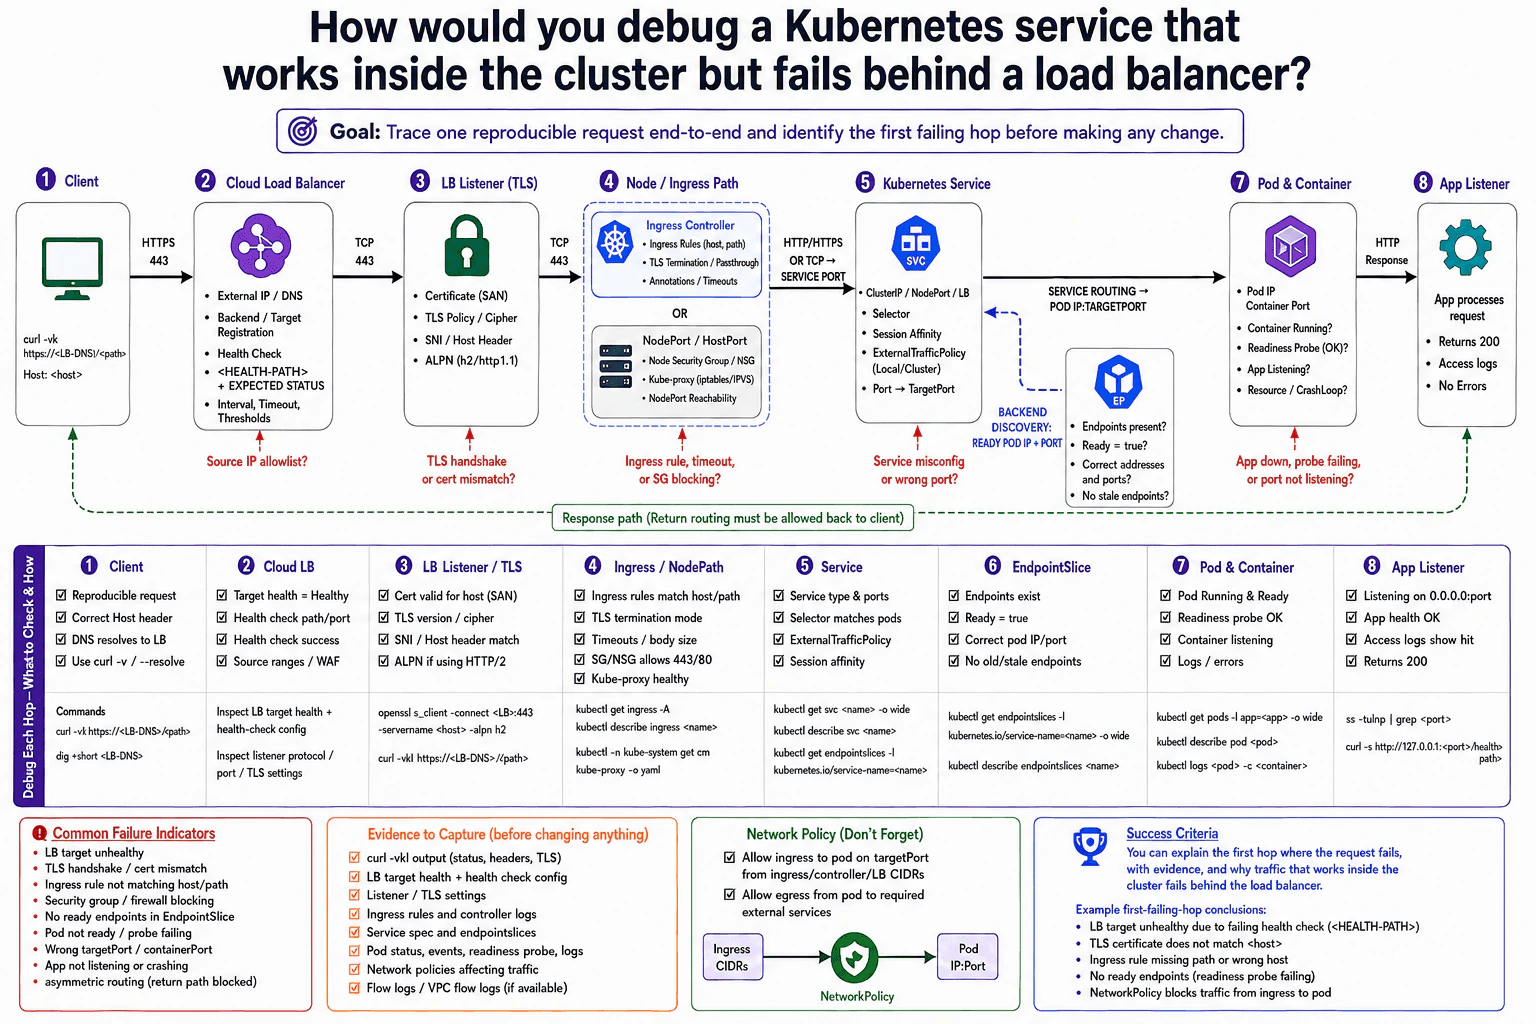
Use one reproducible request to trace the path from the external endpoint through the cloud load balancer, listener and health check, node or ingress path, Service, EndpointSlice, Pod port, and application listener. Include protocol and TLS expectations, source ranges, network policy, readiness, target registration, return routing, and evidence that identifies the first failing hop before a configuration change.

Short Interview Answer (30-60 seconds)

I would use one reproducible external request and trace it hop by hop from the client to the load balancer, listener, node or ingress path, Kubernetes Service, selected ready Pod, and application listener. I would not change configuration until I identify the first hop where expected evidence disappears or changes. I would separately verify load-balancer target registration and health checks, TLS and protocol expectations, allowed source ranges, Service port-to-targetPort mapping, EndpointSlice readiness, NetworkPolicy, Pod readiness, the application's listening address and port, and the return path.

Detailed Explanation
Short Answer

Use the same reproducible request at every stage and stop at the first failing hop. The important idea is to prove each transition instead of guessing and changing several settings at once.

A practical path is:

  1. Client → external cloud load balancer.
  2. Load balancer → listener/TLS handling.
  3. Listener → node, NodePort, ingress controller, or gateway path.
  4. Node/ingress path → Kubernetes Service port.
  5. Service routing → ready Pod IP and targetPort.
  6. Pod/container → application listener.
  7. Application response → client through the valid return path.

EndpointSlice is important evidence for backend discovery, but it is not another packet-processing hop in the synchronous request path. It tells Kubernetes which ready Pod IPs and ports are available to receive Service traffic.

Detailed Debugging Flow
1. Reproduce the external failure

Start with one exact request and keep it unchanged while debugging. For example:

curl -vk https://<LB-DNS>/<path> -H 'Host: <host>'

Record the result, including DNS resolution, connection behavior, TLS handshake, HTTP status, headers, and timing. If possible, use --resolve so the same hostname and destination IP are exercised repeatedly.

This gives me a stable request that I can correlate with load-balancer logs, ingress logs, Pod logs, and flow logs.

2. Check the cloud load balancer

Verify that the external IP or DNS name resolves to the expected load balancer and that the listener is configured for the requested port and protocol.

I would check:

  • Backend or target registration is present and healthy.
  • The health-check path, port, protocol, interval, timeout, thresholds, and expected success status match the application path actually being tested.
  • Security groups, firewall rules, network ACLs, or equivalent controls allow the required source ranges.
  • The load balancer is targeting the correct nodes, NodePorts, ingress endpoints, or other configured backends.
  • Load-balancer access logs or metrics show whether the request arrived and how it was handled.

If the target is unhealthy before the client request reaches Kubernetes, I investigate the health check before changing the Service or application.

3. Verify listener and TLS expectations

For HTTPS traffic, verify the certificate SAN matches the requested hostname, SNI is correct, the supported TLS policy and cipher set are compatible, and ALPN or HTTP version negotiation behaves as expected.

The most important question is where TLS terminates. If TLS terminates at the load balancer, the backend protocol may be HTTP or TCP depending on the design. If TLS is passed through or re-encrypted, the ingress or application must be listening with matching TLS expectations.

A TLS handshake failure or certificate mismatch is already a first-failing-hop signal; I would not start changing Service selectors or Pod ports in that case.

4. Check the node or ingress path

Next, determine whether traffic actually reaches the Kubernetes entry path.

For an ingress-controller path, I would inspect the ingress or gateway configuration and controller logs. I would verify:

  • Host and path rules match the reproducible request.
  • The listener and backend protocol expectations agree.
  • TLS termination or passthrough is configured as intended.
  • Timeouts and request-size limits are not rejecting the request.
  • Source-range restrictions, security rules, WAF rules, or rate limits are not blocking it.
  • NetworkPolicy permits the required ingress-controller-to-Pod traffic.

For a NodePort or host-port path, I would verify the load balancer targets the correct node port, the node can receive the traffic, kube-proxy or the installed Service data plane is healthy, and node security rules permit the traffic.

Useful evidence includes ingress-controller access/error logs and commands such as:

kubectl get ingress -A

kubectl describe ingress <name>

5. Validate the Kubernetes Service

A Service that works internally can still be wrong for the external path. I would inspect the complete Service definition rather than assuming the in-cluster test proves all external routing.

Check:

  • The expected Service type is being used.
  • The Service port is the port reached from the ingress or node path.
  • targetPort maps to the actual container/application port.
  • The selector matches the intended Pods.
  • Any session-affinity behavior is expected.
  • externalTrafficPolicy, when relevant to the load-balancer design, has the intended value and compatible target distribution.

Useful commands are:

kubectl get svc <name> -o wide

kubectl describe svc <name>

A common first failure here is a correct Service selector but an incorrect Service port or targetPort.

6. Inspect EndpointSlice backend discovery

EndpointSlice is control/discovery state used by Service routing. The actual request should not be modeled as Service → EndpointSlice → Pod.

I would verify:

  • EndpointSlices exist for the Service.
  • The expected Pod IPs are present.
  • The endpoint ports are correct.
  • The endpoints are marked ready when the application is supposed to receive traffic.
  • There are no stale or unexpected addresses.

Useful commands include:

kubectl get endpointslices -l kubernetes.io/service-name=<name> -o wide

kubectl describe endpointslices <name>

If the Service selector looks correct but no ready endpoint exists, the investigation moves to Pod readiness rather than to the load balancer.

7. Check Pod readiness, networking, and container state

Verify that the selected Pod is Running and Ready and that its readiness probe succeeds.

I would inspect:

  • Pod conditions and recent events.
  • Readiness probe configuration and results.
  • Container restarts or crash loops.
  • The Pod IP and expected container port.
  • NetworkPolicy allowing traffic from the ingress controller, nodes, or load-balancer-related source ranges as appropriate.
  • Required egress if the request depends on another service.

Useful commands include:

kubectl get pods -l app=<app> -o wide

kubectl describe pod <pod>

kubectl logs <pod> -c <container>

The readiness state matters because only ready endpoints should normally participate as eligible Service backends.

8. Verify the application listener

Finally, verify that the process inside the container is actually listening on the expected address and port.

For example:

ss -tulnp | grep <port>

and from inside the container:

curl -s http://127.0.0.1:<port>/<health-path>

I would verify that the application:

  • Listens on the expected address and port, commonly 0.0.0.0:<port> when it must accept Pod-network traffic.
  • Uses HTTP or HTTPS as expected by the upstream component.
  • Returns the expected response locally.
  • Records the request in application logs.
  • Does not fail because of resource pressure, crashes, or application-level errors.

If the Pod receives the request and the application log shows it, but the client never gets the response, I focus on return routing rather than the forward path.

Return Path

A successful forward request is only half of the connection. Verify that response traffic can return through the Pod/node or ingress networking path, the load balancer, and finally to the client.

Check routing, connection tracking, SNAT behavior where applicable, security groups, firewall rules, network ACLs, and NetworkPolicy. A broken or asymmetric return path can look like a timeout even when the application processed the request successfully.

Evidence-First Troubleshooting

Before changing configuration, capture evidence from the same request:

  • curl -vk output, including status, headers, and TLS information.
  • Load-balancer target health and health-check configuration.
  • Listener and TLS settings.
  • Ingress rules and controller logs.
  • Service specification and port mapping.
  • EndpointSlice addresses, ports, and readiness.
  • Pod status, events, readiness-probe results, and logs.
  • NetworkPolicy affecting the path.
  • Flow logs or packet-capture evidence when available.

Then compare adjacent hops. The first place where the expected evidence disappears or changes is the best place to investigate.

For example:

  • No load-balancer access log: investigate DNS, listener, source ranges, firewall, or the load balancer itself.
  • Load balancer receives the request but targets are unhealthy: investigate target registration and health checks.
  • TLS handshake fails: investigate certificate, SNI, TLS policy, or termination mode.
  • Load balancer succeeds but no ingress log appears: investigate target port, node reachability, security rules, or ingress listener configuration.
  • Ingress receives the request but no ready backend exists: investigate Service selectors, EndpointSlice, and readiness.
  • Pod receives traffic but the application does not: investigate container port and application listener.
  • Application returns successfully but the client times out: investigate the response path.
Common Mistakes
  • Changing the load balancer, Service, and application at the same time.
  • Assuming an in-cluster Service test proves that the external listener and target registration are correct.
  • Treating EndpointSlice as an actual packet-processing hop instead of backend-discovery state.
  • Testing a different hostname, path, or protocol at each hop.
  • Ignoring the TLS termination point.
  • Looking only at Service configuration without checking ready endpoints.
  • Forgetting NetworkPolicy or source-range restrictions.
  • Assuming a Running Pod is also Ready.
  • Forgetting the return path when the application has already processed the request.
Interview Tip

I would explain the investigation as a sequence of hypotheses supported by evidence. I would say: 'I use one reproducible request, prove each hop in order, and stop at the first place where expected evidence disappears. I fix that layer before changing anything else.' That demonstrates disciplined production debugging instead of trial-and-error configuration changes.

Useful Questions to Ask the Interviewer
  • Is the load balancer targeting nodes, NodePorts, an ingress controller, or Pod IPs directly?
  • Where is TLS expected to terminate: at the load balancer, ingress, or application?
  • What backend protocol and port should the load balancer use?
  • What health-check path, protocol, port, and success codes are configured?
  • Is externalTrafficPolicy set to Local or Cluster, and is preserving the client source IP important?
  • Are NetworkPolicies, cloud security rules, firewall rules, or source-range restrictions enabled?
  • Does the failure affect every backend or only particular nodes or Pods?
  • What evidence is available from load-balancer logs, ingress logs, Pod logs, and flow logs?
Python Solution

No Python solution is required for this operational Kubernetes troubleshooting question. The correct solution is evidence-driven inspection of the network and Kubernetes request path using the load-balancer, Kubernetes, application, and networking diagnostics described above.

How would you debug a Kubernetes service that works inside the cluster but fails behind a load balancer? diagram
Practical Complexity & Trade-offs

There is no algorithmic Big-O complexity for this infrastructure debugging task. Operationally, the work is linear in the number of hops you inspect: client, load balancer, listener, node or ingress path, Service, backend discovery, Pod, and application. By stopping at the first failing hop, you avoid unnecessary changes to later layers.

Why Interviewers Ask This

Interviewers ask this question to see whether a DevOps engineer can troubleshoot a distributed Kubernetes networking problem systematically. A strong answer separates the actual request path from control-state information such as EndpointSlice and target health, understands TLS termination and Service port mapping, checks readiness and NetworkPolicy, validates both forward and return routing, and uses logs and other evidence to isolate one failing hop before making configuration changes.

Interviewer may ask next
What if the load balancer reports every target as unhealthy?

Compare the configured health-check protocol, port, path, expected status, and allowed source ranges with what the target actually serves. Then test the health endpoint from the closest reachable network location. Do not change the Service until you know whether the health check reaches the intended target.

What if the Service works from another Pod but the ingress returns 503?

Check the ingress host/path rule, backend Service name and Service port, EndpointSlice readiness, ingress-controller logs, and NetworkPolicy between the ingress controller and backend Pods. A working in-cluster request does not prove that the ingress is pointing to the same Service port or that ingress-to-Pod traffic is allowed.

5. How would you implement fine-grained service discovery for more than one thousand microservices with Envoy or Istio?Containers And KubernetesMediumNetflix

Question Details

Design the control-plane and data-plane discovery flow for a large Kubernetes service estate. Cover workload identity, endpoint registration and removal, locality and failover, routing and policy distribution, configuration versioning, resource scale, stale or rejected configuration, certificate dependencies, multi-cluster boundaries, observability, rollout, and behavior when the mesh control plane is unavailable.

Short Interview Answer (30-60 seconds)

At a high level, I would separate service discovery into a control plane and a data plane. Kubernetes reports workload and endpoint changes to Istiod. Istiod validates, versions, and distributes xDS configuration to Envoy sidecars. Envoy then handles mTLS traffic, routing, locality, retries, and policy without calling Istiod for every request. The main trade-off is operational complexity. If Istiod fails, existing traffic can continue with the last accepted configuration, but proxies cannot receive fresh discovery or policy updates.

Detailed Explanation

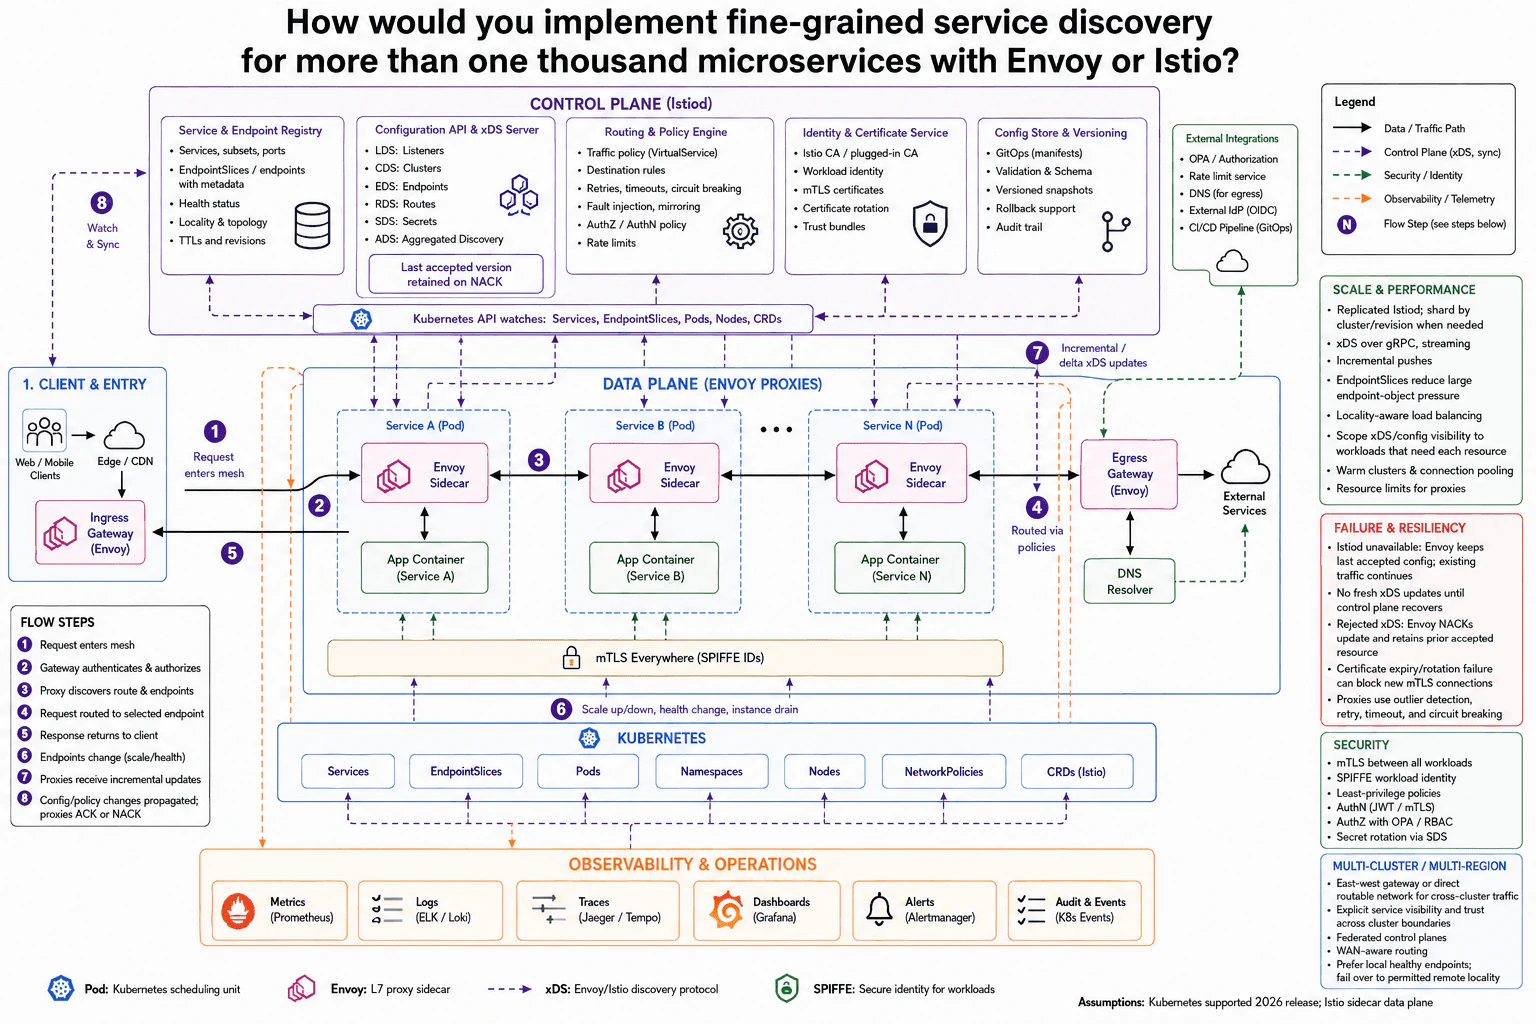
The goal is to let more than one thousand services find the correct healthy destination without putting discovery logic inside every application. The difficult part is that Pods start, stop, move, become unhealthy, and change during rollouts. Routing and security rules also change. The design separates these concerns into two paths. Istiod watches Kubernetes and prepares trusted, versioned configuration. Envoy proxies use that configuration on the live traffic path. This keeps ordinary service requests independent from the control plane while still allowing discovery, identity, policy, and routing changes to reach the proxies.

Useful Questions to Ask the Interviewer
  1. Are all services in one cluster, or must discovery cross clusters and regions?
  2. How quickly must endpoint changes reach Envoy proxies?
  3. Should every workload see every service, or only approved dependencies?
  4. Is mTLS required for every workload-to-workload connection?
  5. What failover behavior is allowed when a local cluster or Istiod is unavailable?
How would you implement fine-grained service discovery for more than one thousand microservices with Envoy or Istio? diagram
How to Explain It in an Interview
1. Start with the request path and workload identity

A client reaches the mesh through the Edge or CDN and the Envoy Ingress Gateway. Authentication and authorization can use JWT, mTLS, OPA, or RBAC policies shown in the design. Rate limits can also be applied before traffic reaches a workload. Each application Pod has an Envoy sidecar beside its App Container. Workload identity uses SPIFFE IDs. Istio CA, or a plugged-in CA, provides certificates. SDS distributes and rotates the mTLS secrets used by Envoy.

2. Use Kubernetes as the service and endpoint source

Istiod watches the Kubernetes API for Services, EndpointSlices, Pods, Nodes, and Istio CRDs. EndpointSlices carry scalable endpoint information and reduce pressure from very large endpoint objects. When Pods scale up or down, change health, or drain, Kubernetes updates the relevant discovery state. Istiod's Service & Endpoint Registry combines that state with health, locality, topology, ports, subsets, and revisions. This gives the control plane the information needed to add or remove destinations safely.

3. Build and distribute versioned xDS configuration

Istiod's Configuration API and xDS Server turns the current state into LDS, CDS, EDS, RDS, and SDS resources. The Routing & Policy Engine applies VirtualService traffic rules, DestinationRules, retries, timeouts, circuit breaking, authorization, and rate limits. The Config Store & Versioning area keeps GitOps manifests, validation and schema checks, versioned snapshots, rollback support, and an audit trail. Changes are pushed over streaming gRPC with incremental or delta xDS updates. Envoy ACKs accepted versions. If a resource is rejected, Envoy NACKs it and keeps the last accepted version.

4. Keep service-to-service routing in Envoy

Once Envoy has discovery state, live application traffic stays in the data plane. The source proxy selects a healthy destination using routing policy, health, and locality such as zone or region. mTLS protects workload-to-workload traffic. Retries, timeouts, and circuit breaking can protect requests from unhealthy destinations. For egress, the Envoy Egress Gateway can route traffic toward external services, with DNS available for external name resolution. The response then returns through the same service-mesh data path rather than through Istiod.

5. Scale the control plane and handle multiple clusters

For a large estate, Istiod should be replicated and can be sharded by cluster or revision when needed. xDS visibility should be scoped so a workload receives only resources it needs. Incremental pushes, streaming connections, EndpointSlices, warm connections, and proxy resource limits help control memory and update cost. Across clusters, service visibility and trust must be explicit. Cross-cluster traffic needs an east-west gateway or a directly routable network. Federated control planes can exchange the required discovery information. Envoy should prefer healthy local endpoints and fail over only to an allowed remote locality.

6. Explain failure handling, rollout, and observability

Configuration rollout should follow the versioned GitOps path. Validate the change, publish a versioned snapshot, distribute it through xDS, watch ACK or NACK results, and roll back if necessary. If Istiod becomes unavailable, Envoy keeps its last accepted configuration, so existing traffic can continue. The limitation is important: no fresh xDS updates arrive until the control plane recovers. New endpoints, removals, and policy changes may therefore be stale. A certificate rotation failure can also block new mTLS connections after certificates expire. Metrics use Prometheus, logs use ELK or Loki, traces use Jaeger or Tempo, dashboards use Grafana, alerts use Alertmanager, and Kubernetes events provide audit evidence.

Why Interviewers Ask This

Interviewers want to see whether you understand the difference between managing service discovery and carrying real application traffic. They also want to test your judgment around Kubernetes endpoint changes, Envoy xDS, workload identity, configuration versions, large resource counts, multi-cluster boundaries, and failure handling. A strong answer explains both the normal request path and what happens when configuration, certificates, endpoints, or the control plane fail.

Interviewer may ask next
What would you change if each workload should discover only a small set of approved services?

I would keep the same Kubernetes, Istiod, and Envoy design, but I would narrow xDS visibility for each workload. Istiod already builds the discovery resources sent to Envoy. Instead of sending a broad view of the mesh, it would send only the clusters, routes, endpoints, and policies that workload needs.

This helps in two ways. First, each Envoy keeps less configuration in memory. Second, changes to unrelated services create less control-plane work. That becomes important when the mesh contains more than one thousand services.

I would still keep authorization policy separate from discovery visibility. A workload knowing that a service exists is different from being allowed to call it. OPA or RBAC policy still controls access. Versioning also stays the same. Envoy ACKs valid xDS updates and NACKs rejected ones while retaining the previous accepted version.

The downside is management complexity. Dependency and visibility rules must stay correct as services change.

How would the design behave if one cluster or region became unavailable?

I would first keep traffic local whenever healthy local endpoints exist. Envoy already has health and locality information, so it can prefer destinations in the local zone or region. If those destinations disappear and policy allows remote traffic, it can fail over to a permitted remote locality.

The cross-cluster path must already be available. The diagram supports an east-west gateway or a directly routable network. Trust must also cross the cluster boundary, because remote workloads still authenticate with mTLS and SPIFFE identities. Service visibility must be explicit so a failure does not accidentally expose every remote service.

Federated control planes continue managing discovery inside their cluster boundaries. If a local Istiod is also unavailable, its Envoy proxies keep the last accepted configuration. That can keep existing routes working, but no fresh xDS information arrives until recovery.

The downside is that remote traffic may take a longer network path and multi-cluster operations become more complex.

6. How would you keep Kubernetes secrets out of Git while preserving a declarative deployment workflow?Infrastructure As CodeEasyNetflix

Question Details

Design the source-of-truth and reconciliation path for manifests that reference secrets without containing secret material. Cover developer and CI identity, secret-store objects and references, encryption, repository and rendered-output controls, deployment ordering, namespace and workload authorization, rotation and revocation, reload behavior, audit evidence, drift, failure when the secret provider is unavailable, and rollback without copying plaintext into state or logs.

Short Interview Answer (30-60 seconds)

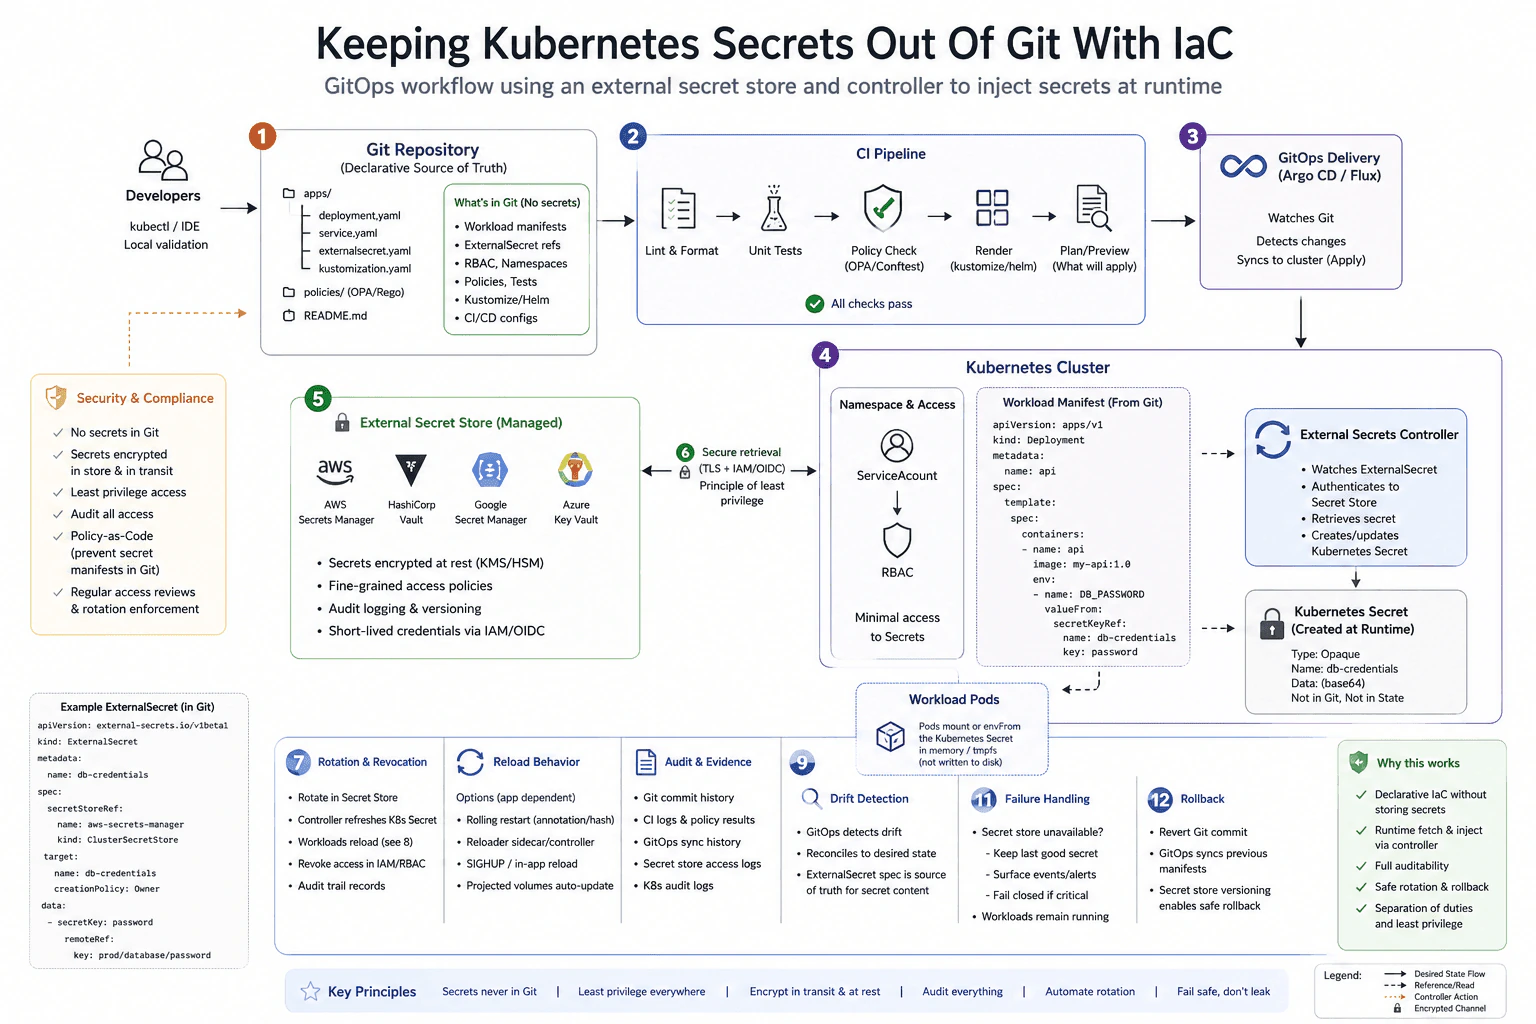
I would store only secret references in Git and keep values in an external secret store. A controller uses short-lived workload identity to fetch authorized values and reconcile Kubernetes Secrets, while CI, GitOps, RBAC, encryption, auditing, rotation, drift detection, and safe reloads protect the lifecycle.

Detailed Explanation

See the Code while reading this explanation.

The goal is to keep passwords and other private values out of files that developers commit while still describing deployments in a repeatable way. The repository records which secret an application needs, but never stores the secret itself. The real value stays in a separate protected service. During deployment, an automated controller retrieves that value and makes it available only inside the running environment. Access is limited, changes are recorded, values can be rotated, and application configuration can be restored without copying private data into source files, build output, state, or logs.

Useful Questions to Ask the Interviewer
  1. Which external secret store is approved for production?
  2. Are deployments reconciled by a GitOps controller such as Argo CD or Flux, or applied directly by CI?
  3. Should secret access be isolated per namespace, workload, or environment?
  4. Do applications consume Secrets through mounted files, environment variables, or both?
  5. What rotation, revocation, audit-retention, and recovery requirements apply?
How would you keep Kubernetes secrets out of Git while preserving a declarative deployment workflow? diagram
How to Explain It in an Interview

I would use two clearly separated sources of truth. Git owns the desired Kubernetes configuration and secret references. The external secret store owns the actual secret values. Git must never contain the plaintext value.

In the repository I would keep workload manifests, namespaces, RBAC, policies, GitOps configuration, and an ExternalSecret-style object that references a remote secret. Repository controls include pre-commit or CI secret scanning, protected branches, required reviews, signed changes where appropriate, and policy-as-code checks that reject manifests containing embedded credentials.

CI checks out the repository using its own identity. It performs formatting, linting, tests, policy checks, manifest rendering, and a preview or diff. These steps operate only on references. CI must not resolve the external secret into rendered YAML, artifacts, command-line arguments, state, or logs. Sensitive fields in tools that might display them must be redacted.

After checks pass, GitOps delivery such as Argo CD or Flux, or an equivalently controlled CI apply, reconciles the declarative manifests to Kubernetes. The deployment order matters. The namespace and required RBAC must exist, the External Secrets controller and its CRDs must be available, and the controller's service account and external-store identity must be authorized before an ExternalSecret can reconcile successfully.

The External Secrets controller watches the ExternalSecret resource. It authenticates to the external secret store using a dedicated short-lived workload identity, such as an IAM/OIDC mapping, rather than a long-lived static credential stored in Git. The external-store policy grants only the minimum read access required for the referenced secret path. Communication to the store uses TLS, and the secret store encrypts values at rest using its supported key-management controls.

The controller retrieves the remote value and creates or updates a Kubernetes Secret such as db-credentials. The workload manifest references that Kubernetes Secret with a secret volume or secretKeyRef; it does not contain the value. Kubernetes RBAC controls access to Kubernetes objects, while the external store's IAM policy separately controls which controller identity may retrieve remote secret material. Both layers should use least privilege.

Rotation starts in the external secret store. When a value changes, the controller reconciles the new version into the Kubernetes Secret. Reload behavior depends on how the application consumes the Secret. Kubernetes can update mounted Secret-volume contents, but the application must reread the file. Environment variables do not change inside an already running container, so those workloads require a controlled restart, rollout, reloader controller, checksum annotation, SIGHUP, or another application-specific reload mechanism.

For revocation, remove or narrow the external IAM permission or Kubernetes authorization and rotate or revoke the backing credential when required. Revoking access does not automatically erase a credential that an existing process already loaded into memory, so the workload and backing service's revocation semantics must also be considered.

Audit evidence should come from Git commit and review history, CI validation and policy results, GitOps synchronization history, Kubernetes audit logs, and the external secret store's access and version logs. Together these records show who changed the reference, which identity retrieved a secret, and whether reconciliation succeeded without recording plaintext.

Drift has two reconciliation paths. GitOps reconciles Kubernetes manifests back to the desired Git state. The External Secrets controller separately reconciles the generated Kubernetes Secret from the external store. Git is therefore the source of truth for the reference and workload configuration, while the external store remains the source of truth for secret material.

If the external secret provider is temporarily unavailable, the controller should report reconciliation failures and retry with bounded backoff. It should retain the last successfully materialized Kubernetes Secret rather than replacing it with an empty value. Existing workloads can normally continue with the last value they already received. A workload that has no usable Secret may fail to start correctly, and critical deployments should fail closed instead of inventing or logging fallback credentials. Events, metrics, or alerts should expose the failure.

Rollback must also respect the two sources of truth. Reverting a Git commit restores the previous declarative manifest set and GitOps reconciles it. That does not necessarily restore an older secret value because the reference may still resolve to the current value in the external store. If value rollback is required, use the secret store's supported versioning or restore mechanism. Neither rollback path requires plaintext to be copied into Git, CI output, infrastructure state, or logs.

The tradeoff is extra operational dependency on the controller and external store. In return, the design keeps Git declarative, centralizes encryption and access control, provides auditable secret rotation, separates responsibilities, and avoids distributing long-lived credentials through the deployment pipeline.

Technical Approach
  1. Store the real secret in the approved external secret store with encryption, versioning, and audit logging.
  2. Commit only workload manifests, namespaces, RBAC, policies, and an ExternalSecret-style reference to Git.
  3. Scan the repository for secrets and run linting, tests, policy checks, rendering, and preview/diff without resolving secret values.
  4. Give developers, CI, GitOps, and the secrets controller separate least-privilege identities.
  5. Deploy prerequisites in dependency order: namespace, controller/CRDs, service account, RBAC, and external-store authorization.
  6. Let GitOps or an approved CI apply reconcile the manifests to Kubernetes.
  7. Let the External Secrets controller authenticate with its short-lived workload identity, fetch the authorized remote value, and create or update the Kubernetes Secret.
  8. Let the workload consume that Kubernetes Secret through a volume or secretKeyRef.
  9. Rotate values in the external store and use the application's required reload or rollout mechanism.
  10. Collect Git, CI, GitOps, Kubernetes, and secret-store audit evidence.
  11. Reconcile drift continuously and alert on failures.
  12. Roll back manifests through Git and secret values through provider-supported versioning without copying plaintext into Git, artifacts, state, or logs.
Practical Insights

There is no meaningful algorithmic time or memory complexity here. The important cost is operational. Each reconciliation makes Kubernetes and external-store API calls, so very short refresh intervals increase traffic and may increase provider cost or rate-limit pressure. The controller and GitOps service also become components that need monitoring, upgrades, and availability planning. This is more operational work than committing native Secret objects, but it provides much stronger centralized access control, encryption, auditing, rotation, and separation of secret values from source control.

Code
# Preserve the Kubernetes manifest exactly as data while making this a valid Python 3.14 program.
manifest = """# This manifest is safe for Git because it contains only a remote secret reference.
# The External Secrets controller, CRDs, ClusterSecretStore, workload identity,
# and least-privilege provider permissions must already exist before reconciliation.
apiVersion: external-secrets.io/v1beta1
kind: ExternalSecret
metadata:
  name: db-credentials
spec:
  # Reference the preconfigured external store object; it owns provider connection details.
  secretStoreRef:
    name: aws-secrets-manager
    kind: ClusterSecretStore

  # The controller owns the generated Kubernetes Secret and reconciles its lifecycle.
  target:
    name: db-credentials
    creationPolicy: Owner

  # Map a remote secret reference to a local Kubernetes Secret key without exposing its value.
  data:
    - secretKey: password
      remoteRef:
        key: prod/database/password
---
apiVersion: apps/v1
kind: Deployment
metadata:
  name: api
spec:
  replicas: 1
  selector:
    matchLabels:
      app: api
  template:
    metadata:
      labels:
        app: api
    spec:
      containers:
        - name: api
          image: my-api:1.0
          env:
            # Kubernetes resolves this reference from the Secret created by the controller.
            # Environment variables are fixed for a running container, so rotation requires
            # an intentional workload reload or rollout rather than assuming live refresh.
            - name: DB_PASSWORD
              valueFrom:
                secretKeyRef:
                  name: db-credentials
                  key: password"""

if __name__ == "__main__":
    print(manifest)
Why Interviewers Ask This

This tests whether the candidate can preserve a declarative GitOps workflow without turning Git, CI artifacts, logs, or infrastructure state into secret stores. It also evaluates identity design, least privilege, controller reconciliation, dependency ordering, namespace authorization, rotation, workload reload behavior, auditability, drift handling, external-provider failures, and safe rollback.

Common interview mistakes

Common mistakes are committing base64-encoded Kubernetes Secret values and treating base64 as encryption; allowing CI to fetch plaintext and render it into YAML or artifacts; writing secret values into IaC state, outputs, logs, or command lines; using one broad long-lived credential for every namespace; granting the secrets controller unrestricted access to the whole store; confusing Kubernetes RBAC with external-store IAM; applying an ExternalSecret before its controller, CRD, identity, store object, and authorization exist; assuming an environment-variable consumer receives a rotated value without a restart; deleting a valid Kubernetes Secret during a temporary provider outage; assuming Git rollback automatically restores an older secret value; and failing to audit or alert on reconciliation errors.

Interview tip

Draw two sources of truth first: Git owns desired manifests and secret references, while the external store owns secret values. Then walk through CI validation, GitOps reconciliation, workload identity, RBAC/IAM, rotation, reload behavior, audit evidence, drift, provider failure, and rollback. Repeatedly emphasize that plaintext never needs to enter Git, rendered artifacts, state, or logs.

Interviewer may ask next
What happens when a secret is rotated in the external secret store?

The External Secrets controller sees the new value during reconciliation and updates the Kubernetes Secret. The application behavior then depends on how that Secret is consumed. A mounted Secret volume can receive updated files, but the application still has to reread them. A Secret exposed as an environment variable does not change inside an already running container, so I would use a controlled restart or rollout, a reloader controller, a checksum-triggered rollout, or an application-specific reload mechanism. When possible, I would verify the new credential before revoking the old one.

What should happen if the external secret provider is unavailable?

The controller should report the reconciliation error and retry with bounded backoff. It should keep the last successfully materialized Kubernetes Secret instead of overwriting it with an empty value. Existing workloads can normally continue using the last credential they already received. A new workload without a usable Secret may fail to start or become unhealthy, so critical paths should fail closed and alert operators. Once provider connectivity or authorization is restored, normal reconciliation should converge again without anyone copying plaintext into Git or logs.

7. How should dashboards differ for executives and on-call engineers?ObservabilityEasyNetflix

Question Details

Use one critical service to define the audiences and decisions each dashboard supports. Compare business and user outcomes, service objectives, trends and risks for leadership with real-time symptoms, dependency context, deployment identity, saturation, logs and traces, drill-downs, freshness, and action links for responders. Explain how both views remain consistent without hiding uncertainty or overwhelming either audience.

Short Interview Answer (30-60 seconds)

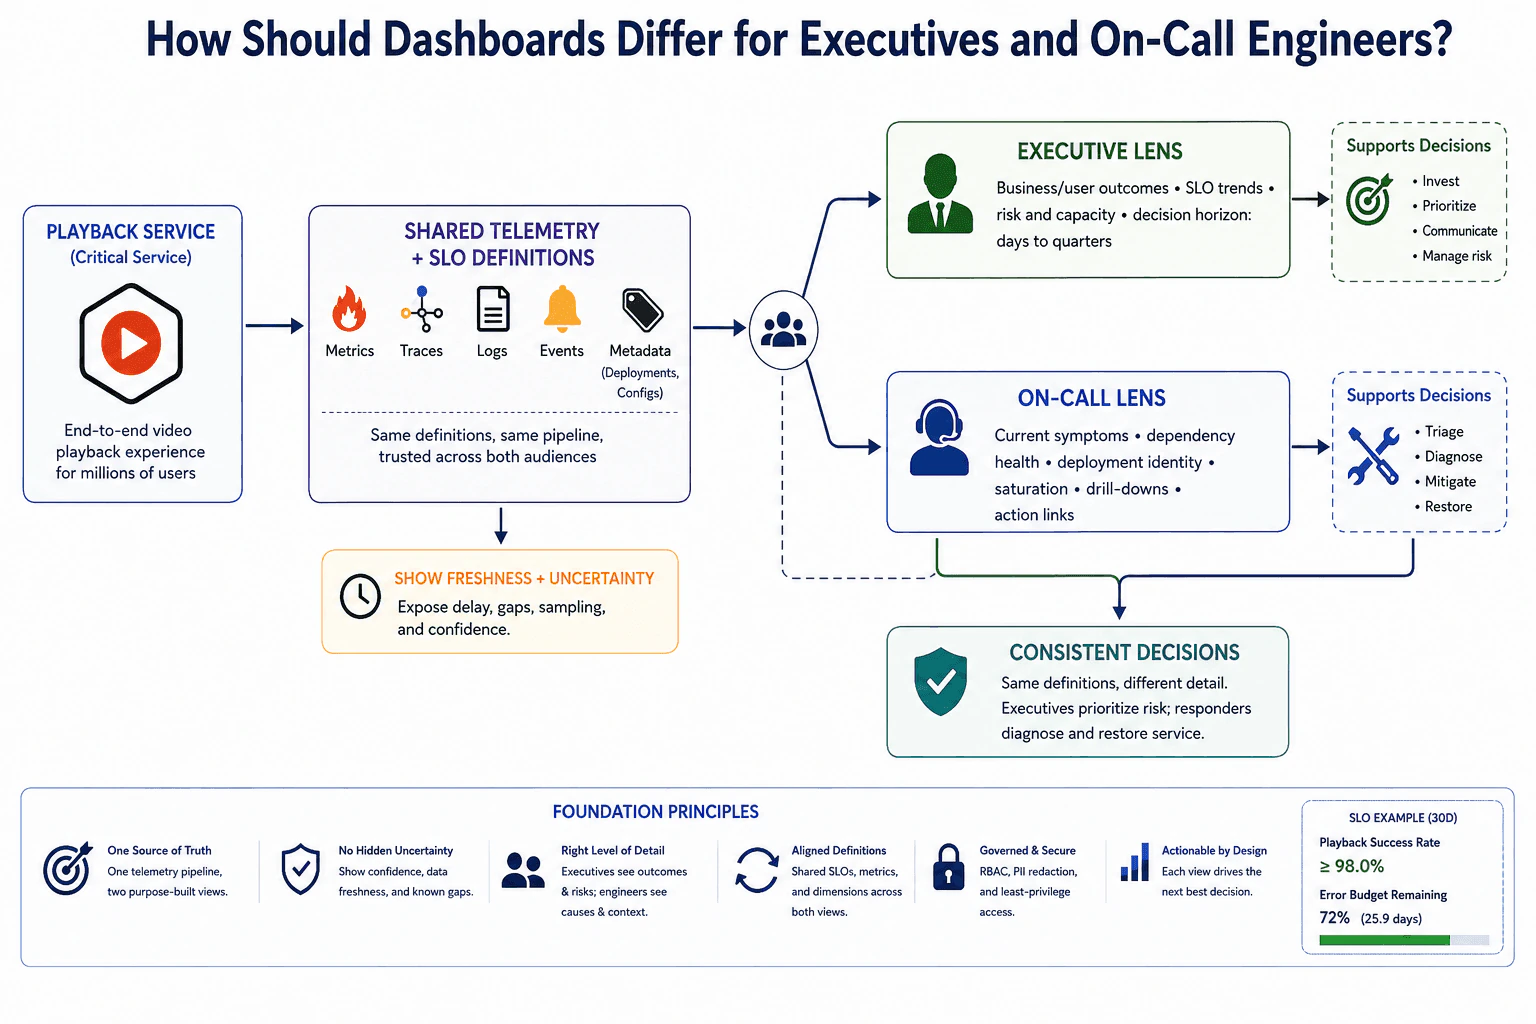
Both audiences should use the same telemetry and SLO definitions but different views. Executives need business outcomes, SLO trends, risk, and capacity. On-call engineers need current symptoms, dependencies, deployment context, saturation, logs, traces, drill-downs, freshness, and action links.

Detailed Explanation

For one important service, the two dashboards should answer different questions using the same underlying facts. Leaders need to know whether customers are getting a good experience, whether service quality is improving or getting worse, what risks matter, and where attention or investment is needed. The person responding to an incident needs more immediate detail so they can understand what is happening and restore service quickly. Both views must stay consistent, show when information is incomplete or delayed, and avoid showing more detail than each audience can use.

Useful Questions to Ask the Interviewer
  1. What decisions should executives make from this dashboard?
  2. What actions should the on-call engineer be able to take from the responder view?
  3. Which user outcomes and service-level objectives matter most for this service?
  4. How fresh should the responder data be, and how should delayed or missing telemetry be shown?
  5. Are there privacy, retention, or access-control constraints on the telemetry shown to either audience?
How should dashboards differ for executives and on-call engineers? diagram
How to Explain It in an Interview

I would use one critical service, such as the Playback Service in the diagram, and start with the user-visible outcome. I would define the service-level indicators, or SLIs, that measure that outcome, and then define service-level objectives, or SLOs, that describe the target level of reliability.

Both dashboards should come from one shared telemetry foundation. The diagram uses metrics, traces, logs, events, and deployment or configuration metadata. The same SLO definitions, service identity, resource attributes, and telemetry pipeline should feed both views. That gives the organization one source of truth while still allowing two purpose-built presentations.

The executive lens should summarize business and user outcomes, SLO trends, risk, and capacity. Its decision horizon is usually longer, such as days to quarters. It should help leaders invest, prioritize, communicate, and manage risk. For example, leadership needs to know whether the service is meeting its reliability objective and whether the error budget or other risk indicators are moving in the wrong direction. It should not overwhelm them with individual traces, raw logs, or low-level dependency details that do not support those decisions.

The on-call lens should optimize for triage, diagnosis, mitigation, and restoration. It should show current symptoms, dependency health, deployment identity, saturation, and direct drill-downs to structured logs and traces. Deployment identity should make it possible to relate a symptom to the version, rollout, configuration change, or running instance involved. Useful action links can take the responder to a runbook, saved query, deployment details, incident workflow, rollback mechanism, or other approved recovery action.

Freshness and uncertainty must be visible. The diagram explicitly calls out delay, gaps, sampling, and confidence. A missing metric or delayed trace must not silently look healthy. Trace sampling can omit rare requests, aggregation can hide individual failures, and collection gaps can produce incomplete evidence. The responder view should expose this context directly, while the executive view can summarize it without pretending the data is more certain than it is.

The two dashboards should also use the right level of detail. Executives see outcomes and risks. Engineers see causes and context. Shared definitions keep those views aligned so an executive reliability number and an on-call reliability number do not represent different calculations.

There are operational tradeoffs. More telemetry and more dimensions can improve investigation, but they increase ingestion, storage, query cost, and maintenance. High-cardinality labels can make a metrics system expensive or difficult to operate. Longer retention helps trend analysis but costs more. Detailed logs and traces may contain sensitive information, so credentials, tokens, personal data, and sensitive payloads must be redacted, and dashboard access should follow least privilege.

I would also make the dashboards actionable by design. Leadership should be able to move from a trend or risk to a prioritization decision. Responders should be able to move from a symptom to evidence and then to an approved action. That is the key idea in the diagram: same definitions and same telemetry, but different detail because the two audiences make different decisions.

Finally, I would verify the design with controlled tests. I would create known service conditions in a safe environment, confirm that the expected SLIs and SLO state change correctly, verify that dependency and deployment context correlate with the same service identity, confirm that freshness and missing-data states appear correctly, and test that responder drill-downs and action links lead to the intended evidence and workflows.

Technical Approach
  1. Choose one critical service and define the user-visible outcome.
  2. Define SLIs that measure that outcome and SLOs that describe the reliability target.
  3. Build one shared telemetry foundation using metrics, traces, logs, events, and deployment or configuration metadata.
  4. Keep service identity, resource attributes, SLO definitions, and telemetry semantics consistent across both audiences.
  5. Build the executive lens around business and user outcomes, SLO trends, risk, capacity, and a days-to-quarters decision horizon.
  6. Build the on-call lens around current symptoms, dependency health, deployment identity, saturation, logs, traces, drill-downs, and action links.
  7. Expose freshness, delay, gaps, sampling, and uncertainty rather than interpreting missing telemetry as healthy.
  8. Control cardinality, retention, ingestion cost, privacy, and access according to diagnostic value and audience need.
  9. Test known service conditions and verify that both views remain consistent while supporting different decisions.
Practical Insights

There is no important algorithmic Big-O complexity here. The main costs are operational. More metric dimensions increase cardinality and storage. More logs and traces increase ingestion, query, and retention cost. Higher trace sampling captures more requests but costs more. Longer retention helps executives see trends but increases storage cost. More dashboard queries increase backend load and maintenance. The goal is to collect enough evidence for decisions and diagnosis without collecting every possible dimension or exposing sensitive data.

Why Interviewers Ask This

This question tests whether a DevOps Engineer understands that a dashboard should support a decision rather than display every available signal. Interviewers want to see whether the candidate can build one shared observability foundation, define consistent SLIs and SLOs, tailor detail to executives and responders, expose uncertainty and freshness, and make the responder view directly useful for diagnosis and service restoration.

Common interview mistakes

Common mistakes include using one identical dashboard for every audience; overwhelming executives with raw operational detail; giving responders only high-level business charts; calculating SLOs differently between dashboards; treating missing or stale telemetry as healthy; hiding sampling limitations or known gaps; showing exact root-cause claims without enough evidence; using uncontrolled high-cardinality metric labels; exposing credentials or personal data in logs; omitting deployment identity and dependency context from the responder view; providing drill-downs without useful action links; and creating dashboards that look informative but do not support a clear decision.

Interview tip

Organize the answer around decisions. Start with one critical service and one shared telemetry and SLO foundation. Then explain what executives need to decide and what responders need to decide. Finish with aligned definitions, freshness and uncertainty, operational tradeoffs, privacy, and verification.

Interviewer may ask next
How would you keep the executive and on-call dashboards consistent if they show different levels of detail?

I would derive both views from the same telemetry pipeline, service identities, resource attributes, SLI calculations, and SLO definitions. The executive view can aggregate the data across longer periods, while the responder view keeps diagnostic dimensions and recent context. Shared definitions should be version-controlled rather than recreated independently in each dashboard. I would also expose freshness and missing-data states in both views and test that the same controlled service condition produces compatible results across them.

What should happen when telemetry is delayed or incomplete during an incident?

The dashboard should show the data as delayed, missing, sampled, or unknown instead of interpreting absence as healthy. Responders should compare independent evidence such as metrics, structured logs, traces, dependency health, events, and deployment metadata where available. They should consider collection gaps, sampling bias, and clock differences before making a root-cause claim. If the observability pipeline itself is failing, that failure becomes part of the incident investigation and should be visible as an observability gap.

8. What do you not like about Netflix's culture?BehavioralEasyNetflix

Question Details

Give a candid, well-researched answer rather than generic praise or criticism. Identify one specific principle or possible consequence you question, connect it to a real working experience that shaped your view, explain the benefit you still recognize, and describe what evidence or team context would determine whether the concern is material.

Interview tip:

Use STAR to structure your answer: briefly explain the Situation and Task, make Action the most detailed part, and finish with the Result. For example, describe a previous DevOps experience that made you question how a very high performance culture can affect healthy risk taking, explain how you created clearer feedback and expectations, recognize the benefit of strong accountability, and describe what team behavior would determine whether that concern is material at Netflix.

Situation

One part of Netflix's culture that I would want to understand carefully is the very high performance expectation, especially the keeper test. I understand why it exists. A company benefits from strong people, direct feedback, and clear accountability. My concern is that if managers do not give enough context and regular feedback, people may become too cautious because they are worried that a reasonable mistake could be seen as poor performance. I saw a similar effect in my last role. Our DevOps team supported important production systems, and people sometimes hesitated to make useful infrastructure changes because expectations around acceptable risk were not always clear.

Task

I was responsible for helping the team improve reliability while still allowing engineers to make good decisions independently. I wanted engineers to take thoughtful risks when they could improve the platform, but I also wanted clear accountability when decisions affected production. My goal was to create enough clarity that people knew the difference between a reasonable engineering experiment and careless execution.

Action

I started by making expectations more visible. For important infrastructure changes, I asked engineers to document the reason for the change, the expected impact, the main risks, and the rollback plan. I did the same for my own changes so this did not feel like extra control placed on other people. I also encouraged regular conversations about what was going well and what needed improvement instead of saving feedback for a major review. When an incident happened, I focused the discussion on the decision process and the available information rather than immediately blaming the person who made the change. We looked at whether the engineer had tested the change, understood the risk, prepared a safe rollback, and communicated clearly. If those things were done well, I treated the incident as useful learning even when the result was not what we wanted. If the same problem happened because someone repeatedly ignored known safeguards, I treated that differently and addressed the performance issue directly. This approach kept accountability strong without teaching people that avoiding every risk was the safest career choice.

Result

The team became more comfortable making necessary infrastructure improvements because expectations were clearer and feedback was more regular. We also had better conversations after problems because people could separate a thoughtful decision with a bad outcome from poor engineering discipline. That experience is why I would not reject Netflix's high performance culture, but I would want to understand how it works on the specific team. I would look for evidence that managers give direct feedback early, evaluate a person's full record, support thoughtful experiments, and distinguish reasonable mistakes from repeated weak performance. If those behaviors are present, the same high standard that concerns me can also create a strong environment for experienced DevOps engineers.

Why Interviewers Ask This

Interviewers ask this question to see whether the candidate has studied Netflix's culture closely enough to form an independent view instead of simply praising it. A strong answer shows candor, balanced judgment, self awareness, and the ability to question a principle while still understanding why the company values it. For a DevOps Engineer, it also shows whether the candidate can balance accountability, autonomy, reliability, and responsible risk taking.

Interviewer may ask next
What would make you comfortable with the keeper test on your team?

I would be comfortable with it if expectations were clear and feedback happened regularly. I would want my manager to tell me early when something was not meeting expectations, give me enough context to improve, and judge my overall work instead of treating one thoughtful mistake as a complete performance signal. I would also look for a team where engineers can discuss failed changes openly when they followed good engineering practices.

How would you respond if a manager told you that your performance was not meeting the team's expectations?

I would ask for specific examples and make sure I understood the expected behavior or result. Then I would agree on the most important changes I needed to make and ask how we would evaluate progress. I prefer direct feedback because it gives me something concrete to act on. My concern is not high standards themselves. My concern is when expectations or concerns stay unclear until it is too late to respond.

Disclaimer: This interview guide is for educational and informational purposes only. It is designed to help readers prepare, but it does not guarantee any interview result, hiring decision, offer, or outcome. Interview questions, hiring criteria, and preferred answers can vary by employer, interviewer, industry, location, and time. The examples and explanations reflect the authors' research and judgment, are provided without warranties of any kind, and should not be treated as the only correct approach. Diagrams are simplified illustrations intended to highlight the main components and their interactions; actual systems and implementations may be more complex. Alternative approaches may be equally valid or better suited to a particular question, context, or interviewer. To the fullest extent permitted by applicable law, the author, contributors, and publisher are not liable for decisions made, actions taken, or losses incurred based on this guide.

Company Notice: This guide is an independent educational resource and is not affiliated with, endorsed by, sponsored by, or approved by the company named in this guide. Company names are used only to identify interview experiences commonly reported by candidates. Interview practices can change without notice, and inclusion of company-specific content does not mean these questions are official, complete, or guaranteed to be asked. To the fullest extent permitted by law, the author, contributors, and publisher are not responsible for outcomes related to use of this material.

Content Accuracy and Verification: To the fullest extent permitted by applicable law, we do not represent or warrant that interview guides, questions, answers, examples, or diagrams are accurate, complete, current, error-free, or suitable for any particular purpose. You are responsible for independently reviewing and verifying the information before relying on it.