14 Microsoft DevOps Engineer Interview Questions & Answers

microsoft icon

Questions with Detailed ExplanationsWith Detailed Explanations

(Last Updated: September 1, 2026)

1. How would you choose an Azure virtual-machine size and managed-disk type for a workload?Cloud InfrastructureEasyMicrosoft

Question Details

A team must place a new workload on Azure virtual machines but has not selected compute or storage. Explain what workload evidence you would gather before choosing a VM family and size, and how vCPU, memory, temporary local storage, accelerator needs, managed-disk type, capacity, IOPS, throughput, latency, zone support, and resize or restart effects constrain the design. Include how you would validate the choice under representative load and what signals would justify resizing without assuming a particular SKU.

Short Interview Answer (30-60 seconds)

At a high level, the goal is to match the Azure VM and managed disk to the workload. The main challenge is balancing performance, availability, and cost without guessing a specific SKU. I would break the choice into workload evidence, compute and storage sizing, and validation. I would check CPU, memory, temporary local storage, accelerators, I/O needs, and zone support. Then I would load test the design and resize when real measurements show sustained pressure. The trade-off is paying for enough headroom without over-sizing.

Detailed Explanation

The goal is to choose enough compute and storage for the workload without buying more capacity than needed. The difficult part is that CPU, memory, storage speed, temporary space, and location requirements can limit each other. I would therefore make the decision in stages. First, I would understand how the workload behaves. Next, I would match those needs to a VM family and managed disk. Finally, I would test the choice with realistic work and keep watching it after release.

Useful Questions to Ask the Interviewer
  1. What type of workload will run on the VM?
  2. What CPU, memory, and storage usage do we expect?
  3. Is the workload sensitive to storage delay or high I/O demand?
  4. Does it need a GPU, FPGA, or another accelerator?
  5. Which availability zones or redundancy design must it support?
  6. What growth, cost, licensing, and maintenance limits should I consider?
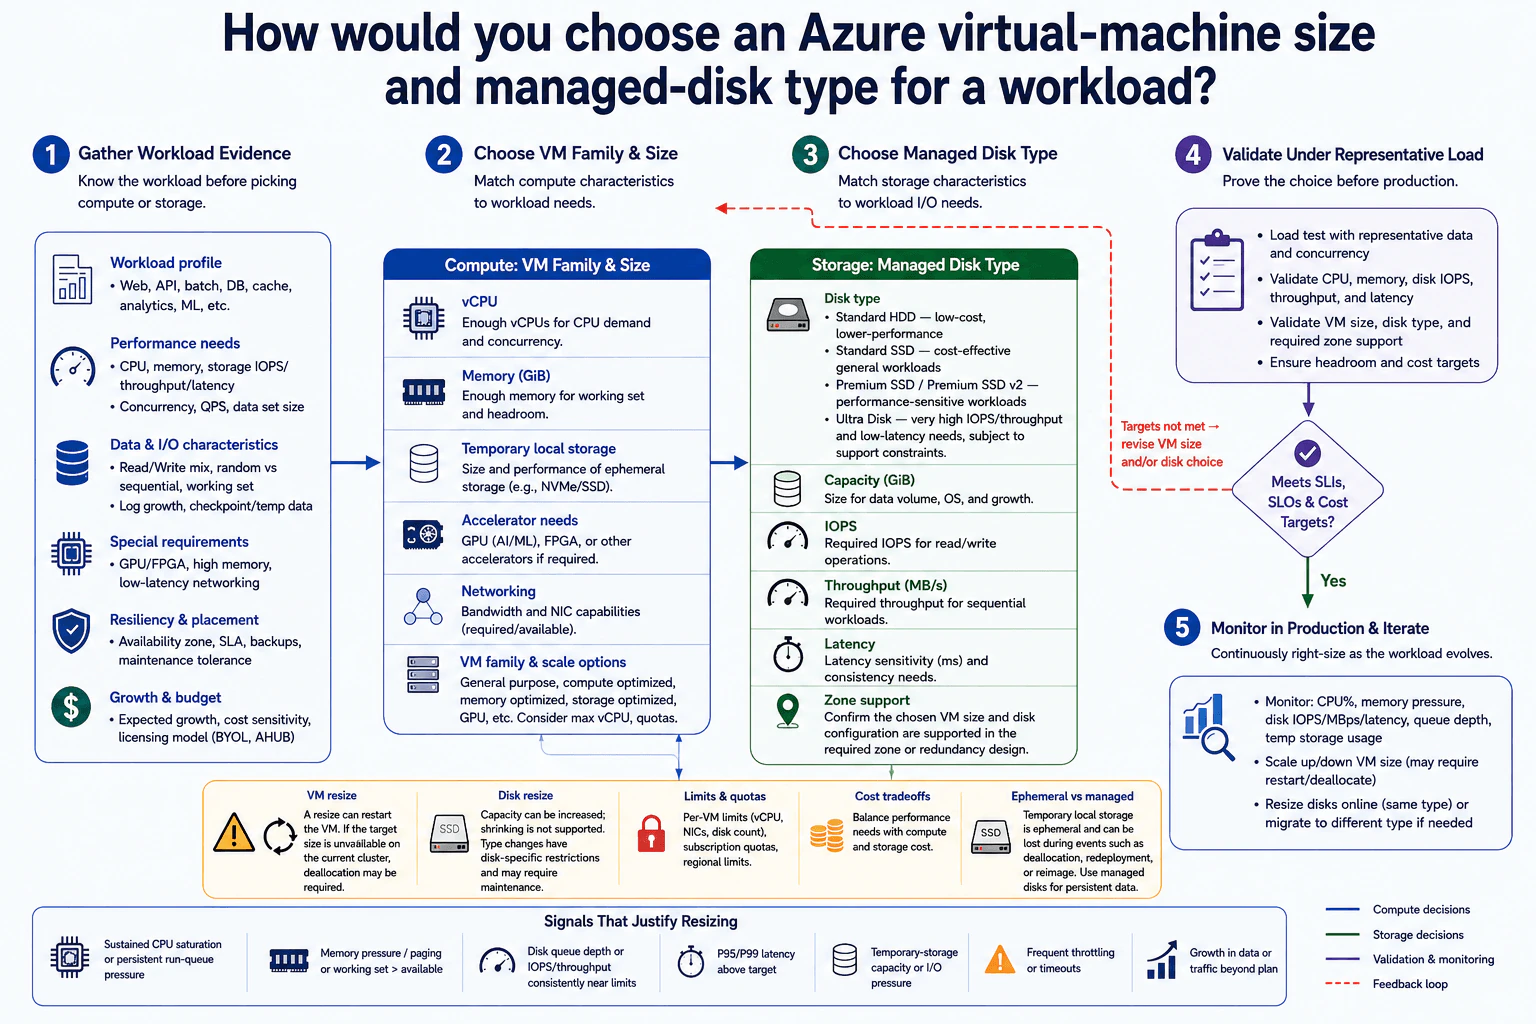
How would you choose an Azure virtual-machine size and managed-disk type for a workload? diagram
How to Explain It in an Interview
1. Gather workload evidence

I would start by understanding the workload before choosing a VM. I would check whether it is a web service, API, batch job, database, cache, analytics task, or machine-learning workload.

Then I would measure CPU demand, memory use, data size, read and write patterns, and concurrency. I would also check latency targets, IOPS, and storage throughput. IOPS means how many storage operations happen each second. Throughput means how much data storage can move over time.

I would also check network needs, temporary-data needs, accelerator requirements, availability zones, expected growth, licensing, and budget. These facts narrow the VM families that can realistically support the workload.

2. Choose the VM family and size

Next, I would match the workload to a suitable VM family. The important inputs are vCPU, memory, networking, temporary local storage, and accelerator support.

A general-purpose family can fit balanced workloads. Compute-optimized, memory-optimized, storage-optimized, or accelerator-capable families fit workloads where one resource matters more. I would then choose a size with enough capacity and reasonable headroom.

Temporary local storage is useful for scratch data or caches. It is not persistent storage. Its data can disappear during events such as deallocation, redeployment, or reimage.

I would also check per-VM limits and subscription quotas. I would not assume one SKU because the correct size depends on measured demand and available capacity.

3. Choose the managed disk

For persistent data, I would choose a managed disk based on capacity, IOPS, throughput, latency, and support in the required zone or redundancy design.

Standard HDD fits lower-cost, lower-performance needs. Standard SSD is a cost-effective choice for general workloads. Premium SSD and Premium SSD v2 suit more performance-sensitive workloads. Ultra Disk fits very high IOPS, high throughput, and low-latency needs when its support constraints fit the design.

Capacity must allow for the operating system, application data, and expected growth. I would also confirm that the VM size can support the disk performance the workload needs.

4. Validate under representative load

Before production, I would run a load test with realistic data, concurrency, and burst patterns. I would watch CPU, memory, disk IOPS, throughput, latency, network use, and available headroom.

I would also confirm that the selected VM size, disk type, and required zone support work together. If the targets are not met, I would revise the VM size, disk choice, or both and test again.

5. Monitor and resize

After release, I would keep measuring the same signals. Sustained CPU or run-queue pressure can justify more compute. Memory pressure, paging, high disk queue depth, IOPS or throughput near limits, high latency, throttling, temporary-storage pressure, or unexpected growth can also justify a change.

A VM resize can restart the VM. If the target size is unavailable on the current cluster, deallocation may be required. Managed-disk capacity can be increased, but shrinking is not supported. Disk-type changes have disk-specific restrictions and may require maintenance. I would therefore plan resizing as an operational change, not assume it is always interruption-free.

Practical Complexity & Trade-offs

The benefit is that this approach uses workload evidence instead of guessing a VM SKU. It helps balance performance, availability, and cost while leaving some headroom for growth. The downside is that the first choice may still need changes after testing. A larger VM or faster disk can improve performance, but it usually costs more. Temporary local storage can be fast, but its data is not persistent. VM resizing can restart the VM, and some changes may require deallocation. Disk capacity can grow, but it cannot be shrunk. Zone support, VM limits, and subscription quotas can also remove otherwise suitable choices.

Why Interviewers Ask This

The interviewer wants to see whether you can make a cloud sizing decision from evidence instead of memorizing Azure SKUs. They are testing whether you understand compute, memory, storage performance, temporary storage, accelerators, availability, and cost. They also want to see whether you validate assumptions with representative load and use production measurements to decide when resizing is actually needed.
Interviewer may ask next
What would you change if the workload suddenly needed much lower storage latency and much higher IOPS?

I would keep the same decision process, but I would focus more heavily on the managed-disk choice and its limits. First, I would measure the new IOPS, throughput, and latency targets under representative load. Then I would compare those needs with the supported managed-disk options.

A performance-sensitive workload may move from Standard SSD toward Premium SSD, Premium SSD v2, or Ultra Disk when the required performance and support constraints justify it. I would also verify that the selected VM size can support the required storage performance. A fast disk cannot solve the problem if the VM itself becomes the limit.

I would retest disk queue depth, IOPS, throughput, application latency, CPU, and memory. I would also confirm zone support and cost before production. The downside is higher cost and possibly more deployment restrictions. A disk-type change can have disk-specific restrictions or maintenance requirements, so I would plan that change carefully.

What would you do if production monitoring showed persistent CPU and memory pressure after launch?

I would first confirm that the pressure is sustained and not just a short spike. I would check CPU use, run-queue pressure, memory pressure, paging, application latency, and workload growth. That tells me whether the VM is truly too small or whether another resource is causing the slowdown.

If compute or memory is the limit, I would choose a larger or more suitable VM size and repeat the representative-load test. I would keep the managed disk unchanged unless storage measurements also show a problem. This keeps the change focused on the resource that is actually constrained.

I would plan for the resize because an Azure VM resize can restart the VM. If the requested size is unavailable on the current cluster, deallocation may also be required. After the change, I would measure the workload again and confirm that the new size gives enough headroom. The downside is additional cost and possible maintenance time.

2. How would you choose between hub-and-spoke and mesh networking in Azure?Cloud InfrastructureMediumMicrosoft

Question Details

Several Azure virtual networks need shared services, controlled east-west connectivity, on-premises access, and room to grow. Compare hub-and-spoke and mesh in terms of route ownership, transitive connectivity, peering limits, centralized inspection, DNS, shared gateways, segmentation, failure blast radius, cost, and operational complexity. Describe the evidence and organizational boundaries that drive the choice, how prohibited spoke-to-spoke paths are enforced, and how you would migrate without creating asymmetric routes.

Short Interview Answer (30-60 seconds)

At a high level, I would choose the topology from the traffic and control needs. The main challenge is balancing direct east-west paths with centralized security and shared services. I would compare the requirements, routing model, and ownership boundaries first. Hub-and-spoke fits when shared gateways, inspection, DNS, and simpler operations matter most. Mesh or partial mesh fits when many VNet pairs need frequent direct paths. The main trade-off is centralized control versus distributed routing and operational complexity.

Detailed Explanation

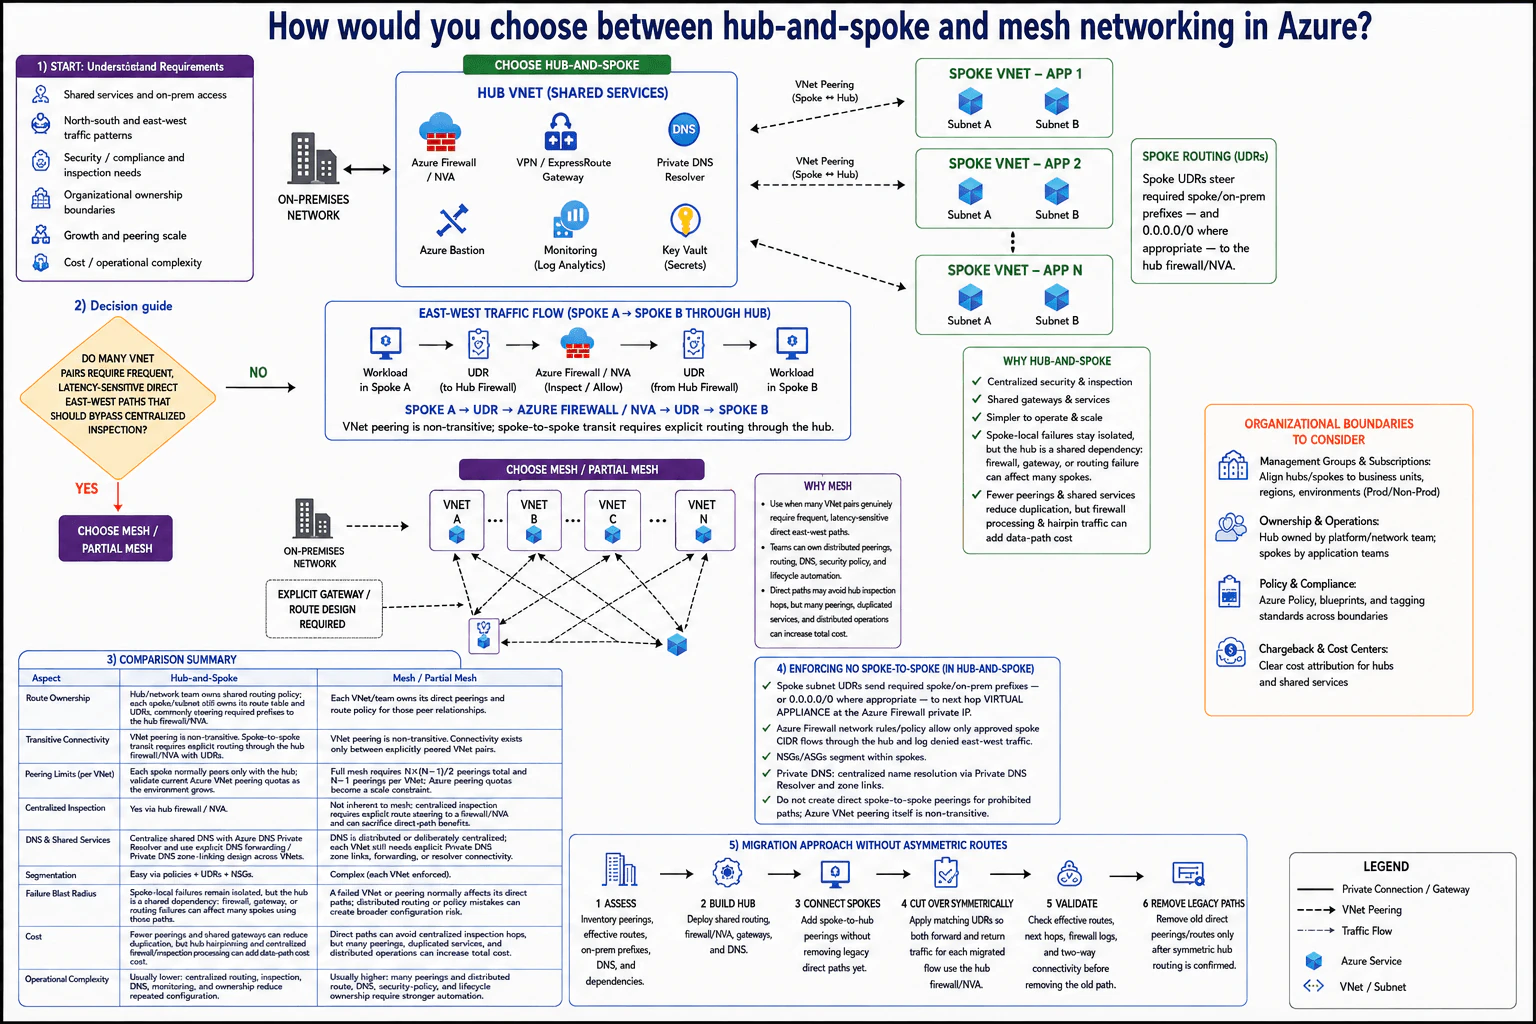
The goal is to connect several Azure VNets while keeping traffic controlled and easy to operate. Some VNets need shared services and on-premises access. Others may need direct east-west traffic, which means communication between VNets. The difficult part is deciding where routing, security, DNS, gateways, and ownership should live as the environment grows. The diagram solves this by checking the requirements first, choosing hub-and-spoke or mesh, defining the traffic path, and planning a safe migration.

Useful Questions to Ask the Interviewer
  1. How often do VNet pairs need direct east-west communication?
  2. Which shared services must all VNets reach?
  3. Which traffic must pass through centralized inspection?
  4. Who owns the hub, spokes, subscriptions, and routing changes?
  5. How quickly will the number of VNets grow?
  6. How important are direct-path latency, cost, and operational simplicity?
How would you choose between hub-and-spoke and mesh networking in Azure? diagram
How to Explain It in an Interview
1. Start with evidence and ownership

I would start with the traffic pattern and team boundaries. I would check shared services, on-premises access, security needs, growth, and cost.

In hub-and-spoke, the platform or network team normally owns shared routing policy. Each spoke still owns its route tables and UDRs, which are user-defined routes. Application teams can own their own spoke VNets. Management Groups, subscriptions, Azure Policy, and tagging can follow those business boundaries.

2. Choose the topology

The key question is whether many VNet pairs need frequent, latency-sensitive direct east-west paths. If not, I would prefer hub-and-spoke. If they do, I would consider mesh or partial mesh.

The Hub VNet holds Azure Firewall or an NVA, the VPN or ExpressRoute Gateway, Private DNS Resolver, Azure Bastion, Monitoring with Log Analytics, and Key Vault. Each spoke peers with the hub. The shared gateway gives spokes a common path to the on-premises network.

Mesh gives selected VNets direct peerings. Each VNet or team owns its direct peerings and route policy. A full mesh grows quickly because N VNets need N×(N−1)/2 peerings in total. On-premises access still needs an explicit gateway and route design because VNet peering is not transitive.

3. Explain routing, inspection, and segmentation

VNet peering is non-transitive. Two spokes cannot communicate through the hub just because both peer with it.

For controlled east-west traffic, spoke UDRs steer required prefixes to Azure Firewall or the NVA. The path is Spoke A, UDR, Azure Firewall or NVA, UDR, then Spoke B. Firewall policy allows approved spoke CIDR flows and logs denied traffic.

For prohibited paths, I would not create direct spoke-to-spoke peerings. NSGs or ASGs add workload-level segmentation inside spokes. Private DNS can be centralized with Private DNS Resolver, but forwarding and Private DNS zone links must still be designed explicitly.

4. Compare the trade-offs

Hub-and-spoke usually makes routing, inspection, DNS, monitoring, and ownership easier. Shared gateways and services reduce duplication. The downside is that the hub becomes a shared dependency. Firewall, gateway, or routing failures in the hub can affect many spokes.

Mesh keeps failures of one peering or VNet closer to its direct paths. However, distributed route, DNS, and security mistakes are harder to coordinate. Centralized inspection is also not automatic. Sending mesh traffic through a firewall requires explicit route steering and may remove the direct-path benefit.

Cost also depends on the traffic. Hub inspection and hairpin traffic can add data-path cost. Mesh can avoid some hub hops, but many peerings and duplicated services can increase operating cost.

5. Migrate without asymmetric routes

I would migrate one path at a time. First, inventory peerings, effective routes, on-premises prefixes, DNS, and dependencies. Then build the hub and add spoke-to-hub peerings without removing the old direct paths.

During cutover, matching UDRs must send both forward and return traffic through the same hub firewall or NVA. I would verify effective routes, next hops, firewall logs, and two-way connectivity. Only after symmetric routing is confirmed would I remove the old direct peerings and routes.

Practical Complexity & Trade-offs

The benefit of hub-and-spoke is simpler central control. Shared routing, security, DNS, gateways, and monitoring can live in the hub. The downside is that the hub becomes important to many spokes. Hub inspection and hairpin traffic can also add cost. Mesh gives selected VNets direct paths, which can help frequent east-west traffic. The downside is more distributed work. Teams must manage more peerings, routes, DNS links, and security policy. A full mesh also grows quickly as VNets are added. Neither design is always cheaper. The right choice comes from real traffic, security needs, growth, and ownership boundaries.

Why Interviewers Ask This

Interviewers want to see whether you can choose a network design from evidence instead of using one pattern everywhere. They are testing your understanding of Azure routing, non-transitive peering, inspection, DNS, gateways, segmentation, and failure impact. They also want to see whether you can reason about organizational ownership, peering growth, cost, operational complexity, and a migration that avoids asymmetric traffic paths.

Interviewer may ask next
What would you change if many application VNets suddenly needed frequent, latency-sensitive east-west communication?

I would keep the same overall design process, but I would reconsider which VNet pairs must travel through the hub. The diagram already shows mesh or partial mesh for cases where many pairs genuinely need frequent, latency-sensitive direct paths.

I would not automatically convert every VNet into a full mesh. I would identify the specific application pairs that need direct communication and add direct peerings only for those pairs. Other VNets could remain normal spokes behind the Hub VNet.

Those direct paths would need clear route ownership, DNS design, security policy, and lifecycle automation. On-premises access would still need an explicit gateway and route design because ordinary VNet peering is non-transitive.

I would also check that no flow goes directly in one direction and returns through Azure Firewall or the NVA. The main downside is higher operational complexity. More direct peerings mean more routes, DNS links, security policy, monitoring, and ownership work.

How would you migrate existing direct spoke-to-spoke connections into the hub without causing asymmetric routing?

I would migrate one traffic path at a time. First, I would inventory the existing peerings, effective routes, on-premises prefixes, DNS dependencies, and workloads using each path.

Next, I would build the Hub VNet services and add spoke-to-hub peerings. I would leave the old direct paths in place while preparing the cutover. For the selected flow, I would apply matching UDRs so both the forward and return directions use Azure Firewall or the NVA in the hub.

Then I would check effective routes and next hops on both sides. I would also inspect firewall logs and run two-way connectivity tests. This confirms that the traffic follows one symmetric path.

Only after those checks pass would I remove the old direct peering or route. The downside is a slower migration, but the staged approach greatly reduces the risk of broken or one-way connections.

3. How would you design a cloud system for storing and serving images and videos?Cloud InfrastructureHardMicrosoft

Question Details

Define the upload, processing, metadata, and retrieval contracts for a global media service. Cover authenticated ingestion, object identity and versioning, durable storage, multipart or resumable upload, integrity checks, asynchronous transcoding, derivative naming, content moderation boundary, metadata indexing, CDN delivery, authorization, cache invalidation, lifecycle and deletion, regional failure behavior, hot-object protection, and observability. State the consistency guarantees clients need and how the system prevents a stale derivative from being served for a newer source version.

Short Interview Answer (30-60 seconds)

At a high level, the main goal is to store images and videos safely and serve them quickly worldwide. The hard part is handling large resumable uploads while processing media in the background without serving an old derivative for a new source version. I would explain three flows: authenticated upload, background processing, and authorized CDN delivery. Versioned storage and metadata keep each source correct. Version-aware cache keys keep delivery safe. The trade-off is more operational complexity for better scale and reliability.

Detailed Explanation

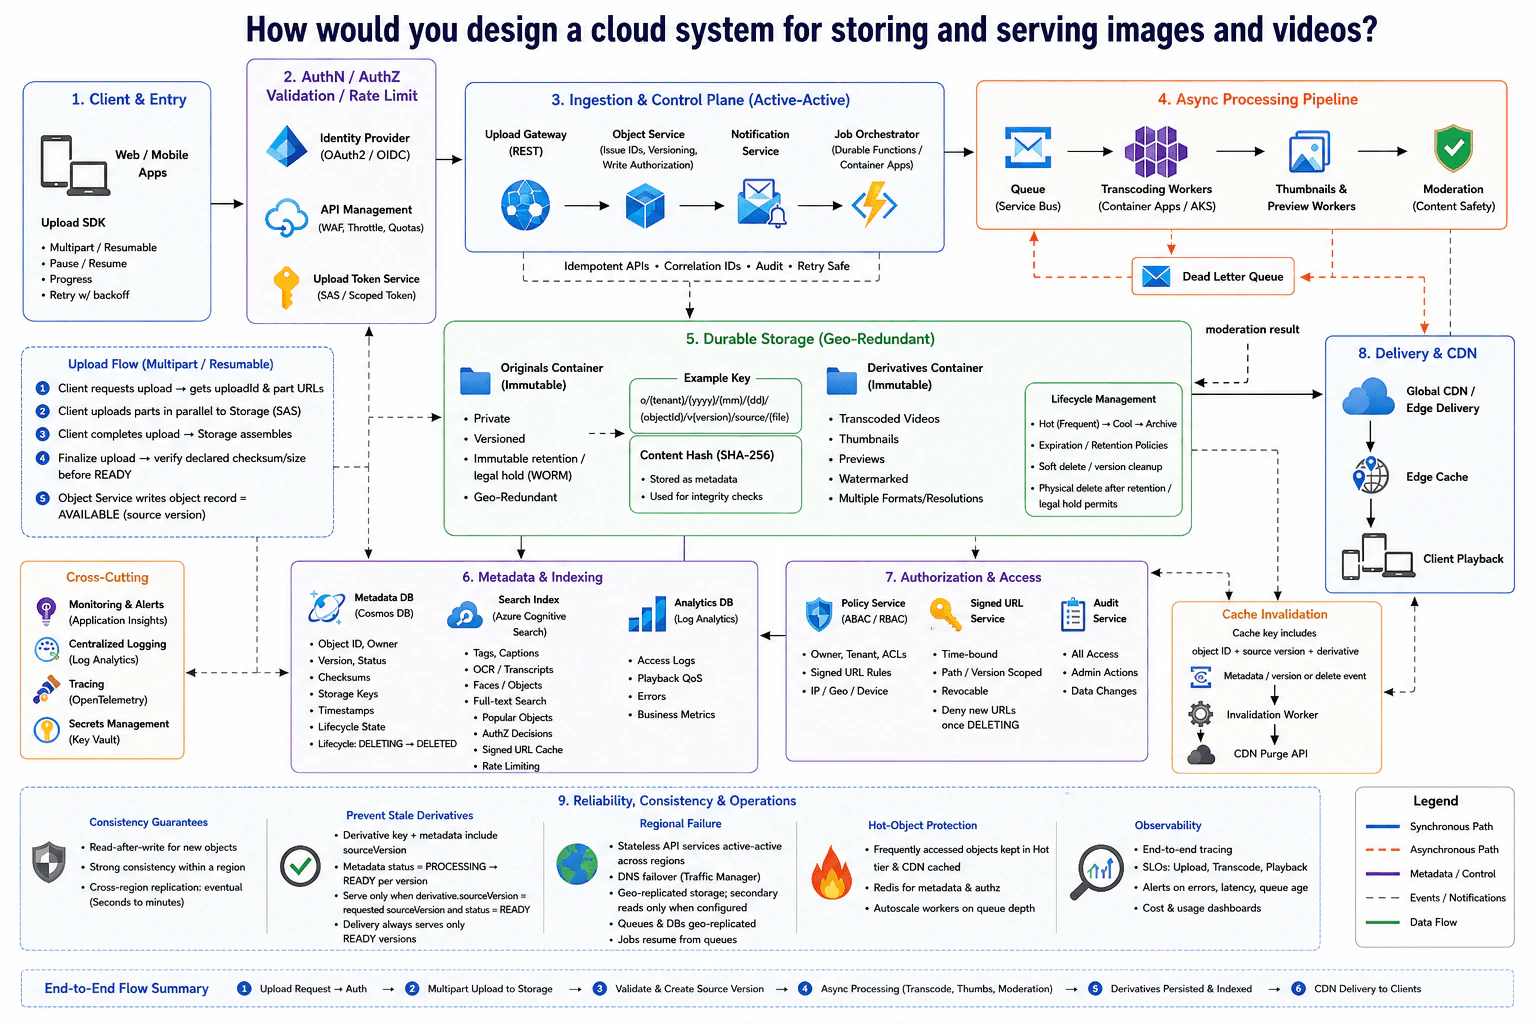
The system must accept large images and videos, store them safely, create useful versions, and deliver them quickly around the world. Uploads can stop halfway, processing can fail, and the same media can have many versions. The system must also stop an old thumbnail or video from being served after a newer source is uploaded. The diagram handles this by separating upload, background processing, metadata and authorization, and CDN delivery. Durable storage keeps the files, while metadata records which exact source version is ready to serve.

Useful Questions to Ask the Interviewer
  1. How large can images and videos become?
  2. Must interrupted uploads always support resume?
  3. Which derivative formats and resolutions are required?
  4. Must moderation finish before a version becomes READY?
  5. How long should deleted or archived media remain stored?
How would you design a cloud system for storing and serving images and videos? diagram
How to Explain It in an Interview
1. Protect the upload path

I would start by protecting uploads before accepting media. Web and mobile apps use an Upload SDK with multipart or resumable upload, pause, resume, progress, and retry with backoff. Identity Provider and API Management handle OAuth2 or OIDC identity, request validation, WAF checks, throttling, and quotas. The Upload Token Service returns a scoped SAS token so the client can upload only to the allowed object location.

2. Store an exact source version

The Upload Gateway and Object Service create an upload ID, object identity, and source version. The client uploads file parts directly to durable storage. After storage assembles the parts, finalization verifies the declared checksum and size. The Metadata DB records the object ID, owner, version, status, checksum, storage key, timestamps, and lifecycle state. Originals are private and versioned. Their key includes the tenant, date path, object ID, version, and source file. Retention or legal hold can protect data from early deletion.

3. Process media in the background

The Notification Service and durable Queue start background work after upload. The Job Orchestrator sends jobs to transcoding workers, thumbnail and preview workers, and moderation. Workers write versioned derivatives such as transcoded videos, thumbnails, previews, watermarked files, and multiple formats or resolutions. Failed work can move to the Dead Letter Queue and be retried. Required moderation contributes to the PROCESSING to READY decision instead of blocking the original upload request.

4. Index metadata and prevent stale derivatives

The Metadata DB tracks each version and its lifecycle, including DELETING and DELETED. Search Index stores searchable tags, captions, OCR or transcripts, faces or objects, and full-text data. Analytics DB stores access logs, playback quality, errors, and business metrics. Every derivative key and metadata record includes sourceVersion. A derivative is served only when derivative.sourceVersion equals the requested sourceVersion and its status is READY. This rule prevents a stale derivative from being used for a newer source.

5. Authorize and deliver through the CDN

Policy Service checks ownership, tenant rules, ACLs, IP, geography, and device rules. Signed URL Service creates time-limited and version-scoped URLs. It stops issuing new URLs once an object is DELETING. Global CDN and Edge Delivery serve the media through the Edge Cache. Cache keys include object ID, source version, and derivative. Metadata, version, or delete events go through the Invalidation Worker to the CDN Purge API for early eviction when needed.

6. Handle failures and operations

Stateless API services run active-active across regions. DNS failover can move requests away from a failed region. Storage is geo-replicated, with secondary reads only when configured. Queues and databases are also geo-replicated, so jobs can resume after failures. Frequently requested objects stay in the hot tier and CDN cache, while Redis protects metadata and authorization traffic. Monitoring, centralized logging, tracing, alerts, dashboards, secrets management, queue age, latency, and error metrics help operators find problems quickly.

Practical Complexity & Trade-offs

The benefit is that upload, processing, and delivery are separated. A large file can be stored safely before transcoding, thumbnails, or moderation finish. Versioned objects and version-aware cache keys also stop an old derivative from being served for a newer source. The downside is more moving parts. Queues, workers, metadata, authorization, invalidation, replication, and regional failover all need monitoring. Geo-replication improves resilience, but some cross-region reads can be slightly behind. CDN caching and Redis reduce load and speed up hot reads, but cache rules must stay tied to the correct source version.

Why Interviewers Ask This

The interviewer wants to see whether the candidate can split a large media problem into clear flows and keep those flows correct. They are testing judgment around safe uploads, durable storage, background jobs, versioning, authorization, caching, deletion, regional failures, and observability. A strong answer explains why each part exists and how the pieces work together, instead of only naming cloud services.

Interviewer may ask next
What would you change if users must never see a new media version until moderation finishes?

I would keep the same architecture, but make READY depend strictly on the moderation result. After upload, the source version would remain PROCESSING while transcoding, thumbnails, previews, and moderation run in the background. Moderation would send its result into the same readiness path. Only an approved result would allow that source version and its matching derivatives to become READY.

The Policy Service and Signed URL Service would check that state before a playable URL is issued. The derivative rule would stay unchanged. The system serves a derivative only when derivative.sourceVersion matches the requested sourceVersion and status is READY. Failed moderation work would continue using the Queue and Dead Letter Queue paths.

The main downside is slower availability. A new upload may remain unavailable while moderation is busy, delayed, or retrying.

How would this design behave if one region becomes unavailable during heavy traffic?

I would keep the stateless API services active-active across regions and use the existing DNS failover path to send new requests away from the failed region. Durable media is stored in geo-replicated storage. Secondary reads are used only when that storage configuration allows them. Queues and databases are also geo-replicated, so background jobs can resume instead of being lost.

The CDN and Edge Cache reduce pressure on the origin during the failure because popular objects may already be close to users. Workers can continue processing durable queued jobs from the surviving environment. Monitoring should watch errors, latency, queue age, and playback behavior during recovery.

The main downside is that recovery is not instant. Some requests can fail briefly, and replicated data in another region may be slightly behind until replication catches up.

4. How do Docker image layers affect build caching, image size, and runtime behavior?Containers And KubernetesEasyMicrosoft

Question Details

A Docker image is built from a multi-step Dockerfile and is rebuilt frequently in CI. Explain how instructions create immutable layers, how the writable container layer differs, how cache keys and build context affect reuse, and why deleting a file in a later layer may not remove its bytes from the image history. Cover layer sharing, pull behavior, package-cache cleanup, secrets that must never enter a layer, and the evidence you would inspect to find an unexpectedly large or stale image.

Short Interview Answer (30-60 seconds)

At a high level, Docker images are built from read-only layers, while each running container adds its own writable layer. The main challenge is getting fast CI rebuilds without creating large images or leaking secrets. I would explain this in three parts: how image layers work, how cache reuse works, and how layers behave at runtime. Good Dockerfiles keep stable steps early, remove temporary package data in the same layer, and keep secrets out of image layers.

Detailed Explanation

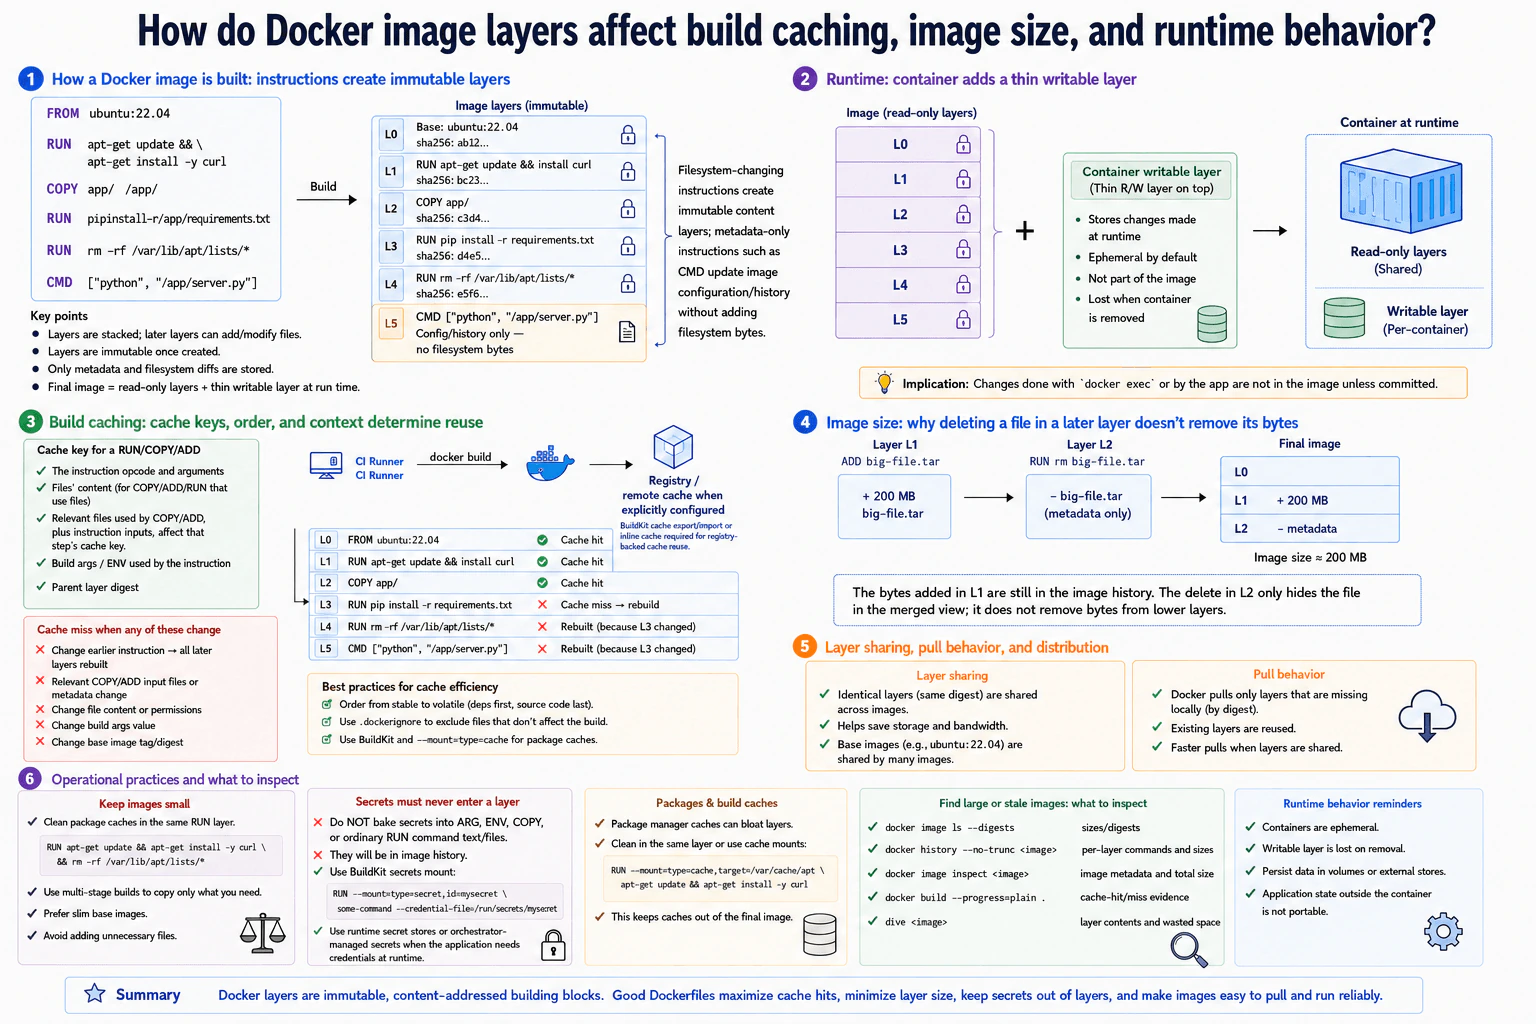
Docker builds an image step by step from a Dockerfile. Instructions that change the filesystem create read-only content layers. Metadata-only instructions, such as CMD, change image configuration without adding filesystem bytes. The hard part is keeping repeated CI builds fast while keeping the final image small and safe. The diagram explains this through the image layer stack, build-cache reuse, the container writable layer, layer sharing, package cleanup, secret handling, and inspection commands.

Useful Questions to Ask the Interviewer
  1. Are CI builds using BuildKit and an explicitly configured remote cache?
  2. Is the main goal faster rebuilds, smaller final images, or both?
  3. Does the build need private packages or other secrets?
How do Docker image layers affect build caching, image size, and runtime behavior? diagram
How to Explain It in an Interview
1. Explain how Docker builds the image

I would start with the Dockerfile. The base image forms the first read-only content layers. Filesystem-changing RUN and COPY instructions then create new content layers.

The diagram also shows CMD separately. CMD changes image configuration and history, but it does not add filesystem bytes. Once content layers are created, later layers do not rewrite them.

2. Explain the writable runtime layer

When a container starts, it uses the image's read-only layers and adds a thin writable layer on top. Application writes and temporary changes go into this per-container layer.

The writable layer is not part of the image. It is normally lost when the container is removed. Data that must survive should use a volume or another external store.

3. Explain build caching in CI

Build caching can make repeated CI builds much faster. A cached result can be reused when the instruction, parent layer, and relevant inputs still match.

For COPY and ADD, relevant file content and metadata affect reuse. Build arguments or environment values used by an instruction can also affect its result. If an earlier layer changes, later dependent steps usually rebuild.

That is why stable dependency steps should come before frequently changing source code. The diagram also shows a CI Runner building the image. A registry becomes a remote cache source only when BuildKit cache export and import, or inline cache, is explicitly configured.

4. Explain why deleting a file may not shrink the image

A later layer can hide a file without removing its bytes from an earlier layer. The diagram adds a 200 MB big-file.tar in one layer and removes it in the next. The file disappears from the final merged view, but the original bytes still remain in the older layer.

For package managers, installation and cleanup should happen in the same RUN instruction. Multi-stage builds and slim base images can also keep unnecessary files out of the final image.

5. Explain sharing, security, and inspection

Identical layers use the same digest and can be shared across images. During a pull, Docker only needs layers that are missing locally. This can save storage and network transfer.

Secrets must never be baked into ARG, ENV, COPY, or ordinary RUN content. A BuildKit secret mount lets a command read a secret temporarily from /run/secrets without copying it into the resulting filesystem layer. Runtime credentials should come from a runtime secret store or orchestrator-managed secret mechanism.

For a large or stale image, I would inspect docker image ls --digests, docker history --no-trunc <image>, docker image inspect <image>, docker build --progress=plain ., and dive <image>. These show image size, layer history, metadata, cache evidence, and wasted layer contents.

Practical Complexity & Trade-offs

The benefit of layers is reuse. CI can skip work when an earlier result still matches, and different images can share identical layers. The downside is that old bytes remain inside older layers. Deleting a large file later may hide it without shrinking the image. Cleaning temporary package data in the same RUN step avoids that problem. Stable steps should come before frequently changing code to improve cache reuse. Remote cache reuse also needs explicit BuildKit configuration. Secrets need special handling because anything baked into a normal image layer can remain in image history.

Why Interviewers Ask This

Interviewers want to see whether you understand what Docker is doing behind the commands. They are checking whether you can explain slow rebuilds, unexpectedly large images, and the difference between image data and container runtime changes. They also want good judgment about Dockerfile ordering, layer sharing, package cleanup, secret handling, remote caching, and practical troubleshooting evidence.

Interviewer may ask next
What would you change if CI builds are slow because package installation runs again after every source-code change?

I would reorder the Dockerfile so stable dependency work happens before frequently changing application files. For example, I would copy only the dependency files first, run the package installation, and then copy the rest of the source code.

If only application code changes, Docker can then reuse the dependency layer instead of downloading and installing everything again. I would also use .dockerignore so unnecessary files are not sent in the build context.

For package download caches, I could use a BuildKit cache mount. That cache helps later builds without becoming part of the final image. If CI runners do not keep local build cache, I would explicitly configure BuildKit remote cache export and import through the registry.

The downside is a little more Dockerfile and CI configuration. The benefit is much faster repeated builds when dependencies have not changed.

How would you investigate an image that suddenly became much larger even though the final container does not show any large new files?

I would inspect the image layer history instead of looking only at the final container filesystem. A large file may have been added in one layer and deleted in a later layer. The later deletion hides the file, but the older layer can still contain its bytes.

I would start with docker image ls --digests to confirm the image and size. Then I would run docker history --no-trunc <image> to find unusually large layers and the commands that created them. docker image inspect <image> shows image metadata and total size. I would also use dive <image> to inspect layer contents and wasted space.

If package caches or temporary files caused the growth, I would create and remove them in the same RUN instruction. If build-only files caused it, I would use a multi-stage build. The downside is some Dockerfile work, but the final image becomes smaller.

5. How would you diagnose a Helm release that produced unexpected Kubernetes manifests?Containers And KubernetesMediumMicrosoft

Question Details

A Helm upgrade completed, but the live Kubernetes objects do not match what the operator expected from the chart and values. Build a read-only investigation that captures the release revision, chart version, supplied and computed values, rendered manifests, hooks, post-renderers, ownership annotations, live-object differences, and any manual or controller changes. Explain how you would distinguish a wrong values file, template condition, dependency version, stale release history, failed hook, and post-deployment mutation before choosing rollback or a corrected upgrade.

Short Interview Answer (30-60 seconds)

At a high level, I would treat this as a read-only reconstruction problem. The main challenge is separating what Helm intended from what Kubernetes is running now. I would work through three flows: recover the release inputs and revision, reproduce and inspect Helm's stored output, then compare it with live objects. I would check hooks, post-renderers, ownership metadata, and controller changes. Only after finding the cause would I choose rollback, a corrected upgrade, or documented drift.

Detailed Explanation

The upgrade completed, but the live Kubernetes objects are different from what the operator expected. The goal is to explain where that difference appeared without changing the cluster during diagnosis. I need to reconstruct what Helm was given, what Helm recorded for the release, and what Kubernetes is running now. I can then separate a values or template problem from a dependency issue, old release history, a failed hook, post-rendering, or a change made after deployment.

Useful Questions to Ask the Interviewer
  1. Which release name, namespace, revision, and kube-context are we investigating?
  2. Do we still have the exact chart package and deployment inputs?
  3. Was a post-renderer used during this upgrade?
  4. Are controllers, operators, or admission webhooks allowed to change these objects?
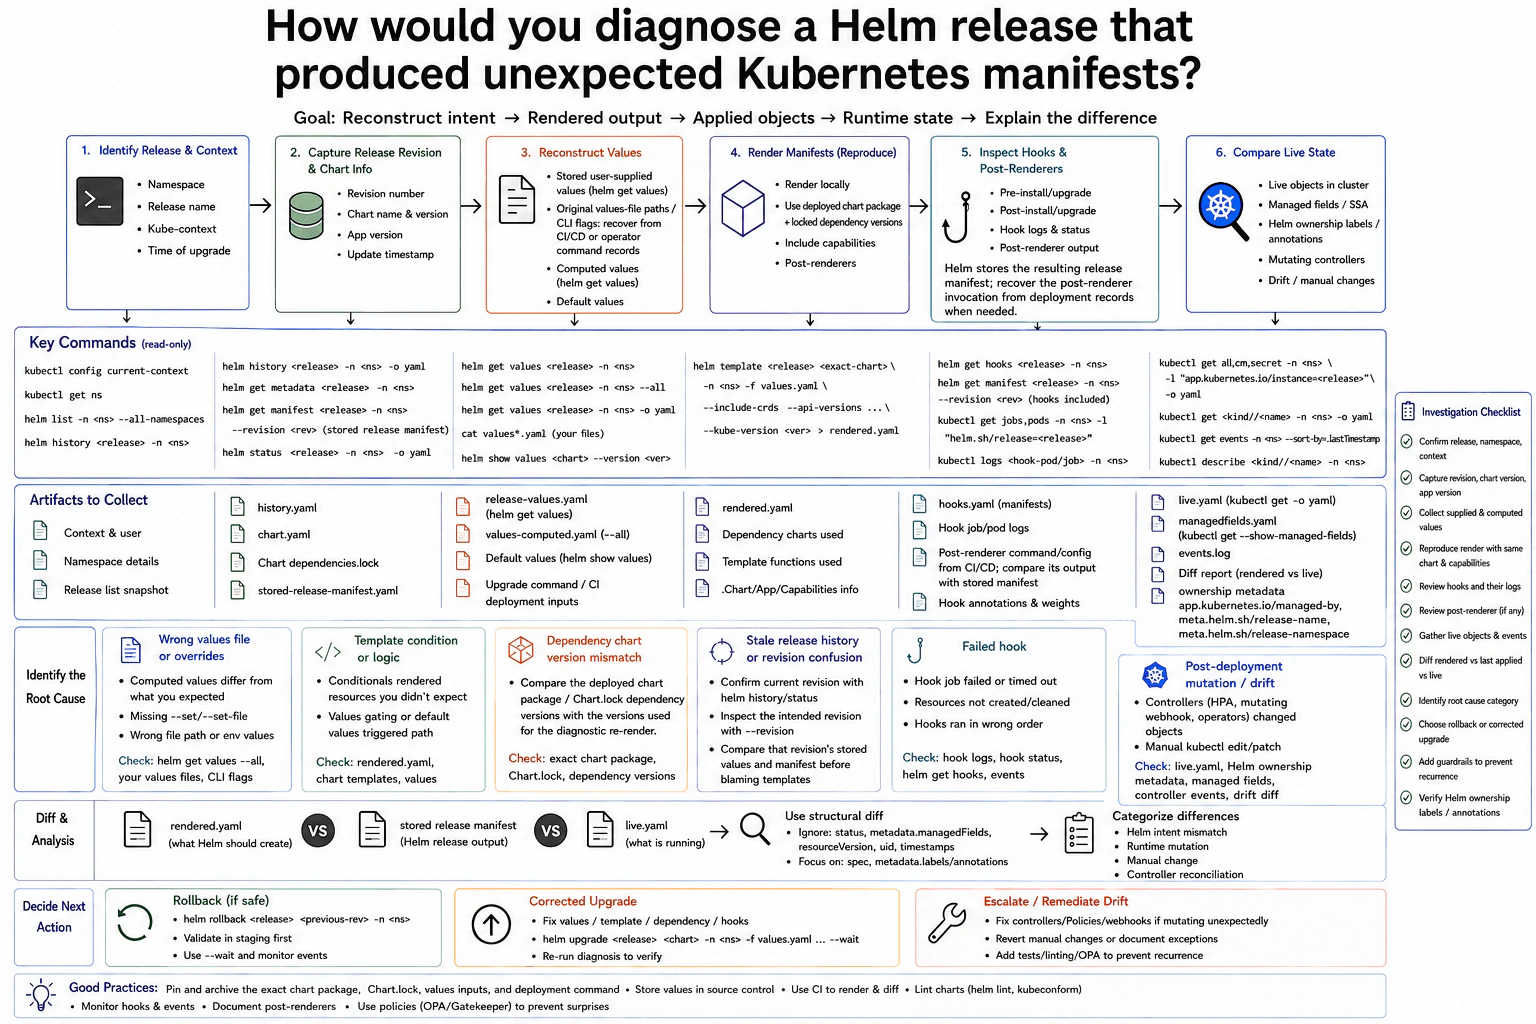
How would you diagnose a Helm release that produced unexpected Kubernetes manifests? diagram
How to Explain It in an Interview
1. Identify the release and capture its history

I would start by confirming the release name, namespace, kube-context, and upgrade time. This protects me from debugging the wrong release or cluster.

Then I would inspect helm history, helm status, and helm get metadata. I want the revision number, chart name and version, app version, and update time. I would also retrieve the stored release manifest for the revision being investigated.

2. Reconstruct the values and deployment inputs

Next, I would collect the stored user-supplied values with helm get values. I would also use --all to see the computed values after chart defaults are included.

Helm does not preserve every original values-file path or command-line flag. I would recover those from CI/CD records or the operator command. A mismatch here points toward a wrong values file, missing override, or incorrect environment input.

3. Reproduce the rendered manifests

Then I would render the deployed chart package locally. I would use the recovered values, locked dependency versions, Kubernetes capabilities, and the same post-rendering behavior when that information is available.

I would compare rendered.yaml with Helm's stored release manifest. If they differ before looking at the live cluster, I would investigate template conditions, dependency versions, missing inputs, or post-rendering differences.

4. Inspect hooks and post-renderers

I would inspect helm get hooks, hook jobs or pods, their logs, and relevant events. A failed hook can leave resources missing, incomplete, or created in the wrong order.

For a post-renderer, Helm stores the resulting release manifest. The post-renderer command or configuration normally has to come from deployment records. I would compare that evidence with the stored manifest.

5. Compare the stored release with live Kubernetes state

Finally, I would collect live objects, events, managed fields, and Helm ownership metadata. Managed fields help show which manager changed particular fields. Helm ownership includes the managed-by label and release name and namespace annotations.

I would compare three states: locally rendered output, the stored release manifest, and live.yaml. Differences only in live state point toward manual edits, HPA behavior, mutating webhooks, operators, or other controllers.

A stale-history problem appears when the operator expected one revision but a different revision or reused values were actually deployed. After classifying the cause, I would choose the smallest safe action: roll back to a known good revision, run a corrected upgrade, or document expected controller-managed drift.

Practical Complexity & Trade-offs

The benefit is that the investigation stays read-only, so debugging does not create more drift. Comparing locally rendered output, Helm's stored release manifest, and live objects also shows where the difference appeared. The downside is that exact reproduction needs good deployment records. Helm does not keep every original values-file path, CLI flag, or post-renderer command. Controllers can also change objects after Helm finishes, which makes a simple text diff noisy. Managed fields, ownership metadata, events, and controller evidence help explain that noise. Archiving exact chart packages, Chart.lock, values inputs, and deployment commands makes later investigations much easier.

Why Interviewers Ask This

The interviewer wants to see whether you debug Kubernetes changes in a careful order instead of immediately rolling back. They are testing whether you understand Helm revisions, values, rendering, dependencies, hooks, post-renderers, ownership metadata, and live-object changes. They also want to see whether you can separate deployment mistakes from later manual or controller changes and choose a safe action based on evidence.

Interviewer may ask next
What would you do if the original values file and deployment command were no longer available?

I would keep the same investigation, but I would clearly separate known facts from inputs I can only reconstruct. I would start with Helm's stored user-supplied values and computed values. Then I would collect the release history, metadata, stored release manifest, and exact chart package if it is still available.

Next, I would search CI/CD records for values-file references, --set arguments, post-renderer configuration, and the upgrade command. If those records are missing, I would not claim that my local render exactly reproduces the original upgrade.

I could still compare the stored release manifest with the live Kubernetes objects. That is useful because the stored manifest shows the release output Helm recorded. Differences in live state can still reveal manual edits, controller changes, admission mutations, or other drift.

The main downside is lower confidence about why Helm originally produced that manifest. I can investigate later mutations well, but some original input mistakes may remain uncertain.

How would you tell whether a live difference came from Helm or from a Kubernetes controller after deployment?

I would compare Helm's stored release manifest with the current live object first. If the field already appears in the stored manifest, it was part of the Helm release output rather than a later runtime change.

If the field is missing or different in the stored manifest but appears in the live object, I would inspect managed fields, events, and controller behavior. Managed fields help show which manager has been writing particular fields. I would also check Helm ownership labels and annotations to confirm that the object belongs to the expected release.

Then I would look at the mutation sources shown in the diagram. These include HPA behavior, mutating webhooks, operators, and manual kubectl edit or patch activity.

This separates release output from post-deployment mutation. The downside is that historical evidence may be incomplete because old events can disappear. Good deployment and audit records make this diagnosis much stronger.

6. How would you choose and operate an AKS deployment strategy with Helm?Containers And KubernetesHardMicrosoft

Question Details

An AKS-hosted service needs controlled releases through a versioned Helm chart. Compare rolling, blue-green, and canary approaches using workload identity, Services or ingress routing, readiness, capacity during overlap, database and API compatibility, chart values, hooks, release history, and automated health gates. Define pause, abort, and rollback behavior, ownership of generated objects, handling of a failed Helm upgrade, and the evidence that traffic returned to a known-good version without rebuilding the image.

Short Interview Answer (30-60 seconds)

At a high level, the goal is to release an AKS service safely through a versioned Helm chart. The main challenge is controlling how much traffic reaches a new version while keeping recovery simple. I would explain three parts: choosing rolling, blue-green, or canary, checking every release with automated health gates, and returning traffic to a known-good Helm revision when something fails. Rolling needs less extra capacity. Blue-green and canary give stronger release control, but need more capacity or more routing control.

Detailed Explanation

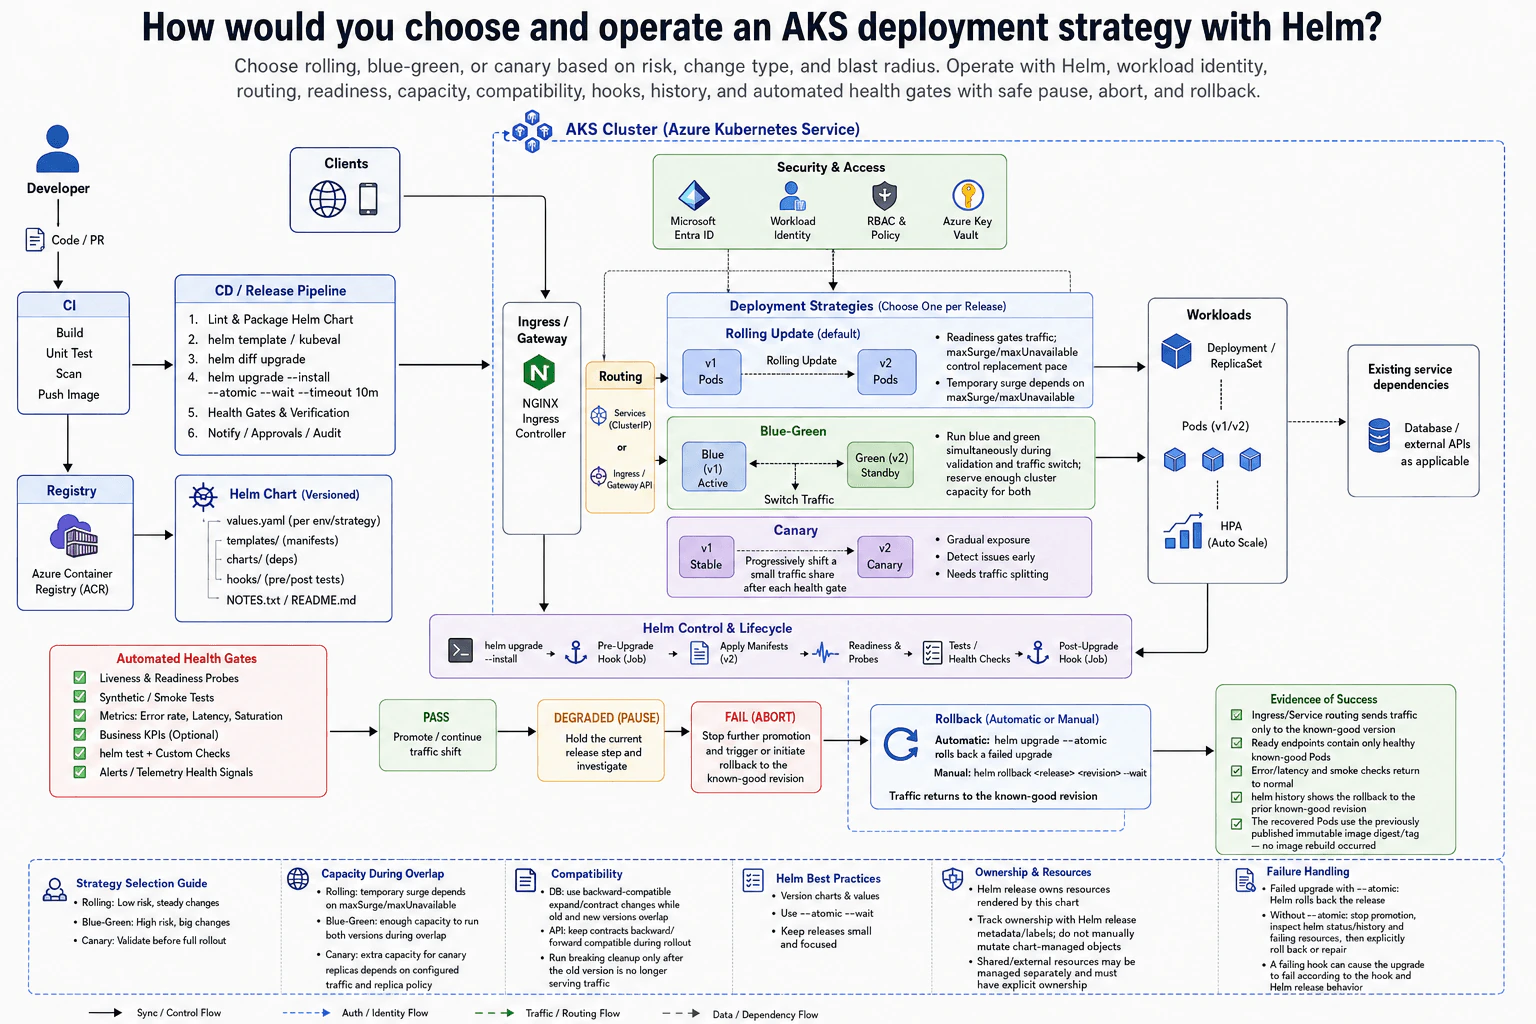
The goal is to release a new version of an AKS service without sending users to an unhealthy version. The hard part is that releases have different levels of risk. A routine change may fit a rolling update. A risky change may need blue-green or canary. The diagram uses one versioned Helm chart, one AKS release path, and three deployment choices. Each choice uses readiness checks and health gates before more traffic reaches the new version. If a release fails, Helm can return the service to a known-good revision using an image that was already published.

Useful Questions to Ask the Interviewer
  1. How risky are the changes we normally release?
  2. Can the AKS cluster run two application versions at the same time?
  3. Can the Service, ingress, or gateway split or switch traffic?
  4. Must database and API changes work with both versions during rollout?
  5. Which health signals should automatically pause or abort a release?
How would you choose and operate an AKS deployment strategy with Helm? diagram
How to Explain It in an Interview
1. Explain the versioned Helm release path

I would start with one controlled release package. CI builds, tests, and scans the application image, then pushes it to Azure Container Registry. The versioned Helm chart contains templates, hooks, dependencies, and values.yaml settings for each environment and deployment strategy.

The CD pipeline can inspect the rendered manifests with helm template, kubectl, and helm diff upgrade. It then runs helm upgrade --install --atomic --wait. Helm applies the Kubernetes objects inside AKS. Pre-upgrade and post-upgrade hooks can run release jobs before or after the main manifests.

2. Choose rolling, blue-green, or canary

For normal changes, I would usually choose Rolling Update. Kubernetes replaces v1 Pods with v2 Pods gradually. Readiness gates traffic, so a new Pod must become ready before it serves requests. maxSurge and maxUnavailable control replacement speed and temporary capacity.

For a high-risk change, blue-green runs Blue and Green together. Blue stays active while Green is validated. A Service, ingress, or Gateway API then switches traffic. This requires enough cluster capacity for both versions during the overlap.

Canary keeps stable v1 and canary v2 running together. Routing sends a small traffic share to the canary. Exposure grows only after each health gate passes. This reduces early blast radius, but it needs traffic-splitting support.

3. Keep access, routing, and workloads safe

Clients enter through the ingress or gateway path. The diagram shows an NGINX Ingress Controller and routing through a ClusterIP Service or Ingress/Gateway API. The selected route sends traffic to the Deployment and ReplicaSet Pods.

Microsoft Entra ID, Workload Identity, RBAC, policy, and Azure Key Vault form the security path. Workload Identity lets Pods access permitted Azure resources without storing long-lived cloud credentials. HPA can change replica count as load changes, but release safety still depends on readiness and the chosen rollout strategy.

4. Keep database and API changes compatible

Old and new Pods can run at the same time. Database changes should therefore use backward-compatible expand-and-contract steps. API contracts should also work with both application versions during the rollout.

Existing service dependencies may include a database or external APIs as applicable. Breaking cleanup should happen only after the old version is no longer serving traffic. This keeps rollback possible while versions overlap.

5. Use health gates to pause, abort, or continue

The release checks liveness and readiness probes, smoke tests, error rate, latency, business checks, Helm tests, custom checks, and telemetry signals. A PASS continues promotion or the traffic shift. A DEGRADED result means PAUSE. The release stays at its current step while the team investigates without increasing exposure.

A FAIL means ABORT. Further promotion stops and rollback starts or is triggered. This keeps a bad version from receiving more traffic.

6. Roll back and prove recovery

With helm upgrade --atomic, a failed upgrade rolls back automatically. Without --atomic, I would stop promotion, inspect helm status, helm history, the failing resources, probes, and hooks, then repair the issue or run helm rollback <release> <revision> --wait.

helm history <release> identifies the known-good revision and records upgrade and rollback revisions. Helm manages the resources rendered by its chart. Shared or external resources need separate, explicit ownership and should not be treated as Helm-owned unless the chart actually manages them.

After rollback, I would verify that ingress or Service routing reaches only the known-good version. Ready endpoints should contain only healthy known-good Pods. Error rate, latency, and smoke checks should return to normal. Helm history should show the rollback revision. Finally, the recovered Pods should use the previously published image digest or tag. That proves recovery did not rebuild the image.

Practical Complexity & Trade-offs

The benefit of rolling updates is simplicity and lower extra capacity. The downside is that old and new Pods can run together during the change. Blue-green makes the traffic switch and rollback simple, but both versions need enough cluster capacity during the overlap. Canary limits how many users see the new version first, but traffic splitting and health checks become more complex. All three approaches need compatible database and API changes while versions overlap. Automated health gates reduce release risk, but they must use useful signals. A wrong signal can pause or roll back a healthy release. Clear Helm ownership also avoids manual changes that later conflict with chart-managed resources.

Why Interviewers Ask This

The interviewer wants to see whether you can choose a deployment strategy based on risk instead of using one method for every release. They also want to see how you connect Helm, Kubernetes readiness, routing, workload identity, compatibility, health gates, rollback, and ownership. A strong answer shows practical judgment about capacity, failure handling, and how to prove that users really returned to a known-good version.

Interviewer may ask next
What would you change if the AKS cluster does not have enough spare capacity for blue-green deployment?

I would keep the same Helm release process, but I would avoid blue-green because Blue and Green must run together during validation and the traffic switch. If the change has normal risk, I would use Rolling Update. Kubernetes can replace Pods gradually, while maxSurge and maxUnavailable control the temporary extra capacity and the number of unavailable Pods.

If I still want gradual risk reduction, I could use a small canary. Stable v1 and canary v2 would run together, and the routing layer would send only a small traffic share to v2. Health gates would decide whether exposure can increase.

I would still keep database and API changes compatible because old and new versions may overlap. Readiness would keep unhealthy Pods out of Service endpoints. A failed release would still return to the known-good Helm revision.

The downside is less isolation. Rolling or a small canary uses less spare capacity, but a bad change may affect more users than a fully isolated blue-green release.

What would you do if a Helm upgrade fails after some new Pods have already started?

I would stop further promotion first. If the release used helm upgrade --atomic, Helm rolls the failed upgrade back automatically. If it did not use --atomic, I would inspect helm status, helm history, the failing Kubernetes resources, readiness checks, and any pre-upgrade or post-upgrade hooks. Then I would repair the issue or run helm rollback <release> <revision> --wait to the known-good revision.

Traffic should not increase toward unhealthy Pods because readiness keeps them out of ready endpoints. With blue-green or canary, I would also stop any further traffic switch or traffic increase.

After rollback, I would check that ingress or Service routing reaches only the known-good version. Ready endpoints should contain healthy known-good Pods. Error rate, latency, and smoke checks should return to normal. helm history should show the rollback revision.

I would also confirm that those Pods use the previously published image digest or tag. That proves recovery did not depend on rebuilding the image. The main downside is that rollback is only safe when database and API changes remain compatible with the older application version.

7. How do Terraform, ARM templates, and Bicep differ for Azure infrastructure?Infrastructure As CodeEasyMicrosoft

Question Details

Compare the three approaches for provisioning the same Azure resource set. Address authoring model and language, provider or resource-type coverage, state or deployment-history behavior, preview and change review, dependency expression, modules, policy integration, secret handling, rollback or recovery, tooling, and support for resources outside Azure. Explain which team or workload constraints would favor each option without treating one tool as universally superior.

Short Interview Answer (30-60 seconds)

Terraform fits multi-cloud or provider-rich environments but requires Terraform state management. ARM templates are native Azure JSON with Azure deployment history. Bicep provides a cleaner Azure-native language that compiles to ARM. Choose based on platform scope, state needs, tooling, governance, and team skills.

Detailed Explanation

This question asks how three ways of describing Azure infrastructure differ even when they create the same final resources. The goal can be identical, but the way teams write, review, organize, protect, and recover infrastructure changes with each choice. One option can manage Azure plus other platforms, while the other two stay closely tied to Azure. Teams should also compare how changes are previewed, how deployments are tracked, how reusable building blocks work, how sensitive information is protected, and what skills and operating model the team already has.

Useful Questions to Ask the Interviewer
  1. Is the environment Azure-only, or must the same IaC workflow also manage other clouds or external services?
  2. Does the team already use Terraform state backends, ARM JSON, or Bicep modules?
  3. Are there enterprise requirements for Azure Policy, change approval, secret handling, and CI/CD tooling?
  4. Is avoiding an externally managed state file an important constraint?
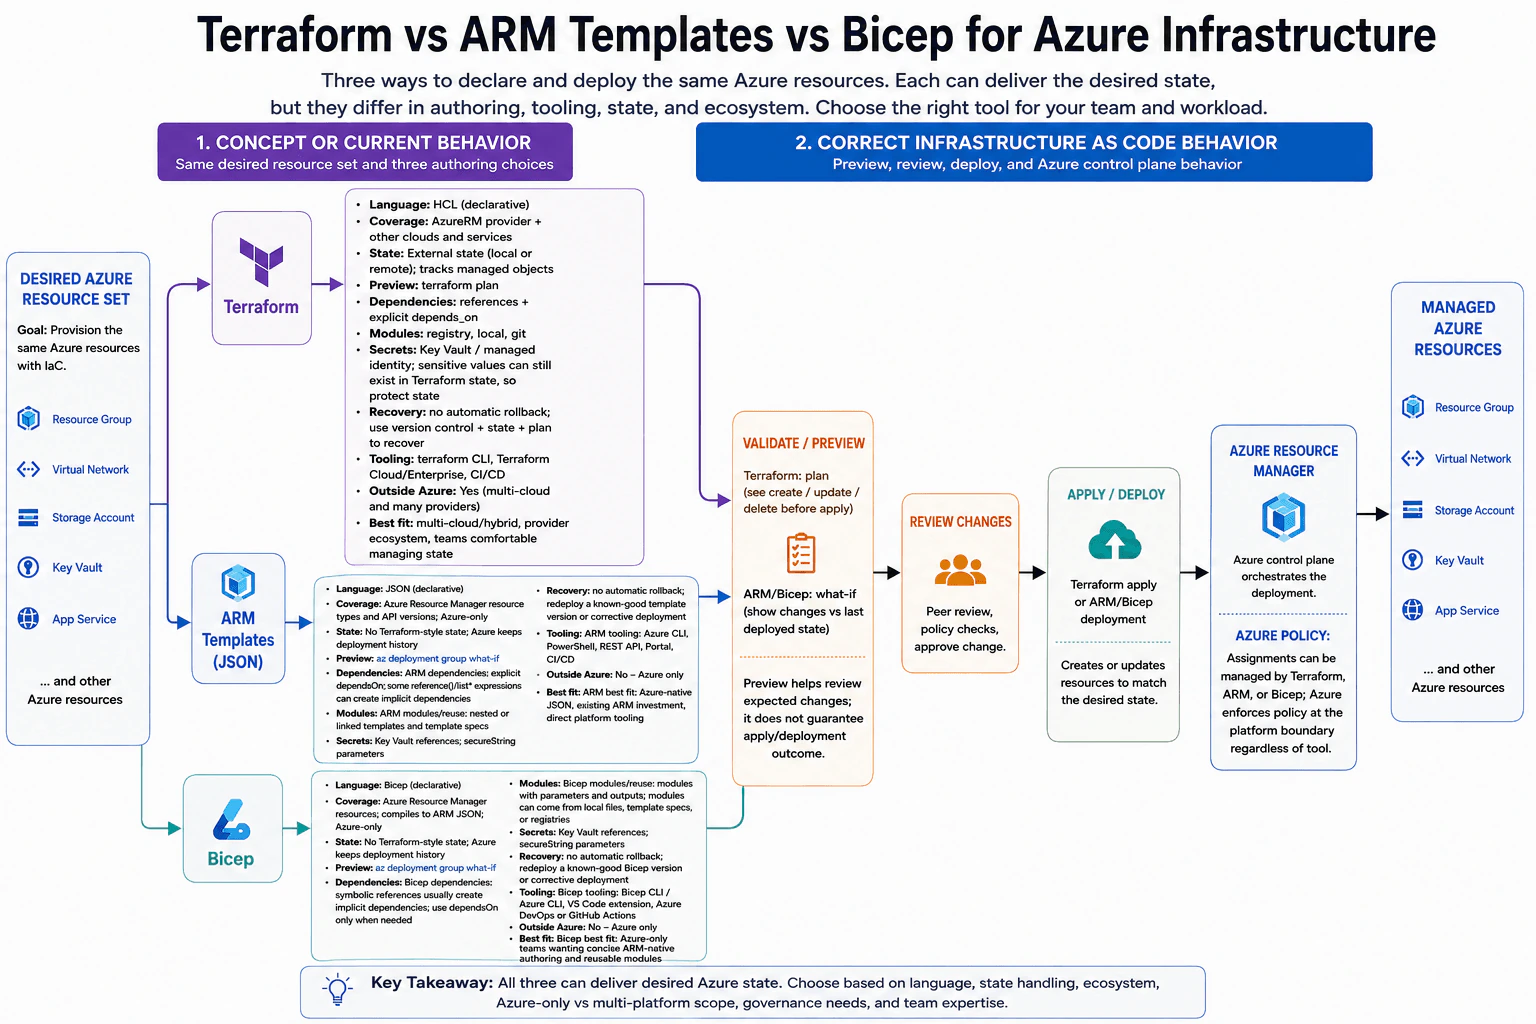
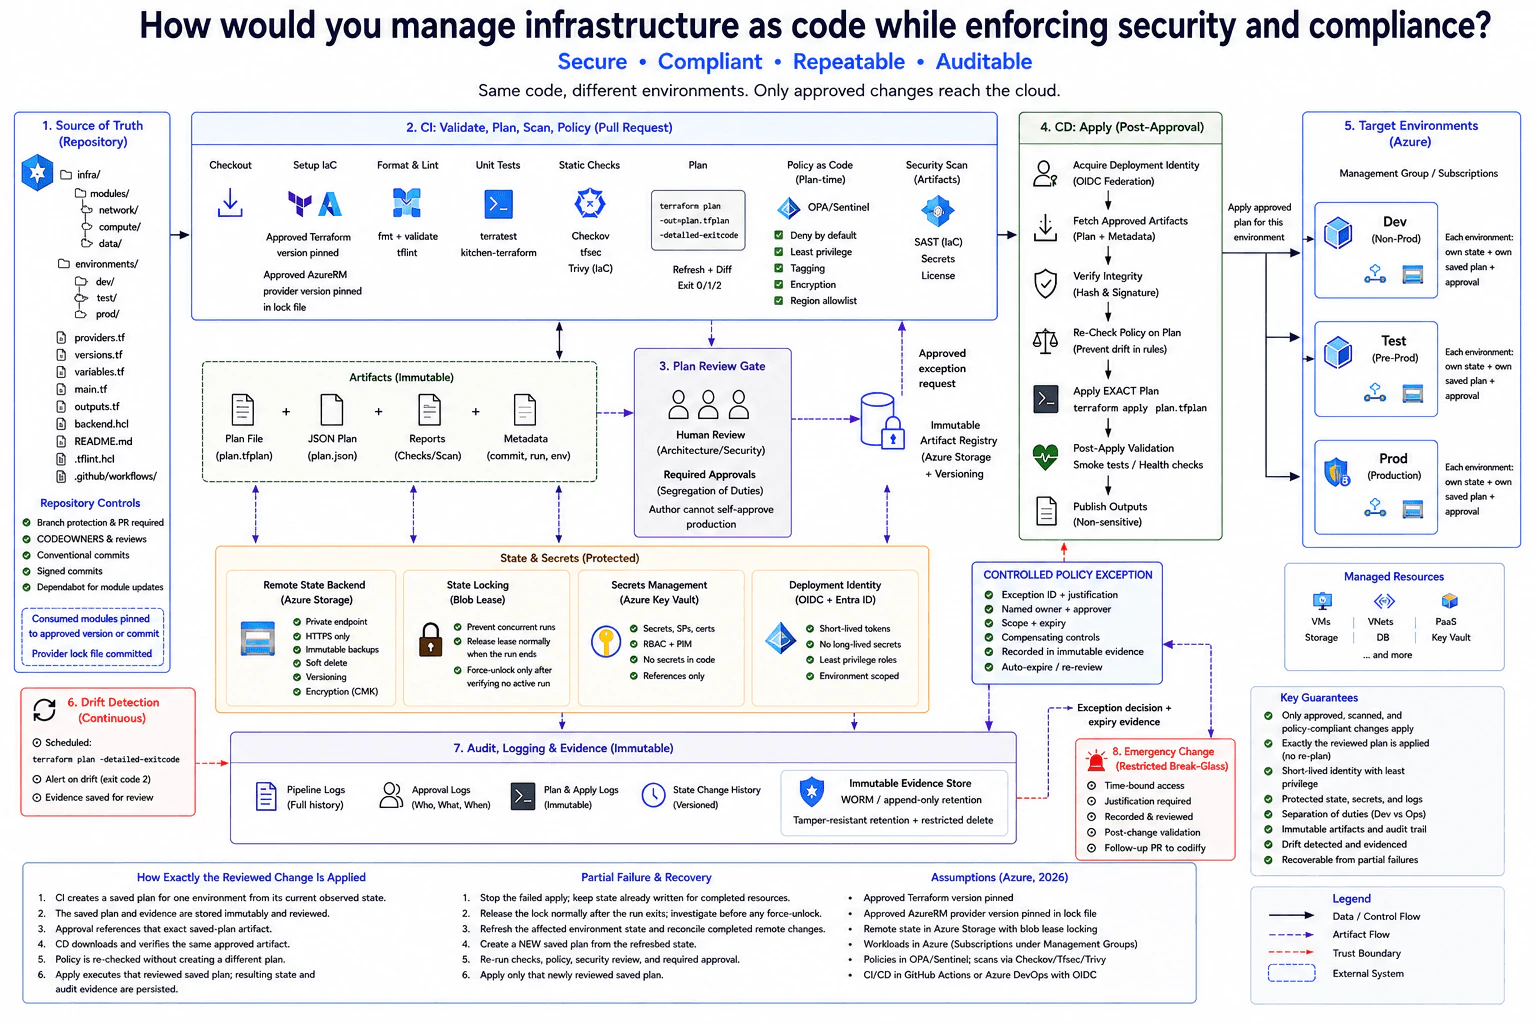
How do Terraform, ARM templates, and Bicep differ for Azure infrastructure? diagram
How to Explain It in an Interview

Assumption: use current stable Terraform with the AzureRM provider, ARM templates, and Bicep behavior available in 2026 because no repository-pinned versions were supplied.

Start with the practical decision: all three can deliver the desired Azure state, so I would choose based on platform scope, authoring experience, state ownership, governance, and team skills.

Terraform

Terraform uses declarative HCL and the AzureRM provider to manage Azure resources. Its provider model also supports many other clouds and services, which makes it useful for multi-cloud, hybrid, or mixed SaaS environments.

Terraform keeps state, locally or preferably in a protected remote backend. State records which real objects Terraform manages and is used with refreshed provider data to calculate proposed changes and detect drift. Because sensitive values can appear in state even when values are marked sensitive, the state backend needs access control, encryption, backup, and locking where the backend supports it.

Before deployment, terraform plan shows proposed create, update, and delete actions. The plan is a preview, not a guarantee: infrastructure can change after the plan, provider behavior can differ during apply, or an API operation can fail.

Terraform normally builds dependencies from references between resources, and explicit depends_on is available when a dependency cannot be inferred. Reusable modules can come from local code, Git repositories, or registries. For recovery, Terraform does not provide universal automatic rollback. Teams normally use version-controlled configuration, protected state, a reviewed new plan, and a corrective or forward-fix apply.

Terraform is a strong fit when the organization needs resources outside Azure, values its provider and module ecosystem, and is comfortable operating Terraform state safely.

ARM templates

ARM templates are declarative JSON processed through Azure Resource Manager. Their resource coverage follows Azure Resource Manager resource types and supported API versions. They are Azure-only rather than a general multi-cloud abstraction.

ARM deployments do not use a Terraform-style state file. Azure records deployment history, while the deployed Azure resources remain the current platform state. what-if can preview expected changes before deployment, but like Terraform plan it is not a guarantee of the final result.

ARM templates support explicit dependsOn. Some reference() or list* expressions that reference another resource can create implicit dependencies; simply constructing a resource ID is not the same as creating a dependency.

Reuse is available through nested or linked templates and template specs. Azure Policy assignments can be managed through ARM, but policy enforcement is an Azure platform capability rather than something unique to ARM templates. Secrets should use secure mechanisms such as Key Vault references and secure parameters instead of being committed to source control.

ARM deployment does not provide universal automatic rollback. Recovery normally means redeploying a known-good template or performing a corrective deployment. ARM is a good fit for Azure-native teams with an existing ARM JSON investment or requirements to work directly with native Azure deployment tooling such as Azure CLI, PowerShell, REST APIs, the Azure portal, and CI/CD.

Bicep

Bicep is declarative and Azure-native, but its syntax is shorter and easier to read than raw ARM JSON. Bicep compiles to ARM JSON and therefore uses the Azure Resource Manager deployment model rather than introducing a separate control plane.

Like ARM templates, Bicep has no Terraform-style state file. Azure keeps deployment history. Bicep uses the same what-if capability for previewing changes.

Bicep symbolic references usually let the compiler infer resource dependencies. Explicit dependsOn can still be used when a real dependency cannot be inferred. Bicep modules provide reusable components with parameters and outputs and can come from local files, template specs, or registries.

Secret handling should use Key Vault references, secure parameters, managed identities, or equivalent Azure controls rather than embedding secrets in source. Recovery is normally a known-good redeployment or corrective deployment, not automatic rollback.

Bicep is a strong fit for Azure-only teams that want native Azure behavior with more concise authoring, reusable modules, Bicep CLI or Azure CLI integration, the VS Code extension, and CI/CD through systems such as Azure DevOps or GitHub Actions.

Policy and governance

Azure Policy is enforced by Azure at the platform boundary regardless of whether Terraform, ARM templates, or Bicep created the resource. Policy assignments themselves can be managed through any of the three approaches. A mature delivery workflow should preview the change, perform policy and security checks, obtain review, and only then apply or deploy with least-privilege credentials.

The decision

I would choose Terraform when multi-cloud or third-party provider support and its module ecosystem matter. I would choose ARM templates when a team already has strong ARM JSON investment or needs direct native template authoring. I would choose Bicep for an Azure-only environment when the team wants the ARM deployment model with cleaner, more maintainable syntax. None is universally superior.

Technical Approach
  1. Define the desired Azure resource set so the comparison uses the same target infrastructure.
  2. Check platform scope: Azure-only versus Azure plus other clouds or services.
  3. Compare authoring languages: HCL for Terraform, JSON for ARM templates, and Bicep for concise Azure-native authoring.
  4. Decide whether the team can safely operate Terraform state or prefers Azure deployment history without a Terraform-style state file.
  5. Compare previews: Terraform plan versus ARM/Bicep what-if, treating both as previews rather than guarantees.
  6. Compare dependency expression and reusable modules.
  7. Review Azure Policy integration, secret handling, least-privilege deployment credentials, and CI/CD tooling.
  8. Define recovery as a reviewed corrective or known-good deployment instead of assuming automatic rollback.
  9. Select the tool whose platform scope, operational model, ecosystem, and team skills best match the workload.
Practical Insights

There is no algorithmic Big-O cost here. The important costs are operational and maintenance costs. Terraform adds the responsibility of securely storing, locking, backing up, and controlling access to state, but it gives one provider-based workflow across many platforms. ARM templates avoid a Terraform-style state backend but raw JSON can become verbose and harder to maintain. Bicep keeps the Azure-native deployment model while reducing authoring complexity. All three add CI/CD validation, preview, review, policy, testing, and recovery work, and large deployments can take longer because cloud APIs must create, update, or delete real resources.

Why Interviewers Ask This

Interviewers want to see whether you understand that choosing an infrastructure-as-code tool is not only a syntax decision. You should distinguish language and authoring experience from Azure platform behavior, explain Terraform state versus Azure deployment history, compare preview and dependency behavior, understand modules, secrets and policy, and choose a tool based on workload scope and team constraints rather than declaring one tool universally best.

Common interview mistakes

A common mistake is saying Terraform is always better because it supports multiple clouds, or saying Bicep is always better because it is newer and easier to read. Another is claiming ARM or Bicep has Terraform-style persistent state; they use Azure deployment history instead. Do not claim that constructing a resource ID alone creates an ARM dependency. Do not assume Terraform plan or Azure what-if guarantees what deployment will do. Do not describe ARM/Bicep deployment as automatic rollback. Do not store secrets directly in source or assume marking a Terraform value sensitive prevents it from existing in state. Finally, do not treat Azure Policy as exclusive to one IaC tool; Azure enforces it at the platform boundary.

Interview tip

Start by saying all three can reach the same Azure desired state. Then compare them in a consistent order: language, coverage, state/history, preview, dependencies, reuse, governance, secrets, recovery, tooling, and non-Azure support. Finish with workload-based choices instead of naming a universal winner.

Interviewer may ask next
Why does Terraform need a state file when ARM templates and Bicep do not use a Terraform-style state file?

Terraform maintains its own mapping between configuration addresses and real infrastructure objects. That state helps Terraform calculate changes, track managed objects, refresh provider data, and detect drift. ARM templates and Bicep submit desired deployments to Azure Resource Manager, so Azure owns the resource model and records deployment history instead of Terraform-style state. Terraform state therefore needs strong protection, remote storage where appropriate, access control, backup, and locking support.

What should a team do if a Terraform apply or ARM/Bicep deployment fails halfway through?

Do not assume automatic rollback. First inspect which operations succeeded and which failed. For Terraform, refresh and review the current state and real resources, correct the configuration or underlying problem, and create a new reviewed plan before applying again. For ARM or Bicep, inspect the Azure deployment result and current resources, then redeploy a known-good version or perform a corrective deployment. In both cases, keep configuration in version control, protect secrets and state, use least-privilege credentials, and prefer a controlled forward fix over unreviewed manual changes.

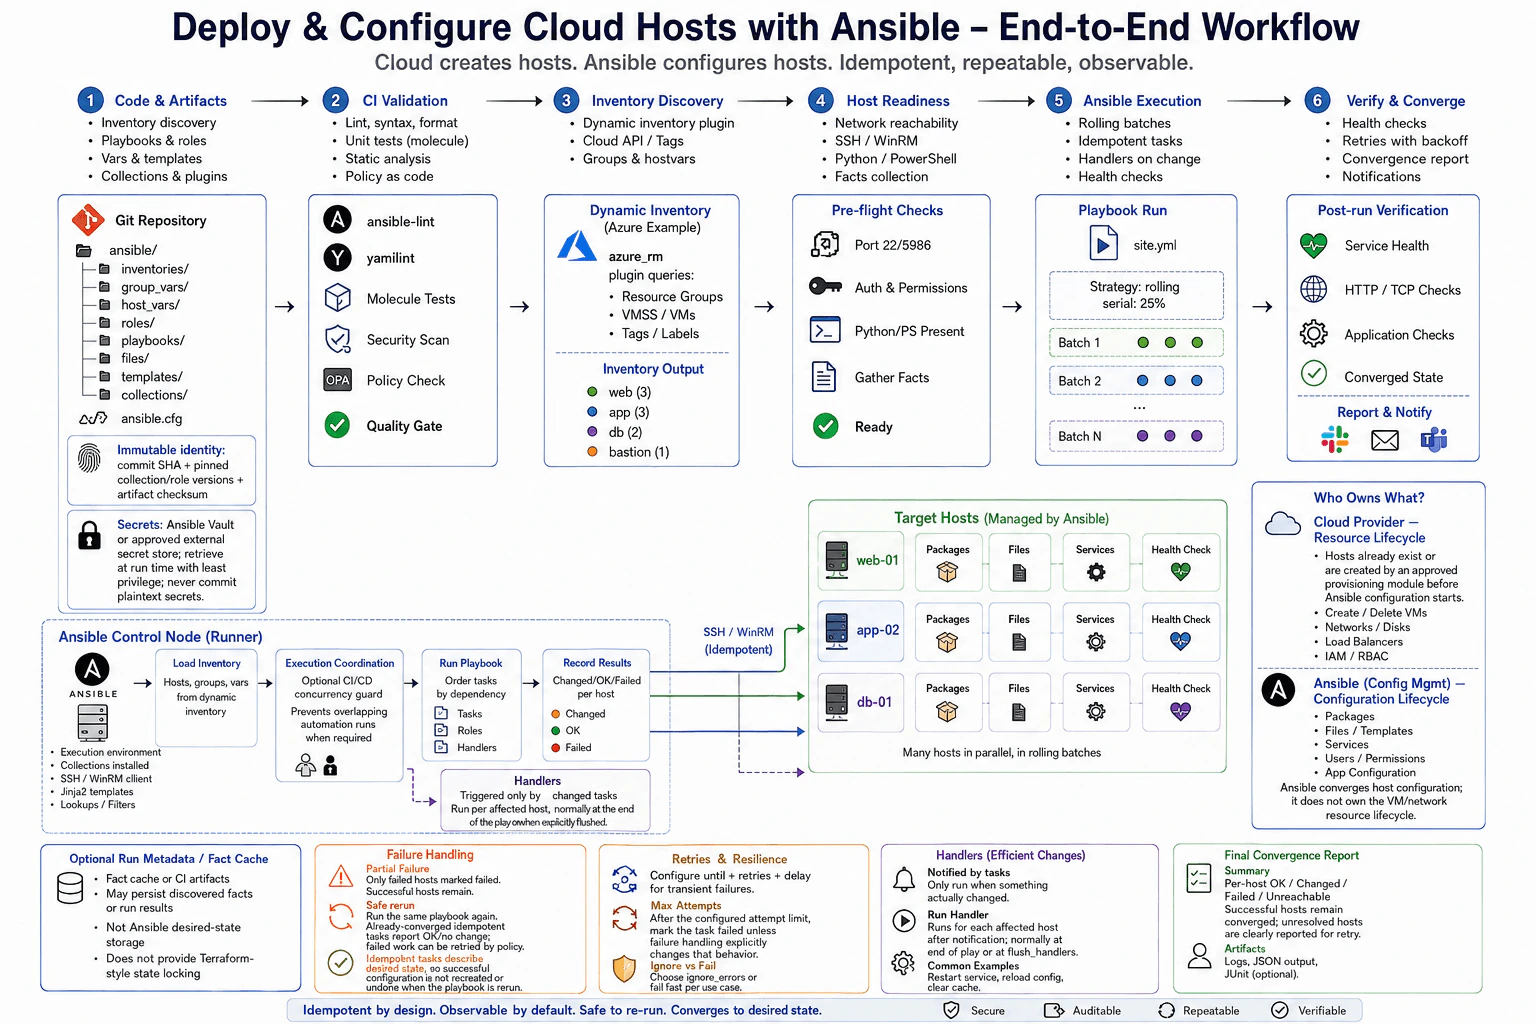
8. How would you deploy and configure cloud hosts through Ansible?Infrastructure As CodeMediumMicrosoft

Question Details

Describe a repeatable deployment workflow in which cloud instances already exist or are provisioned through an approved module, then configured with Ansible. Cover inventory discovery, host readiness, immutable artifact identity, packages, files, services, secrets, rolling batches, health checks, retries, partial failure, handlers, and final convergence reporting. Define which resource lifecycle belongs to the cloud provider versus configuration management and how a failed run resumes without duplicating or undoing successful work.

Short Interview Answer (30-60 seconds)

I would let the cloud platform or approved module create the hosts, then use Ansible for configuration. I would use dynamic inventory, readiness checks, pinned artifacts, idempotent tasks, rolling batches, secure secrets, handlers, health checks, explicit retries, and per-host convergence reporting so failed runs can be safely repeated.

Detailed Explanation

See the Code while reading this explanation.

This question asks how you would take a group of cloud computers and set them up the same way every time. It wants a process that is safe, repeatable, and easy to run again after something goes wrong. You need to explain how you find the right machines, check that they are ready, install what they need, place the correct files, start the right programs, protect private values, test each group, and report the final result. It also asks who creates the machines and who manages what is inside them afterward.

Useful Questions to Ask the Interviewer
  1. Are the hosts already created, or does an approved provisioning pipeline create them before Ansible starts?
  2. Which cloud inventory source and grouping rules should Ansible use?
  3. Are the target hosts Linux, Windows, or both, and should connectivity use SSH, WinRM, or both?
  4. Which health checks define a successful deployment: service state, TCP, HTTP, or application-level checks?
  5. Where should secrets come from: Ansible Vault, an approved external secret store, or both?
  6. What rolling-batch size and failure policy should the deployment use?
How would you deploy and configure cloud hosts through Ansible? diagram
How to Explain It in an Interview

I would start with the ownership boundary.

The cloud provider or an approved provisioning module owns resource lifecycle. It creates, updates, or removes VMs, networks, disks, load balancers, and IAM or RBAC resources. Ansible starts after those hosts exist. Ansible owns host configuration such as packages, files, templates, services, users, permissions, and application settings. This prevents two tools from competing for the same lifecycle.

For the tooling assumption, I would use repository-pinned versions of a currently supported 2026 ansible-core release and every required collection or role. The diagram uses Azure dynamic inventory as the concrete example, so I would also pin the azure.azcollection collection in the repository. I would not invent a version number when the repository has not supplied one.

  1. Repository and immutable identity

I would store playbooks, roles, variables, templates, inventory configuration, collection requirements, and ansible.cfg in Git. CI would identify every deployment with an immutable Git commit SHA, pinned collection and role versions, and an artifact checksum. A rerun therefore uses the same automation and the same application artifact rather than silently picking up a newer build.

  1. Validate before execution

Before touching hosts, CI should run syntax and lint checks such as ansible-lint and yamllint, automated role or Molecule tests where appropriate, security scanning, and required policy checks. A failed quality gate stops the deployment before configuration begins.

  1. Discover the hosts

I prefer dynamic inventory so Ansible asks the cloud inventory source for the current machines instead of depending on a manually maintained host list. In the diagram, the Azure azure_rm inventory plugin discovers VMs and groups them using cloud information such as resource groups and tags. The result is logical groups such as web, app, and db.

  1. Verify host readiness

Before configuration, I check that each target is reachable over SSH or WinRM, that authentication and permissions work, and that the required Python or PowerShell environment is present. I then gather facts. Readiness must happen before normal configuration tasks so an unavailable host fails early rather than halfway through a change.

  1. Coordinate the run

Ansible itself does not provide Terraform-style state locking. If overlapping automation runs would be dangerous, I would use a CI/CD concurrency guard or another external orchestration control to prevent simultaneous runs against the same environment.

  1. Apply idempotent configuration

The playbook should describe the desired end state. Package tasks ensure required software is present. File and template tasks place the expected configuration. Service tasks ensure services are enabled and running. Idempotent means that running the same task again does not create another copy or undo correct work when the machine already matches the desired state.

  1. Retrieve secrets safely

Secrets should come from Ansible Vault or an approved external secret store at run time with least-privilege access. I would not commit plaintext secrets to Git, place them in command-line arguments, print them to logs, or expose them in reports.

  1. Deploy in rolling batches

I would use serial execution, for example 25 percent at a time when that matches the agreed rollout policy. Only one batch is changed and verified before the run proceeds through the remaining hosts. Smaller batches reduce blast radius, while larger batches finish faster.

  1. Use handlers correctly

Tasks notify handlers only when they actually change something. For example, changing an application file or service configuration can notify a restart handler. Handlers execute for each affected host, normally at the end of the play. If a health check must test the newly restarted service before continuing, I can explicitly flush handlers before that check.

  1. Verify health with explicit retries

After configuration, I would check service state and, where appropriate, TCP, HTTP, or application-level health. Transient startup failures can use Ansible's until, retries, and delay controls. Retries are explicitly configured task behavior; Ansible should not be described as automatically retrying every failure.

  1. Handle partial failure

A host that fails should be reported as Failed or Unreachable while successful hosts keep the configuration they already received. I would diagnose and correct the failure rather than automatically undoing healthy machines. After the cause is fixed, I can rerun the same playbook. Idempotent tasks on already-converged hosts normally report OK with no change, while unresolved hosts execute the work they still need.

If operational policy requires it, I can narrow a retry to affected hosts. Options such as --limit can restrict hosts, while start-at-task can be used carefully when the task ordering and dependencies make that safe. My default recovery method is still a normal idempotent rerun because it re-evaluates the desired state from the beginning.

  1. Report final convergence

The final report should show per-host OK, Changed, Failed, and Unreachable results, together with useful CI artifacts, logs, and notifications. Successful hosts remain converged, and unresolved hosts are clearly visible for follow-up.

Ansible may optionally use a fact cache or CI artifacts to retain discovered facts or run information. That is not a Terraform-style desired-state backend and does not provide Terraform-style state locking.

The main tradeoff is speed versus safety. Large batches complete faster but increase blast radius. Small batches take longer but make failures easier to contain and investigate. I would choose the batch size based on service availability requirements and make the workflow observable, auditable, repeatable, and safe to rerun.

Technical Approach
  1. Keep Ansible playbooks, roles, variables, templates, inventory configuration, and dependency definitions in Git.
  2. Pin the deployment to a Git commit, collection and role versions, and an immutable artifact checksum.
  3. Run linting, syntax checks, tests, security scans, and required policy checks in CI.
  4. Discover existing hosts through dynamic inventory and build logical host groups.
  5. Verify connectivity, authentication, privileges, interpreter availability, and facts before configuration.
  6. Use an external CI/CD concurrency guard when overlapping runs must be prevented.
  7. Retrieve secrets securely at run time with least-privilege access.
  8. Execute idempotent package, file, template, service, user, permission, and application-configuration tasks.
  9. Process hosts in rolling batches with serial.
  10. Notify handlers only when configuration actually changes.
  11. Flush handlers before health verification when the check must observe a newly restarted service.
  12. Run service, TCP, HTTP, or application health checks with explicitly configured retries for transient failures.
  13. Preserve successful configuration after partial failure and safely rerun the playbook after correcting the cause.
  14. Publish per-host OK, Changed, Failed, and Unreachable results with logs and notifications.
Practical Insights

The amount of work grows mainly with the number of hosts and the number of tasks run on each host. Inventory discovery and fact gathering add network calls. Rolling batches increase total deployment time because only part of the fleet changes at once, but they reduce operational risk. Health-check retries can also lengthen a run when services start slowly. Memory use on the control node is usually less important than network connections, task count, fork settings, and remote execution time. Maintenance becomes easier when roles are reusable, versions and artifacts are pinned, secrets stay outside source control, and tasks remain idempotent.

Code
ANSIBLE_PLAYBOOK = r"""
# playbooks/site.yml
# The cloud resource lifecycle is outside this playbook.
# These hosts already exist and are selected from dynamic inventory.
- name: Configure discovered application hosts
  hosts: "web:app:db"
  gather_facts: false
  become: true
  serial: "25%"

  # Secrets are stored encrypted with Ansible Vault.
  # An approved external secret lookup can replace this when required.
  vars_files:
    - ../vars/vault.yml

  vars:
    # CI supplies non-secret immutable artifact identity values.
    # The playbook never chooses a newer build automatically on a rerun.
    artifact_version: "{{ lookup('ansible.builtin.env', 'ARTIFACT_VERSION') }}"
    artifact_url: "{{ lookup('ansible.builtin.env', 'ARTIFACT_URL') }}"
    artifact_checksum: "{{ lookup('ansible.builtin.env', 'ARTIFACT_SHA256') }}"
    release_dir: "/opt/myapp/releases/{{ artifact_version }}"

  pre_tasks:
    # Wait for SSH connectivity before any normal host inspection or configuration.
    - name: Wait for the host to become reachable
      ansible.builtin.wait_for_connection:
        timeout: 300

    # Gather facts only after the readiness check succeeds.
    - name: Gather host facts
      ansible.builtin.setup:

    # Fail safely when CI did not provide an immutable artifact identity.
    - name: Validate immutable artifact inputs
      ansible.builtin.assert:
        that:
          - artifact_version | length > 0
          - artifact_url | length > 0
          - artifact_checksum is match('^sha256:[0-9a-fA-F]{64}$')
        fail_msg: "CI must supply an artifact version, URL, and SHA-256 checksum."

  tasks:
    # Package state is declarative: reruns do nothing when the package is already present.
    - name: Install required operating-system package
      ansible.builtin.package:
        name: curl
        state: present

    # Create a release path based on immutable artifact identity.
    - name: Create the application release directory
      ansible.builtin.file:
        path: "{{ release_dir }}"
        state: directory
        owner: root
        group: root
        mode: "0755"

    # Verify the artifact checksum during download so the selected build cannot silently change.
    - name: Download the immutable application artifact
      ansible.builtin.get_url:
        url: "{{ artifact_url }}"
        dest: "{{ release_dir }}/myapp.tar.gz"
        checksum: "{{ artifact_checksum }}"
        mode: "0644"
      notify: Restart myapp

    # Expand the selected artifact into its version-specific release directory.
    - name: Extract the application artifact
      ansible.builtin.unarchive:
        src: "{{ release_dir }}/myapp.tar.gz"
        dest: "{{ release_dir }}"
        remote_src: true
      notify: Restart myapp

    # Render application settings from source-controlled configuration.
    # no_log prevents secret-bearing values from appearing in task output.
    - name: Render application configuration
      ansible.builtin.template:
        src: ../templates/myapp.conf.j2
        dest: /etc/myapp/myapp.conf
        owner: root
        group: root
        mode: "0640"
      no_log: true
      notify: Restart myapp

    # Manage the service definition as configuration rather than relying on a manual change.
    - name: Install the systemd service definition
      ansible.builtin.template:
        src: ../templates/myapp.service.j2
        dest: /etc/systemd/system/myapp.service
        owner: root
        group: root
        mode: "0644"
      notify:
        - Reload systemd
        - Restart myapp

    # Run notified handlers now because the following health check must observe the new service state.
    - name: Apply notified service changes before verification
      ansible.builtin.meta: flush_handlers

    # Keep the service enabled and running after handlers complete.
    - name: Ensure the application service is enabled and started
      ansible.builtin.systemd_service:
        name: myapp
        state: started
        enabled: true

    # Retry only this transient health check; retries are explicit Ansible task behavior.
    - name: Verify application health
      ansible.builtin.uri:
        url: http://127.0.0.1:8080/health
        status_code: 200
      register: myapp_health
      until: myapp_health.status == 200
      retries: 5
      delay: 10

  handlers:
    # Reload systemd only on hosts whose service-unit file changed.
    - name: Reload systemd
      ansible.builtin.systemd_service:
        daemon_reload: true

    # Restart only on affected hosts when a notifying task changed something.
    - name: Restart myapp
      ansible.builtin.systemd_service:
        name: myapp
        state: restarted
        enabled: true
"""
Why Interviewers Ask This

Interviewers want to see whether you can design a safe and repeatable Ansible deployment workflow, separate infrastructure provisioning from host configuration, use inventory and idempotence correctly, protect secrets, limit deployment blast radius, verify health, handle partial failures, and explain why a failed run can be resumed without duplicating successful work.

Common interview mistakes

Common mistakes are letting Ansible create and delete cloud infrastructure when provisioning is supposed to belong to the cloud provider or approved module; using stale inventory instead of reliable discovery; failing to pin the automation and application artifact; storing plaintext secrets in source or logs; gathering facts before confirming that a host is reachable; running every host at once; using non-idempotent shell commands for normal configuration; assuming handlers run globally once; checking health before a required handler restart has occurred; assuming Ansible automatically retries failures; treating fact caching as Terraform-style state; and undoing healthy hosts after a partial failure instead of fixing the cause and converging again.

Interview tip

Present the answer in one clear flow: define the lifecycle boundary, discover hosts, verify readiness, apply pinned idempotent configuration in rolling batches, handle secrets and handlers safely, verify health with explicit retries, then explain partial-failure recovery and final convergence reporting. Emphasize that Ansible does not use Terraform-style desired-state locking.

Interviewer may ask next
How would you resume the deployment if some hosts failed while the rest succeeded?

I would keep the successful hosts as they are, identify why the failed or unreachable hosts did not converge, and correct that cause first. Then I would normally rerun the same playbook. Because the tasks are idempotent, already-converged hosts should report OK with no unnecessary change, while unresolved hosts receive the work they still need. If necessary, I can narrow the retry with --limit. I would use start-at-task only when I am certain that skipping earlier dependency checks is safe.

Why would you use rolling batches instead of configuring every host at the same time?

Rolling batches reduce blast radius. With serial execution, only part of the fleet changes at one time, so a bad package, configuration file, service restart, or health failure affects fewer machines before it is detected. The tradeoff is deployment speed: smaller batches are safer but take longer. I would choose the batch size from the service availability requirement and stop or investigate when the agreed failure policy is reached.

9. How would you manage infrastructure as code while enforcing security and compliance?Infrastructure As CodeHardMicrosoft

Question Details

Design a delivery control plane for infrastructure changes across multiple environments. Cover versioned modules, approved providers and versions, short-lived deployment identity, least privilege, protected state, secret references, static checks, plan-time policy, security scanning, saved-plan review, approvals, separation of duties, immutable logs, controlled exceptions, drift evidence, and emergency changes. Explain how the system applies exactly the reviewed change and how it recovers when an apply partially succeeds.

Short Interview Answer (30-60 seconds)

I use one controlled pipeline: pinned code and providers, static checks, security scans, plan-time policy, an immutable environment-specific saved plan, independent approval, and short-lived least-privilege deployment identity. CD applies exactly that reviewed plan. State, secrets, logs, exceptions, drift, emergency access, and partial-failure recovery are separately protected and audited.

Detailed Explanation

The goal is to make changes to company systems safe, repeatable, and easy to prove later. People should not be able to change important systems whenever they want. Every proposed change should be checked automatically, reviewed by the right people, and recorded before it is allowed to happen. Sensitive information should stay protected, and development, testing, and production should be handled separately. The company should also be able to spot unexpected changes, control urgent work, show who approved each action, and recover safely when only part of a planned change completes.

Useful Questions to Ask the Interviewer
  1. Which environments require human approval, and must production approvers be different from the change author?
  2. Which repository and CI/CD platform are approved?
  3. Which Terraform and AzureRM provider versions are approved, and how are those versions pinned?
  4. Which policy engine and IaC security scanners are required?
  5. Which remote-state backend, locking, encryption, versioning, and recovery controls are approved?
  6. What retention or immutability requirements apply to saved plans, approvals, logs, and exception evidence?
  7. What process is required for policy exceptions and emergency production changes?
How would you manage infrastructure as code while enforcing security and compliance? diagram
How to Explain It in an Interview

I would design one delivery control plane and make it the only normal path for infrastructure changes.

1. Keep configuration versioned and reproducible

The repository is the source of truth. I would use small reusable modules with explicit inputs and outputs. Consumed modules are pinned to an approved version or commit. Terraform uses an approved pinned version, and the AzureRM provider is pinned through the committed provider lock file. This prevents an unexpected tool or provider upgrade from silently changing behavior.

I would keep separate configuration boundaries for Dev, Test, and Prod. They can reuse the same reviewed module code, but each environment has its own state, deployment identity, saved plan, and approval boundary. A saved plan created for Dev is not promoted unchanged into Test or Prod.

2. Validate before creating an approved change

A pull request starts CI. CI checks formatting and configuration validity, runs infrastructure tests where useful, performs linting and static checks, and runs IaC security scanners such as Checkov, tfsec, or Trivy.

The pipeline then refreshes its view of the target environment and creates a saved plan specifically for that environment. A Terraform plan is a preview based on the configuration, stored state, and remote objects observed at planning time. It is not a guarantee that apply will succeed because permissions, quotas, provider behavior, remote objects, or other cloud conditions can change afterward.

3. Enforce policy at plan time

The generated plan is evaluated with policy as code, for example OPA or Sentinel. Typical guardrails include least privilege, required tags, encryption, approved locations, and organization-specific standards. Policy denies a violating change unless an explicitly permitted and approved exception applies.

A controlled exception is not a deployment bypass. It has an exception ID and justification, a named owner and approver, a defined scope and expiry, compensating controls, and automatic expiry or re-review. The exception request feeds the policy decision, and the final exception decision and expiry evidence are recorded in the immutable evidence store. Normal review, approval, and deployment controls still apply.

4. Save exactly what reviewers inspect

CI stores the binary saved plan, a readable or JSON plan representation, check and scan reports, and metadata such as the commit and pipeline run identity in protected, versioned artifact storage. The artifact must not be silently replaced after review.

Reviewers inspect that exact saved plan rather than approving a vague future deployment. Production uses separation of duties: the change author cannot self-approve the production change. Required architecture, security, or operational reviewers approve the specific saved-plan artifact.

5. Apply exactly the reviewed plan

After approval, CD does not create a replacement plan. It obtains a short-lived deployment identity, downloads the approved plan and metadata, verifies artifact integrity, and re-checks applicable policy against the reviewed plan without generating a different plan. It then runs terraform apply plan.tfplan.

That command tells Terraform to execute the actions stored in the reviewed saved plan instead of silently re-planning at deployment time. The plan still does not guarantee success: Terraform or the provider can reject the apply if the saved plan is stale or if cloud conditions changed after planning.

Each environment follows this process independently. Dev, Test, and Prod each receive their own saved plan created against that environment's state and each plan follows the required approval path.

6. Use short-lived deployment identity and least privilege

The pipeline obtains short-lived credentials through OIDC workload identity federation, such as an Azure Entra ID workload identity. I would avoid long-lived cloud secrets in CI.

Permissions are scoped to the target environment and limited to the operations the deployment requires. The change author does not automatically receive deployment rights, and the deployment identity does not receive broad administrator access merely for convenience.

7. Protect state and secret references

Remote Terraform state is stored in a protected Azure Storage backend. I would require encryption, private access, recoverable history such as versioning or soft delete, and tightly restricted permissions. The AzureRM backend uses a Blob Lease for state locking so two Terraform writers do not modify the same state concurrently.

The normal run releases its lock when it exits. A force-unlock action is used only after verifying that no active writer still owns the state, because forcibly removing a legitimate lock can allow concurrent modification.

Secrets are referenced from a secret-management system such as Azure Key Vault rather than placed directly in source code. I would avoid exposing secret values in logs, command lines, normal outputs, or examples, and I would design modules so sensitive values are not unnecessarily persisted into Terraform state.

8. Make audit evidence tamper-resistant

The audit trail records pipeline history, approval history, plan and apply results, state-change history, exception decisions, and emergency-change activity. Important evidence is written to an immutable or append-only evidence store with WORM-style retention where required and restricted deletion.

This gives the organization a durable record of who proposed the change, who approved it, which artifact was approved, what was applied, and what exception or emergency authority was used.

9. Detect drift continuously

A scheduled drift job runs against the approved configuration for an environment using non-mutating refresh and plan operations such as terraform plan -detailed-exitcode. When that approved configuration has not changed, a non-empty plan is evidence that observed infrastructure no longer matches the declared configuration.

The system alerts on the difference and saves the plan or equivalent evidence for review. I would not automatically overwrite every difference because it may represent an emergency action, a temporary approved exception, provider behavior, or another change that must first be reconciled in code.

10. Control emergency changes

For a real emergency, I would provide a restricted break-glass process with time-bound access, required justification, recorded and reviewed activity, post-change validation, and mandatory follow-up work to codify the final infrastructure state in the repository.

Emergency access is exceptional and auditable. It must not become an undocumented second deployment pipeline.

11. Recover safely after partial apply

Terraform can partially succeed. Some provider operations may complete before another operation fails, and Terraform may already have persisted state for completed work.

I would stop the failed run and preserve the state already written. The run should release its lock normally when it exits. I would investigate the failure and verify there is no active writer before considering any force-unlock operation.

Next, I refresh the affected environment and reconcile the stored state with the remote objects that now exist. I do not blindly reuse the old saved plan because the environment may have changed during the partial apply.

I create a new saved plan from the refreshed state and run validation, security scanning, policy checks, review, and approval again. Only that newly reviewed plan is applied. This is normally a controlled forward-fix rather than a blind rollback because infrastructure operations are not transactionally reversible and an automatic rollback can itself be destructive.

Assumptions and tradeoffs

I am assuming Terraform with an approved pinned version, an approved AzureRM provider pinned in the committed lock file, Azure Storage for protected remote state with Blob Lease locking, Azure workloads separated by management groups or subscriptions, OPA or Sentinel for policy, IaC scanners such as Checkov, tfsec, or Trivy, Azure Key Vault for secret references, and a CI/CD platform using OIDC federation.

The main tradeoff is delivery speed versus control. Static checks, scans, policy evaluation, immutable artifact storage, approvals, separation of duties, and evidence retention add pipeline time and maintenance work. For production infrastructure, that cost is usually justified because it provides reproducibility, least privilege, review integrity, auditability, controlled exceptions, drift evidence, and safer failure recovery.

Technical Approach
  1. Store reusable IaC modules and environment configuration in version control; pin consumed modules, Terraform, and provider versions.
  2. Require pull requests, branch protection, code ownership, and review.
  3. Run formatting, validation, tests, linting, static checks, and IaC security scans.
  4. Refresh the target environment and create a saved plan specifically for that environment.
  5. Evaluate the saved plan with policy as code; route any permitted exception through a scoped, approved, expiring exception process that feeds the policy decision rather than bypassing it.
  6. Store the saved plan, readable plan data, reports, and commit/run metadata in protected versioned artifact storage.
  7. Require human review and separation of duties, especially for production.
  8. After approval, obtain short-lived OIDC identity, download and verify the same approved artifact, re-check applicable policy without re-planning, and apply the exact saved plan.
  9. Persist protected state and write pipeline, approval, apply, exception, and state-change evidence to an immutable evidence store.
  10. Detect drift with scheduled non-mutating refresh and plan operations against the approved configuration.
  11. Use restricted, time-bound break-glass access for emergencies and require post-event reconciliation to code.
  12. After partial apply, preserve recorded state, refresh reality, create a new plan, repeat checks and approval, and forward-fix with the newly reviewed plan.
Practical Insights

There is no useful Big-O complexity for this architecture. The important costs are operational. Every environment needs separate state, plans, identities, approvals, and evidence. Static checks and security scans add CI time. Refresh and planning time grow with the amount of managed infrastructure and depend on provider API latency. Versioned plans and immutable evidence consume storage. Policy rules, module versions, exception records, access roles, and break-glass controls require maintenance. These controls make delivery somewhat slower, but they reduce the risk of unauthorized, unreviewed, conflicting, unreproducible, or untraceable infrastructure changes.

Why Interviewers Ask This

This question tests whether the candidate can design infrastructure delivery as a security and compliance control plane instead of treating Terraform as only a provisioning tool. The interviewer is looking for judgment around reusable and versioned modules, provider pinning, protected state, short-lived identity, least privilege, secret handling, static validation, security scanning, plan-time policy, exact saved-plan approval, separation of duties, immutable evidence, controlled exceptions, drift detection, emergency access, multi-environment isolation, and safe recovery after a partial apply.

Common interview mistakes

Common mistakes are applying directly from a developer laptop; using long-lived CI credentials; granting broad administrator permissions to the deployment identity; allowing production authors to approve their own changes; creating a new terraform plan after approval and applying an unreviewed result; using one saved plan for Dev, Test, and Prod; storing secrets in source, logs, outputs, or command lines; weakly protecting remote state; ignoring locking and concurrent writers; assuming a saved plan guarantees successful apply; letting exceptions bypass the normal policy and approval path; creating permanent or unaudited exceptions; claiming logs are immutable without protected retention and restricted deletion; automatically overwriting every detected drift; using force-unlock without proving the writer is gone; reusing the old plan after a partial apply; assuming infrastructure changes can always be rolled back transactionally; and allowing emergency changes without time limits, evidence, validation, and follow-up reconciliation.

Interview tip

Lead with the control-plane flow: propose, validate, scan, plan, enforce policy, store the exact plan, independently approve it, and apply that same artifact using short-lived identity. Then explain protected state and secrets, immutable evidence, controlled exceptions, drift and break-glass handling, and partial-failure recovery. Explicitly say that a saved plan preserves review integrity but does not guarantee successful apply.

Interviewer may ask next
How do you guarantee that production applies exactly what reviewers approved?

Create the production plan once in CI against production's own observed state, store the binary saved plan and its evidence in protected versioned artifact storage, and make the approval reference that exact artifact. After approval, CD obtains short-lived identity, downloads and verifies the same artifact, re-checks applicable policy without creating a different plan, and runs terraform apply plan.tfplan. Do not create a new plan between approval and apply. This guarantees that Terraform attempts the reviewed saved actions, although stale state, provider behavior, permissions, quotas, or other cloud changes can still make the apply fail.

What would you do if Terraform creates several resources and then the apply fails halfway through?

Treat it as a partial success, not as a transaction that can simply be rolled back. Preserve the state Terraform already wrote for completed operations, let the failed run exit and release its lock normally, and investigate the failure before considering force-unlock. Refresh the affected environment and reconcile the real remote objects with stored state. Then create a new saved plan from that refreshed state, repeat validation, security scanning, policy checks, review, and approval, and apply only the newly reviewed plan. Prefer a controlled forward-fix because some infrastructure operations cannot be safely or automatically reversed.

10. Which Kubernetes signals would you monitor with Prometheus?ObservabilityEasyMicrosoft

Question Details

Define a minimal but useful Prometheus signal set for a Kubernetes-hosted service. Separate control-plane or managed-cluster signals, node capacity and pressure, Pod scheduling and restarts, container CPU and memory behavior, Service endpoint availability, application request success and latency, and telemetry-pipeline freshness. For each group, state what the signal can establish and what it cannot, the labels needed for ownership and version correlation, and how you would avoid treating an absent series as a healthy zero.

Short Interview Answer (30-60 seconds)

I monitor control-plane health, node pressure, Pod scheduling and restarts, container resources, Service endpoints, application request success and latency, and telemetry freshness. I correlate them with owner and version labels, define service objectives first, and treat missing expected metrics as unknown rather than zero.

Detailed Explanation

This question asks how I would watch a service running on a shared computing system without collecting everything. I would choose a small set of measurements that tells me whether the service is working, whether the machines have enough capacity, whether the running units are stable, whether requests are succeeding quickly, and whether the monitoring system itself is still reporting fresh information. I would also keep clear ownership and release information with those measurements. Most importantly, I would treat missing information as unknown, not as proof that everything is healthy.

Useful Questions to Ask the Interviewer
  1. Is the Kubernetes control plane managed by a cloud provider, and which control-plane signals are exposed?
  2. Which application success and latency objectives matter most for this service?
  3. Which labels identify the owning team, workload, and deployed version or revision?
  4. Which Prometheus targets and application series are expected to exist continuously?
Which Kubernetes signals would you monitor with Prometheus? diagram
How to Explain It in an Interview

I would start from the user-visible objective. For the application, I would define meaningful service-level indicators, or SLIs, such as request success and request latency, and then define service-level objectives, or SLOs, before choosing alert thresholds. Infrastructure alerts should help explain symptoms, while application success and latency should tell me whether service behavior is degrading.

My minimal signal set has seven groups.

  1. Control plane or managed cluster: monitor API server availability and request latency. Scheduler, controller-manager, and etcd metrics are useful only when the platform exposes them; otherwise I would use the managed-cluster provider's control-plane signals. These signals can establish control-plane reachability and health, but they cannot prove that workloads or applications are healthy. Useful labels include cluster, component, and instance, with provider or region when useful.
  1. Node capacity and pressure: monitor readiness and pressure conditions, allocatable versus used CPU and memory, disk and inode pressure, and CPU or memory saturation. These signals show whether a node has capacity or pressure, but they do not identify which application caused the pressure. Useful labels are cluster, node, instance, region, and zone.
  1. Pod scheduling and restarts: monitor Pending or unschedulable Pods, Pod readiness and phase, and increases in container restarts or crash loops. These signals establish scheduling success and workload stability. They do not prove application correctness, request latency, or dependency health. Useful labels include cluster, namespace, workload or deployment, pod, owner or team, and version or revision.
  1. Container CPU and memory: monitor CPU usage against requests or limits, CPU throttling, memory working set against limits, and OOM kills or restarts. These signals show resource usage and limit pressure. They cannot by themselves prove request success, latency, correctness, or root cause. Useful labels include cluster, namespace, workload or deployment, pod, container, owner or team, and version or revision.
  1. Service endpoint availability: monitor ready endpoints behind the Service, zero-ready-endpoint conditions, and endpoint changes over time using Kubernetes object telemetry such as Endpoint or EndpointSlice information exposed through the monitoring stack. These signals establish whether the Service has ready backends inside the cluster. They do not prove external reachability or successful application requests. Useful labels include cluster, namespace, service, workload or deployment, owner or team, and version or revision.
  1. Application requests: monitor request rate, success or error ratio, and latency percentiles such as p50, p95, and p99. These are the strongest signals for service behavior from the user's point of view, but they do not identify infrastructure root cause or prove dependency health. For example, a five-minute 5xx response ratio can be calculated as sum by (service, cluster, namespace, version) (rate(http_requests_total{status_code=~"5.."}[5m])) / sum by (service, cluster, namespace, version) (rate(http_requests_total[5m])). This shows the fraction of observed requests that returned server-side 5xx responses at the instrumented service. It does not by itself prove user impact, infrastructure root cause, or dependency health. Useful labels include cluster, namespace, service or app, owner or team, and version or revision, with route or status dimensions only when needed because extra label values increase metric cardinality.
  1. Telemetry-pipeline freshness: monitor whether scrape targets are up or down, scrape errors, and the freshness or last-sample age of expected metrics. A successful Prometheus scrape proves that a target answered the scrape; it does not prove that every expected application metric is fresh. Stale or absent expected application series therefore need a separate freshness or missing-series check. Useful labels include cluster, job, instance, and namespace, with service or app and owner or team when applicable.

For correlation, I keep stable labels that let operators move between these layers and identify who owns the affected service and which workload or release is running. Labels help correlate evidence, but labels themselves do not establish health. I avoid unnecessary high-cardinality dimensions because they increase series count, ingestion cost, storage, query cost, and dashboard maintenance.

Missing telemetry must be handled explicitly. A numeric zero means the system observed zero. A missing series means there was no observation. I would alert separately when an expected target disappears or when a metric that should exist after a deployment is absent. I would never use missing data as proof of health.

For alerting, I would prefer symptom-based and actionable alerts based on defined SLIs and SLOs, then use node, Pod, container, endpoint, and control-plane signals as diagnostic evidence. Alerts should carry ownership, severity, and runbook context and should use appropriate evaluation windows or other noise controls so short harmless spikes do not page operators unnecessarily.

For dashboards, I would put request success and latency near the top, followed by endpoint availability, Pod state, container resources, node pressure, control-plane signals, and telemetry freshness. That gives an operator a path from service symptoms toward infrastructure evidence without claiming that correlation proves causation.

I would test the monitoring design by deliberately verifying each layer: confirm the Prometheus target is scraping, confirm expected metric series are present and fresh, confirm labels identify the correct owner and deployed version, and confirm the application success and latency views reflect the service's real behavior. I would also test missing-series detection so a broken telemetry path cannot silently appear healthy.

Technical Approach
  1. Define user-visible SLIs and SLOs for request success and latency.
  2. Add the seven minimal signal groups: control plane, nodes, Pods, containers, Service endpoints, application requests, and telemetry freshness.
  3. Attach stable ownership and release-correlation labels to each group.
  4. State what each signal can establish and what it cannot establish.
  5. Create symptom-based alerts and use infrastructure signals as diagnostic evidence.
  6. Detect missing expected targets and series separately from numeric zero values.
  7. Keep metric cardinality controlled by adding detailed dimensions only when needed.
  8. Verify scraping, series freshness, labels, and application success and latency before trusting the monitoring view.
Practical Insights

The main cost is telemetry volume and operational complexity. More metrics and more label combinations create more Prometheus time series. High-cardinality labels such as unnecessary route, Pod, instance, or status combinations increase ingestion, storage, query, and dashboard costs. More alerts also increase maintenance and noise. A minimal signal set with stable labels is cheaper and easier to operate. Longer retention increases storage cost, while expensive queries increase Prometheus resource use. The design should add detail only when that detail answers a real operational question.

Why Interviewers Ask This

This question checks whether the candidate can design a small but useful Kubernetes monitoring model instead of collecting every possible metric. The interviewer wants to see whether the candidate separates infrastructure, workload, application, and telemetry health; understands what each signal proves and does not prove; uses stable labels for ownership and release correlation; and handles missing Prometheus series safely. It also tests whether the candidate can combine signals for evidence-based diagnosis without claiming that one metric proves a root cause.

Common interview mistakes

Common mistakes are monitoring only CPU and memory; assuming a healthy node means the application is healthy; treating Pod readiness as proof of successful requests; assuming ready Service endpoints prove external reachability; using one metric as proof of root cause; depending on scheduler, controller-manager, or etcd metrics when a managed platform does not expose them; adding high-cardinality labels without a real diagnostic need; alerting on raw infrastructure thresholds before defining application SLIs and SLOs; assuming up proves every expected application metric is fresh; and treating an absent Prometheus series as numeric zero instead of unknown telemetry.

Interview tip

Present the answer as seven layers from platform to user-visible behavior, then explain the two rules that make the design safe: every signal has limits, and missing telemetry is not zero. Finish by showing how ownership/version labels and application SLIs let operators correlate evidence without claiming that one metric proves the root cause.

Interviewer may ask next
How would you alert when a Kubernetes Service has no usable backends without confusing missing telemetry with zero endpoints?

I would monitor endpoint readiness from Kubernetes object telemetry and alert when the observed ready-endpoint count is zero for a meaningful window. Separately, I would alert when the expected endpoint metric or its scrape target is missing. Those are different conditions: an observed zero means the monitoring system saw no ready backends, while a missing series means it has no observation. I would attach cluster, namespace, service, workload or deployment, owner or team, and version or revision labels so the alert identifies the affected service and release.

Why not put every Kubernetes label on every Prometheus metric for easier troubleshooting?

Every additional label dimension can multiply the number of Prometheus time series. High cardinality raises ingestion, storage, query, and maintenance cost and can make dashboards and alerts harder to operate. I would keep stable labels needed for ownership and release correlation, such as cluster, namespace, service or app, owner or team, workload or deployment, and version or revision. I would add pod, container, instance, route, or status dimensions only where they answer a specific operational question. Labels help correlation, but they do not by themselves establish health.

More questions load as you scroll

Disclaimer: This interview guide is for educational and informational purposes only. It is designed to help readers prepare, but it does not guarantee any interview result, hiring decision, offer, or outcome. Interview questions, hiring criteria, and preferred answers can vary by employer, interviewer, industry, location, and time. The examples and explanations reflect the authors' research and judgment, are provided without warranties of any kind, and should not be treated as the only correct approach. Diagrams are simplified illustrations intended to highlight the main components and their interactions; actual systems and implementations may be more complex. Alternative approaches may be equally valid or better suited to a particular question, context, or interviewer. To the fullest extent permitted by applicable law, the author, contributors, and publisher are not liable for decisions made, actions taken, or losses incurred based on this guide.

Company Notice: This guide is an independent educational resource and is not affiliated with, endorsed by, sponsored by, or approved by the company named in this guide. Company names are used only to identify interview experiences commonly reported by candidates. Interview practices can change without notice, and inclusion of company-specific content does not mean these questions are official, complete, or guaranteed to be asked. To the fullest extent permitted by law, the author, contributors, and publisher are not responsible for outcomes related to use of this material.

Content Accuracy and Verification: To the fullest extent permitted by applicable law, we do not represent or warrant that interview guides, questions, answers, examples, or diagrams are accurate, complete, current, error-free, or suitable for any particular purpose. You are responsible for independently reviewing and verifying the information before relying on it.