15 Google DevOps Engineer Interview Questions & Answers

google icon

Questions with Detailed ExplanationsWith Detailed Explanations

(Last Updated: September 1, 2026)

1. How would you design a caching server?Cloud InfrastructureEasyGoogle

Question Details

Define the client-facing operations, cache-key boundary, source-of-truth interaction, expiration and eviction behavior, concurrency, failure handling, and observability. Explain what clients should observe when an item is absent, expired, stale, or temporarily unavailable, without assuming a particular cloud provider.

Short Interview Answer (30-60 seconds)

At a high level, the goal is to return frequently used data very quickly. The main challenge is keeping reads fast while handling missing, expired, stale, and unavailable entries correctly. I would explain the design through the request path, the cache and source-of-truth path, and the failure and operations path. Clients use get, set, and delete operations. Cache misses read from the source of truth. The main trade-off is faster access in exchange for expiration, eviction, and consistency complexity.

Detailed Explanation

The goal is to keep commonly requested data close to applications so clients get fast answers. The hard part is deciding what happens when an item is missing, old, removed, or temporarily unavailable. The system must also handle many requests at once without losing control of memory. The diagram organizes this into the client request path, the in-memory cache path, the Source of Truth path, and the operational paths for expiration, failures, scaling, and monitoring. Each get, set, or delete operation targets one cache key and its value.

Useful Questions to Ask the Interviewer
  1. Which get, set, and delete behavior must clients support?
  2. How long may cached values stay valid?
  3. Is serving stale data allowed during refresh or failure?
  4. Should writes use write-through or write-back behavior?
  5. What should clients receive when the cache or Source of Truth is unavailable?
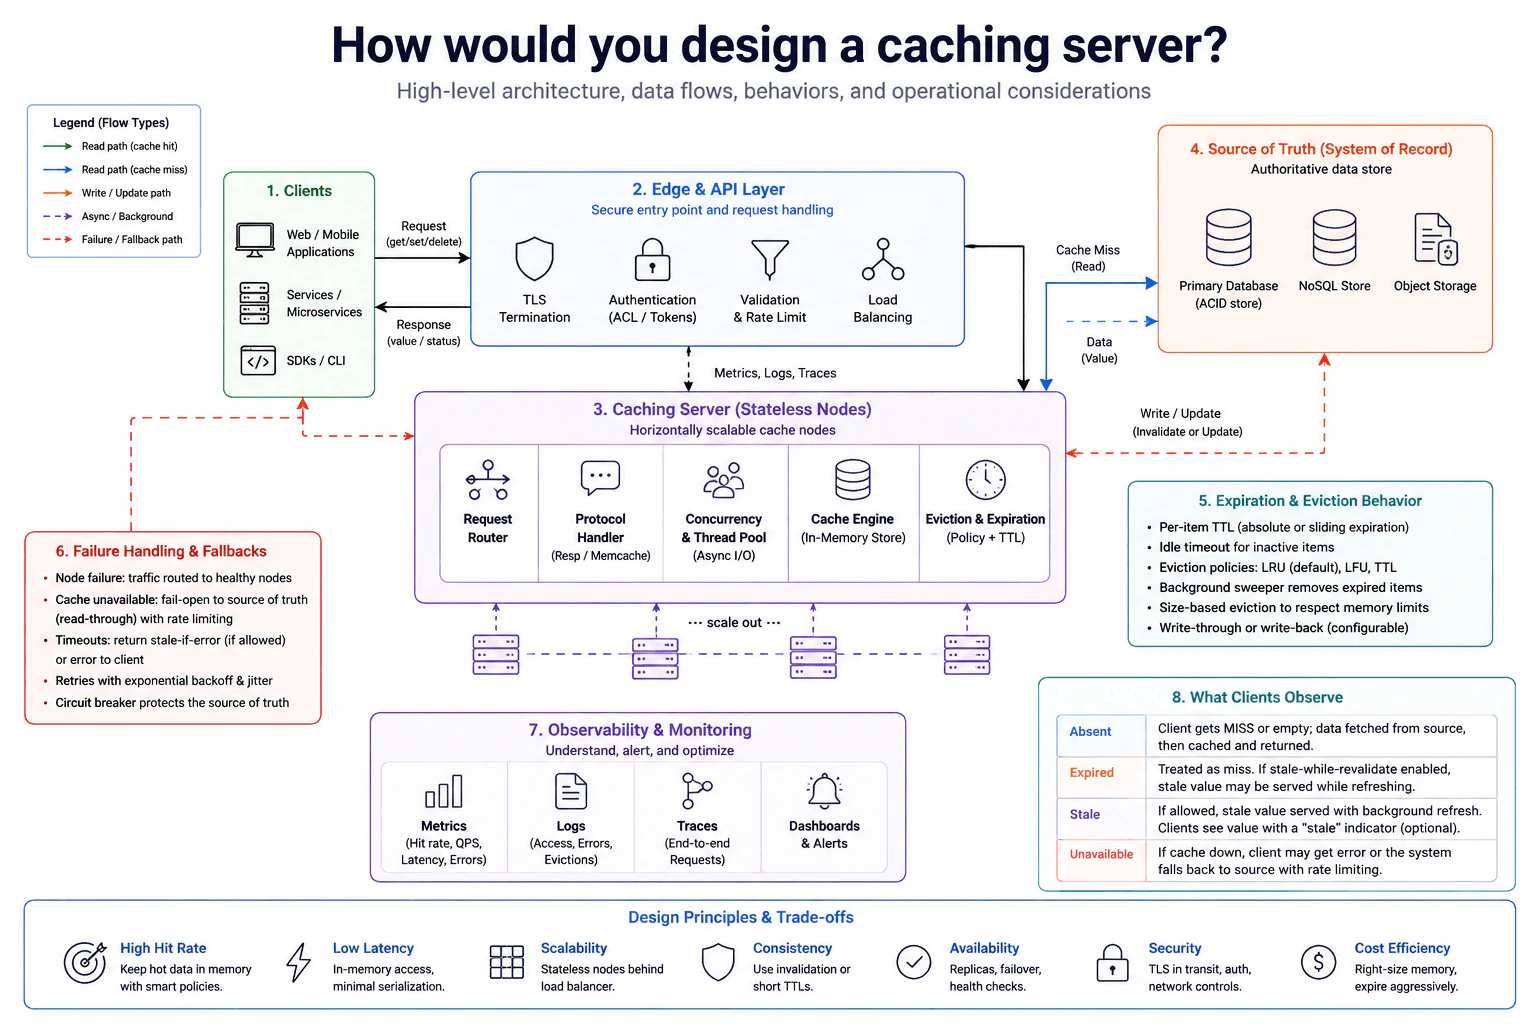
How would you design a caching server? diagram
How to Explain It in an Interview
1. Start with the client request path

I would start with how a request enters the system. Clients can be web or mobile applications, services, microservices, SDKs, or command-line tools. They send get, set, or delete requests through the Edge & API Layer.

That layer terminates TLS, checks authentication, validates requests, applies rate limits, and balances load. The request then reaches a horizontally scalable Caching Server node. The response returns to the client as a value or status.

2. Explain the cache-key and in-memory path

Each operation targets one cache key. That key identifies one entry inside the cache, while the Source of Truth remains responsible for the official data.

Inside a Caching Server node, the Request Router sends work to the Protocol Handler. The Concurrency & Thread Pool handles many requests, using asynchronous I/O where appropriate. The Cache Engine keeps cached values in memory for low latency.

3. Explain hits, misses, expiration, and writes

On a cache hit, the value returns without reading the Source of Truth. If an item is absent or expired, the cache treats it as a miss. It reads the value from the Source of Truth, stores the returned value in cache, and serves it to the client.

Expiration can use a per-item TTL, which means a time limit, or an idle timeout. LRU, LFU, or TTL-based eviction can remove entries when needed. A background sweeper removes expired items, and size-based eviction protects memory limits.

For writes, the diagram allows configurable write-through or write-back behavior. Changes can invalidate or update cached data so clients do not keep using an unwanted old entry.

4. Explain stale and unavailable behavior

If stale serving is allowed, an old value may be returned while the system refreshes it in the background. An expired item is otherwise treated as a miss. An absent item causes a Source of Truth read before the value is cached and returned.

If the cache is unavailable, the system can fall back to the Source of Truth with rate limiting, or return an error. Timeouts may return stale data when allowed. Otherwise, the client receives an error instead of incorrect data.

5. Finish with failures, scale, and observability

If one cache node fails, traffic goes to healthy nodes. Retries use exponential backoff and jitter, which spaces retries apart. A circuit breaker stops repeated failing requests from overwhelming the Source of Truth.

The cache nodes scale horizontally. Monitoring includes hit rate, QPS, latency, errors, evictions, logs, traces, dashboards, and alerts. The benefit is fast access and a high hit rate. The downside is extra work around freshness, memory limits, failures, security, and cost.

Practical Complexity & Trade-offs

The benefit is very fast access because hot data stays in memory. Adding cache nodes also helps the service handle more requests. The downside is that cached data can become old, expire, or be removed when memory is full. Short TTLs give fresher data but cause more reads from the Source of Truth. Longer TTLs reduce those reads but may keep old values longer. Serving stale data can improve availability, but clients may briefly see older information. Write-through is easier to reason about. Write-back can reduce write delay, but it adds more failure risk.

Why Interviewers Ask This

Interviewers ask this to see whether you can design a fast system without forgetting correctness and operations. They want to see how you handle cache keys, hits, misses, expiration, eviction, concurrency, failures, and the Source of Truth. They also look for judgment about stale data, rate limits, retries, scaling, security, monitoring, and the trade-off between speed and fresh data.
Interviewer may ask next
What would you change if the Source of Truth became overloaded during a large wave of cache misses?

I would keep the same basic design, but I would make the fallback path protect the Source of Truth more aggressively. A cache miss can still read from it because it holds the official data. However, the existing rate limiting should restrict how many fallback reads reach it at once.

If requests start timing out, retries should use exponential backoff and jitter. This means each retry waits longer and adds a small random delay. That prevents many retries from arriving together. The circuit breaker should also stop repeatedly sending requests while the Source of Truth is clearly failing.

If stale data is allowed, the cache can return a stale value instead of immediately depending on the Source of Truth. A background refresh can try again later. If stale data is not allowed, the client should receive an error rather than incorrect data.

The downside is reduced freshness or temporary errors. We accept that to keep a problem in the Source of Truth from becoming a larger outage.

How would you handle a requirement that clients should receive stale data while an expired item is being refreshed?

I would use the stale-while-refresh behavior already shown in the design. When an item expires, the cache can keep the old value available when stale serving is allowed. A client requesting that key receives the stale value immediately instead of waiting for the Source of Truth.

At the same time, the system refreshes the value in the background. That refresh reads the current value from the Source of Truth and updates the cached entry. Later requests can then receive the fresh value.

The client-visible behavior should remain clear. A fresh item returns normally. An expired item can return stale data only when that policy is enabled. If refresh fails, the existing timeout and failure rules still apply. The system may continue serving stale data when allowed, or return an error when it cannot safely answer.

The benefit is lower waiting time and better availability. The downside is that clients can temporarily receive older data.

2. How would you design a thumbnail-generation service?Cloud InfrastructureEasyGoogle

Question Details

Design the path from a submitted source image to a retrievable thumbnail. Cover durable source storage, work dispatch, idempotent processing, thumbnail identity, retries, failed jobs, serving and caching, access control, and verification that a generated output corresponds to the intended source version.

Short Interview Answer (30-60 seconds)

At a high level, I would separate accepting an image from generating thumbnails in the background. The main challenge is making retries safe while keeping each thumbnail tied to the correct source version. I would explain three flows: upload and store the source, process jobs through workers, then serve finished thumbnails through the CDN. Durable object storage and a durable queue protect the work. The downside is more infrastructure, but uploads stay responsive and failed processing can be retried safely.

Detailed Explanation

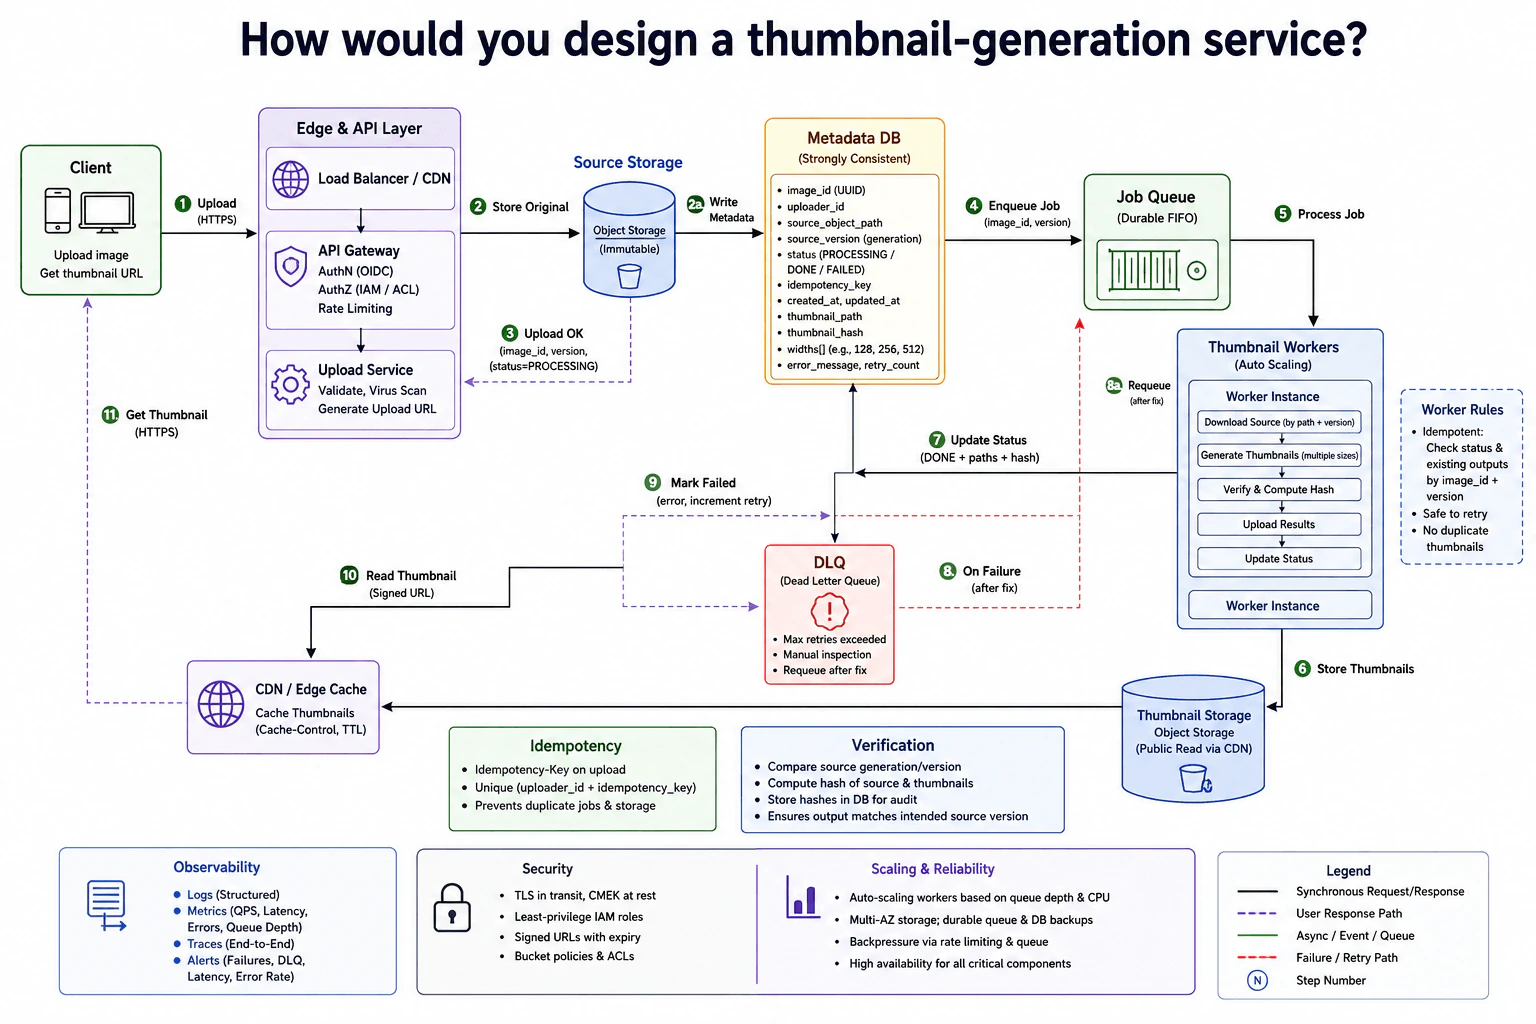
The goal is to accept a source image, keep it safely, create smaller thumbnail versions, and let the client retrieve them later. The difficult part is handling retries and failures without creating duplicate or stale results. We also need proof that each thumbnail came from the intended source version. The diagram solves this with three connected paths. The first stores the upload and metadata. The second sends durable background work to thumbnail workers. The third serves completed thumbnails through an edge cache while keeping access controlled.

Useful Questions to Ask the Interviewer
  1. Which thumbnail sizes must be generated for each image?
  2. How quickly should thumbnails become available after upload?
  3. How long should source images and thumbnails be kept?
  4. Should every thumbnail require private access, or can some be shared?
How would you design a thumbnail-generation service? diagram
How to Explain It in an Interview
1. Accept and store the source image

For the upload path, the client sends the image through the Edge & API Layer. The API Gateway handles AuthN with OIDC, AuthZ with IAM or ACL rules, and rate limiting. The Upload Service validates the image, performs a virus scan, and generates an upload URL.

The original file goes into Source Storage. The diagram treats each stored source version as fixed rather than changing it in place. Metadata DB then records the image ID, uploader ID, source object path, source version, status, idempotency key, timestamps, retry information, thumbnail paths, and hashes.

2. Dispatch durable background work

After the source and metadata are stored, the service enqueues a job in the durable FIFO Job Queue. The job carries the image ID and source version. This lets the upload path finish without waiting for image resizing.

The upload also uses an idempotency key. Here, that means the same upload request can be sent again without creating duplicate jobs or duplicate storage records. The diagram uses the uploader ID plus idempotency key as the unique request identity.

3. Generate thumbnails safely

Thumbnail Workers pull jobs from the queue. Worker capacity can increase when queue depth or CPU usage grows. Each worker downloads the source using its stored path and version, creates the requested thumbnail sizes, verifies the result, computes hashes, uploads the thumbnails, and updates status.

Before repeating work, a worker checks the image ID and source version against existing outputs. This makes processing safe to retry. The stored source version and hashes also let the system verify that an output matches the intended source version.

4. Handle retries and failed jobs

Temporary failures are retried through the queue. The retry count and error information are recorded in Metadata DB. The queue also provides backpressure, meaning work can wait instead of overwhelming the workers.

After the maximum retry count is reached, the job moves to the DLQ, or Dead Letter Queue. Operators can inspect it and requeue the job after the underlying problem is fixed. Observability uses logs, metrics, traces, and alerts for latency, errors, queue depth, worker health, retry activity, and DLQ activity.

5. Serve completed thumbnails

Generated files are stored in Thumbnail Storage. The client retrieves them through the CDN / Edge Cache using a signed URL with an expiry time. The CDN keeps frequently requested thumbnails close to users and reads missing content from Thumbnail Storage.

Security also includes TLS in transit, CMEK encryption at rest, least-privilege IAM roles, and bucket policies or ACLs. The main trade-off is more moving parts. In return, uploads stay responsive, reads are faster, and worker failures can be recovered without losing jobs.

Practical Complexity & Trade-offs

The benefit is that upload work and thumbnail creation are separated. A slow or failed worker does not need to keep the upload request open. The durable queue keeps unfinished jobs safe, and more Thumbnail Workers can be added when queue depth or CPU rises. The downside is more infrastructure to operate. We must manage the Job Queue, workers, Metadata DB, object storage, CDN, retries, and DLQ. Caching makes reads faster, but cached results must still match the correct source version. Retries improve reliability, but every worker must safely handle the same job more than once.

Why Interviewers Ask This

The interviewer wants to see whether you can break a cloud problem into clear flows and keep data correct during failures. They are testing your judgment around durable storage, background jobs, retries, caching, access control, and worker scaling. A strong answer also explains why duplicate processing must be safe and why source versions matter. The goal is practical system-design thinking, not memorizing one cloud product.

Interviewer may ask next
What would you change if thumbnail generation became much slower and the Job Queue kept growing?

I would keep the same architecture and focus on the Job Queue and Thumbnail Workers. The queue already provides backpressure, so new work can wait safely instead of forcing the upload path to block.

I would use the queue-depth and worker-CPU metrics shown in the diagram to increase the number of Thumbnail Workers. Each worker would still process jobs using the image ID and source version. The existing worker rules would also keep retries safe by checking whether the expected output already exists before creating it again.

I would watch processing latency, error rate, retry count, and DLQ activity at the same time. If the queue grows because every job is failing, adding workers would only create more failed attempts. The DLQ and error data help separate a capacity problem from a bad-input or worker problem.

The main downside is cost. More workers use more compute, and scaling cannot repair a broken processing step by itself.

How would you prevent a client from receiving a thumbnail created from an older source version?

I would keep the source version attached to every important step in the existing design. Metadata DB already stores the source version, and the queued job includes the image ID and version. The worker therefore downloads the exact stored source version instead of assuming that the newest object is correct.

When the worker generates thumbnails, it records hashes and the source version with the result. The verification step compares the expected source generation or version and computes hashes. This gives the system a way to confirm that the output belongs to the intended input.

The thumbnail identity and CDN lookup also need to stay tied to the correct image and source version. That prevents an older cached thumbnail from being treated as the current result.

The downside is extra metadata and more careful cache naming. We accept that complexity because returning a thumbnail for the wrong source version is a correctness failure.

3. How would you design a highly available logging system?Cloud InfrastructureMediumGoogle

Question Details

Design collection, buffering, transport, processing, searchable storage, durable retention, and querying for production logs. Cover component and zone failures, backpressure, duplicate and ordering semantics, access control, capacity growth, recovery, and the signals that prove ingestion is current and complete.

Short Interview Answer (30-60 seconds)

At a high level, the goal is to collect production logs reliably and keep them searchable. The main challenge is surviving failures and traffic spikes without losing the logging pipeline. I would explain it in three parts: ingestion and durable buffering, processing and storage, then querying and retention. Logs pass through multi-zone ingestion gateways into a replicated log bus, then processors build searchable data. We use at-least-once delivery, so duplicates are possible. The trade-off is extra infrastructure and storage for better availability.

Detailed Explanation

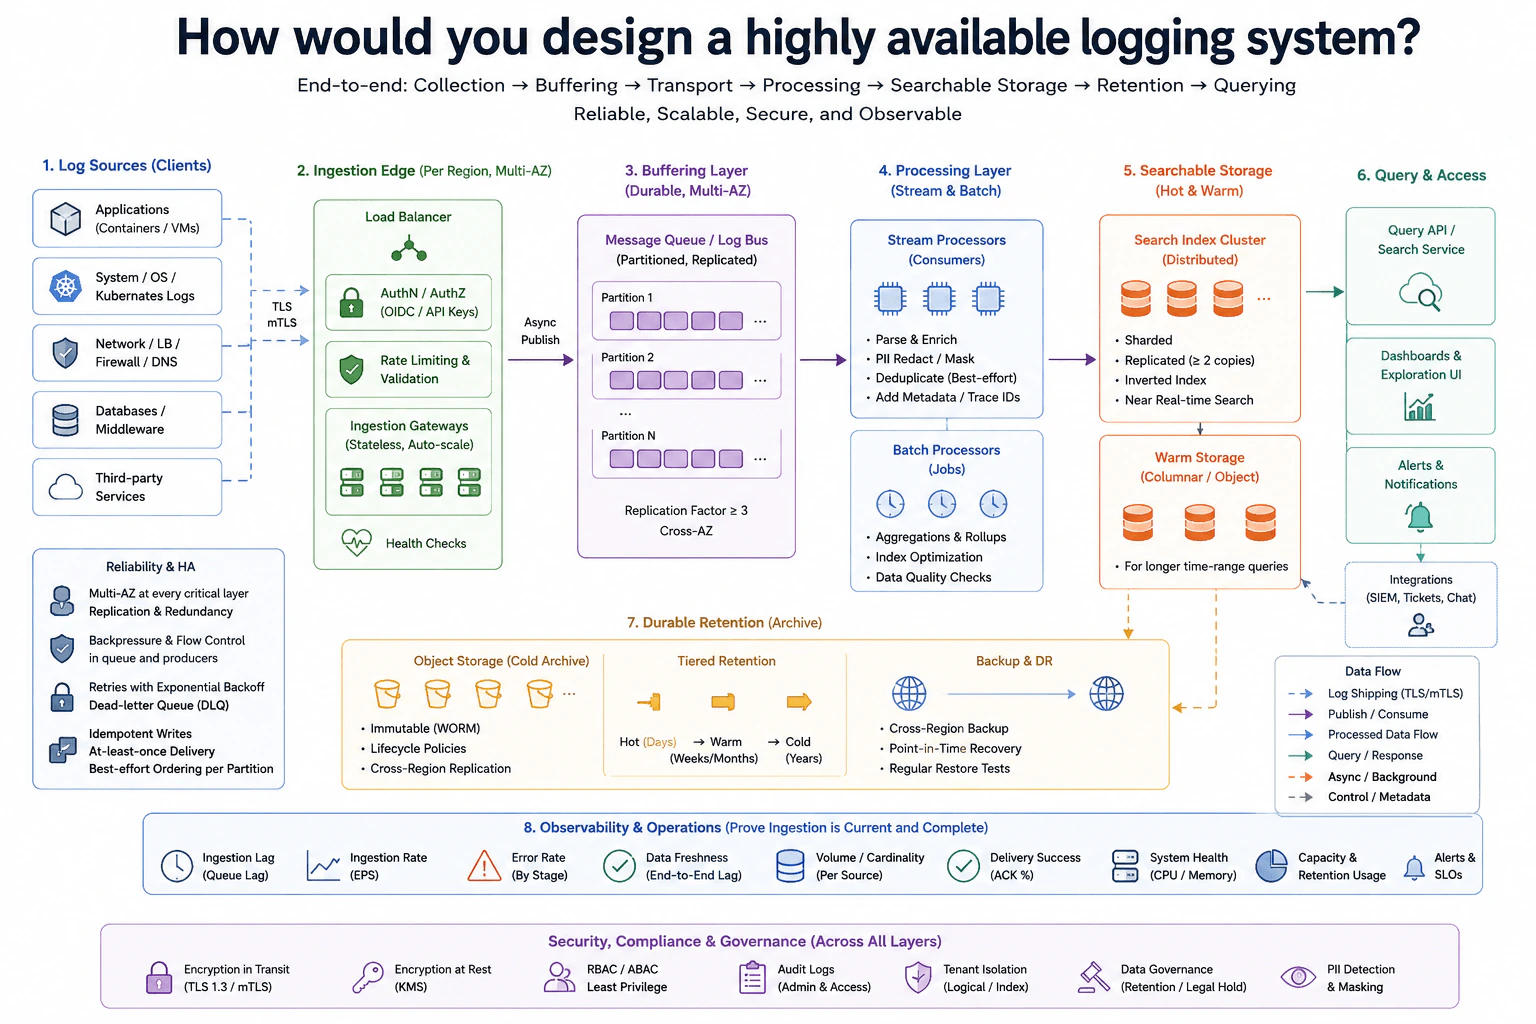
The system must collect logs from applications, operating systems, network devices, databases, and third-party services. It must keep working when a machine or availability zone fails. Large bursts of logs must not overwhelm slower processing or storage. The design therefore separates accepting logs from processing them. A durable buffer protects the pipeline during spikes. Stream and batch processors prepare the data. Recent logs stay searchable, while older logs move to cheaper storage. Security, recovery, and monitoring apply across the full system.

Useful Questions to Ask the Interviewer
  1. How quickly should new logs become searchable?
  2. How long should logs stay in hot, warm, and cold storage?
  3. Which log sources need stronger access controls or tenant isolation?
  4. How much duplicate data is acceptable during retries?
  5. What recovery expectations apply after a regional failure?
How would you design a highly available logging system? diagram
How to Explain It in an Interview
1. Collect logs through a highly available ingestion edge

For ingestion, log sources send data through TLS or mTLS. A Load Balancer spreads traffic across stateless Ingestion Gateways running across availability zones. The edge performs AuthN and AuthZ, which means identity and permission checks. It also applies validation and rate limits. Health checks stop traffic from going to unhealthy gateways. Because the gateways are stateless and can auto-scale, more replicas can be added as ingestion grows.

2. Buffer logs before downstream processing

The gateways publish logs asynchronously to the Message Queue / Log Bus. The bus is partitioned and replicated across availability zones, with a replication factor of at least three shown in the diagram. This durable buffer separates accepting logs from processing them. If consumers slow down, the queue absorbs work while backpressure and flow control protect producers and the ingestion edge.

Delivery is at least once. A record can therefore be delivered again after a retry. Ordering is best effort per partition, not one global order for all logs. Retries use exponential backoff. Records that cannot be processed can move to the Dead-letter Queue for later handling.

3. Process logs for search and longer-term use

Stream Processors consume from the log bus. They parse and enrich records, mask sensitive information, add metadata and trace IDs, and perform best-effort duplicate removal. Writes should be idempotent, which means repeating the same write should not create harmful extra results.

Batch Processors handle aggregations, rollups, index optimization, and data quality checks. This work can run separately from the normal stream path.

4. Store and query logs by age

Processed logs enter the distributed Search Index Cluster. It is sharded to spread data across machines and replicated with at least two copies shown in the diagram. Recent data supports near-real-time search. Older searchable data moves to Warm Storage for longer time-range queries.

The Query API / Search Service provides access to the searchable data. Dashboards and exploration tools use that path. Alerts and notifications also consume the searchable results, and integrations can connect the logging platform to SIEM, ticketing, and chat systems.

5. Retain, recover, secure, and observe the platform

Cold logs move to Object Store for durable retention. The diagram shows WORM protection, lifecycle policies, and cross-region replication. Retention moves data from hot to warm to cold storage. Disaster recovery uses cross-region backup, point-in-time recovery, and regular restore tests.

I would watch ingestion lag, ingestion rate, stage error rate, end-to-end freshness, per-source volume, delivery success, system health, capacity, retention usage, alerts, and SLOs. Encryption in transit and at rest, RBAC or ABAC, least privilege, audit logs, tenant isolation, data governance, and PII detection and masking apply across the design. The main trade-off is that these copies, tiers, retries, and recovery controls improve resilience but add cost and operational complexity.

Practical Complexity & Trade-offs

The benefit is that one failed machine or availability zone should not stop the whole logging path. The replicated queue gives logs a durable place to wait when processing becomes slow. Replicated search storage also gives the system extra copies during failures. The downside is more storage, more machines, and more operating work. At-least-once delivery can create duplicate records, so processors need safe retry behavior. Hot storage makes recent searches fast, while warm and cold tiers lower long-term storage cost. We accept slower access to older logs because keeping every log in the fastest tier would cost much more.

Why Interviewers Ask This

Interviewers ask this to see whether you can build a reliable data pipeline, not just name cloud products. They want to see how you separate ingestion from processing, handle bursts, survive machine and zone failures, and scale storage. They also look for clear thinking about duplicates, ordering, backpressure, recovery, access control, and the signals that prove logs are still arriving and becoming searchable.

Interviewer may ask next
What would you change if log volume suddenly became ten times larger?

I would keep the same architecture and scale the stages independently. The stateless Ingestion Gateways can add more replicas behind the Load Balancer. The Message Queue / Log Bus can use more partitions so more producers and consumers can work in parallel. Stream Processors and Batch Processors can also add workers as queue lag grows.

The Search Index Cluster would need more shards and storage capacity as indexed data grows. Older data should continue moving through Warm Storage into Object Store according to the retention policy. I would watch ingestion rate, queue lag, end-to-end freshness, stage errors, system health, and capacity usage while scaling.

The correctness rules do not change. Delivery is still at least once, ordering is still best effort per partition, and processors still need idempotent writes and duplicate handling. The main downside is higher cost and more partition, shard, and capacity management.

What happens if one availability zone containing ingestion or queue components fails?

I would use the multi-zone behavior already built into the design. Health checks detect unhealthy Ingestion Gateways, and the Load Balancer sends new traffic to healthy gateways in other zones. Because the gateways are stateless, surviving replicas can continue accepting logs.

The Message Queue / Log Bus is replicated across availability zones. The diagram shows a replication factor of at least three, so the design keeps multiple copies across zones. Consumers can continue processing from the surviving queue replicas. Some records may be retried during the failure. Because delivery is at least once, retries can create duplicates, so the processing layer keeps idempotent writes and best-effort duplicate removal.

I would watch ingestion lag, queue lag, delivery success, error rate, data freshness, and system health during the incident. The main downside is reduced remaining capacity until the failed zone or its capacity is restored.

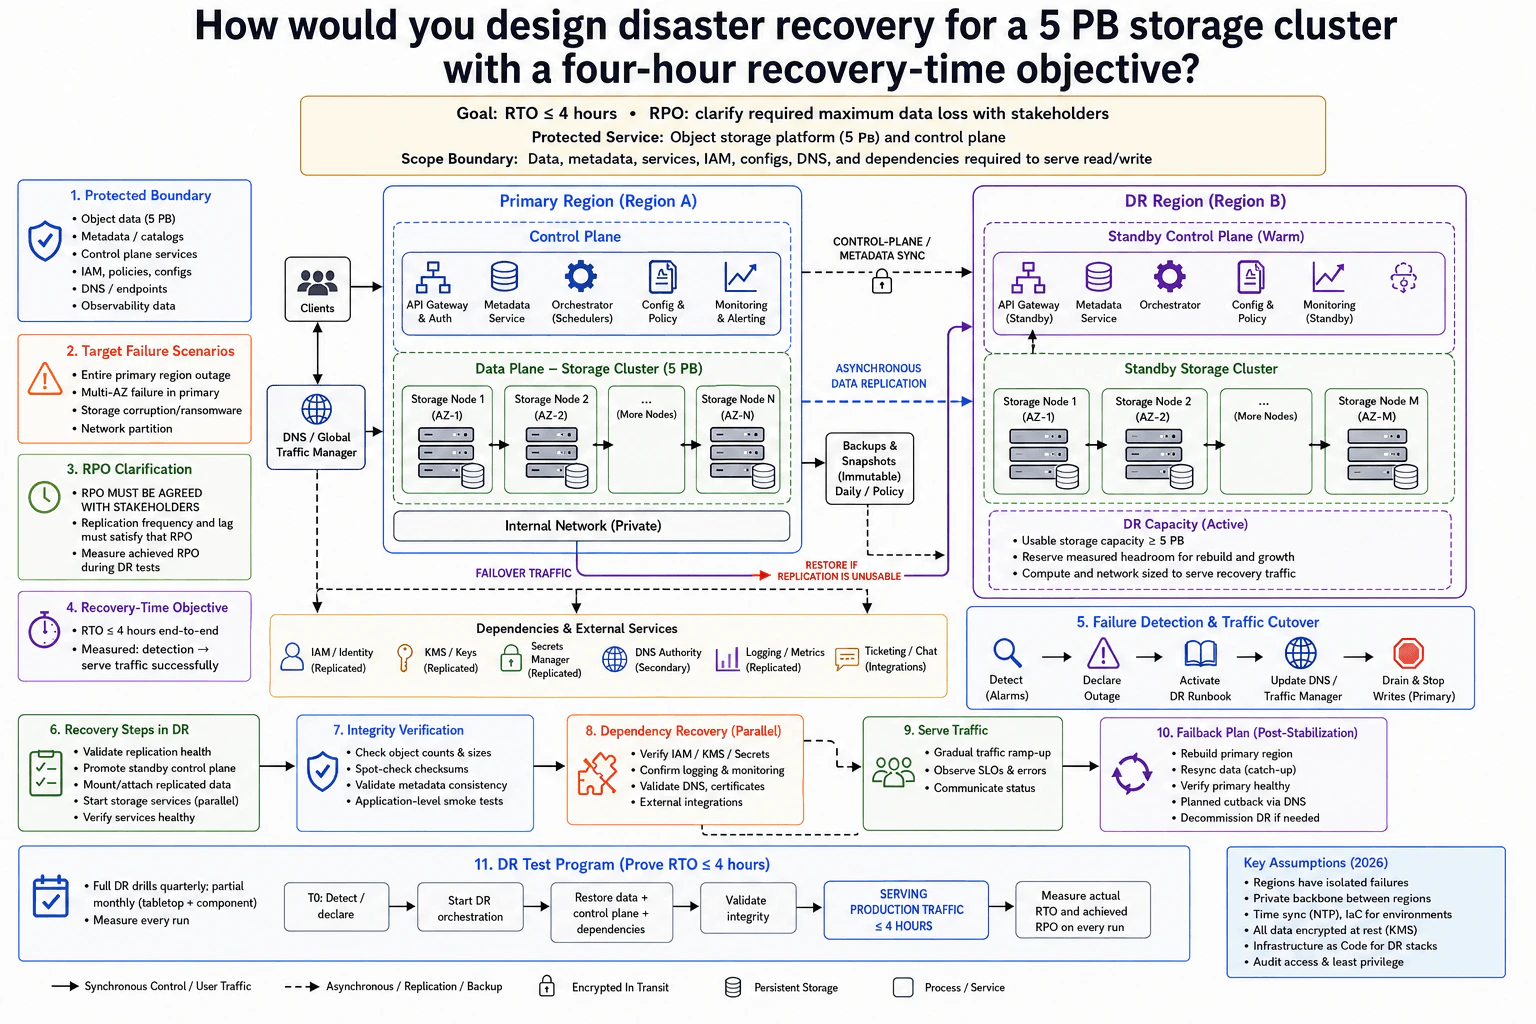
4. How would you design disaster recovery for a 5 PB storage cluster with a four-hour recovery-time objective?Cloud InfrastructureHardGoogle

Question Details

Define the protected service and data boundary, target failure scenarios, the recovery-point requirement that must be clarified, replication or backup path, recovery-site capacity, metadata and control-plane recovery, traffic cutover, integrity verification, dependency recovery, failback, and a test program that measures the actual four-hour objective.

Short Interview Answer (30-60 seconds)

At a high level, the goal is to keep a 5 PB storage service usable after a major regional failure. The hard part is recovering data, control services, and dependencies within four hours. I would explain this in three flows: keeping the DR region ready, switching traffic during a disaster, and validating recovery. The design uses asynchronous data replication, a warm standby control plane, independent backups, and tested runbooks. The trade-off is higher cost for DR capacity and continuous replication.

Detailed Explanation

The goal is to recover a very large storage service when the primary region cannot safely serve users. The system protects 5 PB of object data plus everything needed to read and write that data. The difficult part is that copying or rebuilding 5 PB after a disaster would take too long. The design therefore prepares a second region before trouble happens. Recovery includes the data, control services, access rules, keys, DNS, monitoring, and required integrations. Success means production traffic is served again within four hours.

Useful Questions to Ask the Interviewer
  1. What is the required RPO, meaning the maximum amount of recent data we may lose?
  2. Which failures must the design cover beyond a complete regional outage?
  3. Must the DR region immediately handle the full production workload?
  4. Which external integrations are required before production traffic can return?
How would you design disaster recovery for a 5 PB storage cluster with a four-hour recovery-time objective? diagram
How to Explain It in an Interview
1. Define the protected boundary and failure cases

I would protect more than the 5 PB of object data. The boundary also includes metadata, control-plane services, IAM, policies, configuration, DNS, observability data, and required dependencies. The target failures include an entire primary-region outage, multi-AZ failure, storage corruption or ransomware, and a network partition. The RTO is four hours end to end. The RPO must be agreed with stakeholders because it defines how much recent data may be lost.

2. Keep the DR region ready before a disaster

The primary Data Plane – Storage Cluster continuously sends data to the Standby Storage Cluster using asynchronous data replication. This means the copy happens in the background and may be slightly behind. Control-plane and metadata information use a separate CONTROL-PLANE / METADATA SYNC path. The DR region keeps a Standby Control Plane with API Gateway, Metadata Service, Orchestrator, Config & Policy, and Monitoring. Its usable storage capacity is at least 5 PB, with measured extra room for rebuilding and growth.

3. Keep an independent backup path

Backups & Snapshots provide a separate recovery option. They are not the normal replication path. This matters because replication can also copy damaged or unwanted changes. If replication is unusable, the team can restore from backups instead. Dependencies include IAM / Identity, KMS / Keys, Secrets Manager, DNS Authority, Logging / Metrics, and Ticketing / Chat integrations.

4. Detect the failure and cut over traffic

Monitoring detects the problem, the team declares the outage, and the DR runbook starts. The standby control plane is promoted. The team validates replication health, mounts or attaches replicated data, and starts storage services. Required dependencies can recover in parallel where possible. DNS / Global Traffic Manager then sends FAILOVER TRAFFIC to API Gateway in the DR region. The primary side is drained and writes are stopped when that action is possible and safe.

5. Verify recovery, serve traffic, and fail back

Before normal traffic returns, the team checks object counts and sizes, spot-checks checksums, validates metadata consistency, and runs application-level smoke tests. Traffic increases gradually while operators watch SLOs and errors. DR drills measure the real RTO and achieved RPO on every run. After the primary region is rebuilt, data is resynchronized, primary health is verified, and traffic returns through a planned DNS cutback. The main trade-off is cost because DR storage, network capacity, and warm services must exist before the disaster.

Practical Complexity & Trade-offs

The benefit is that the DR region already has replicated data and a warm control plane, so recovery does not start from zero. Independent backups also provide another option when replicated data cannot be trusted. The downside is cost. Keeping at least 5 PB of usable DR storage, extra rebuild room, network capacity, and standby services is expensive. Asynchronous replication can also leave the DR copy slightly behind the primary copy. That is why the RPO must be agreed with stakeholders. We accept these costs because rebuilding a 5 PB platform only after a disaster would make the four-hour recovery goal much harder.

Why Interviewers Ask This

The interviewer wants to see whether the candidate thinks beyond simply copying data. A strong answer connects the recovery goal to data replication, control-plane recovery, capacity, dependencies, traffic switching, validation, failback, and testing. It also shows whether the candidate understands that RTO and RPO measure different things. Most importantly, the interviewer wants evidence that the candidate would test the plan and measure real recovery results instead of trusting an untested design.

Interviewer may ask next
What would you change if the business required an RPO of almost zero instead of allowing several minutes of possible data loss?

I would keep the same two-region design, but the data replication path would need a much stricter requirement. The current diagram uses asynchronous data replication, so the Standby Storage Cluster can be slightly behind the primary Storage Cluster. That may not satisfy an almost-zero RPO.

I would first measure the current replication delay during peak write load and network problems. If it cannot stay inside the new RPO, the replication behavior must wait for stronger confirmation from the DR side before some writes are considered safe.

That changes the relationship between the primary and standby storage clusters, but the rest of the DR flow can stay the same. Integrity checks, dependency recovery, traffic cutover, and failback still apply.

The downside is higher write delay and more sensitivity to regional network failures. During a network partition, the system may need to slow or stop writes rather than risk losing acknowledged data.

How would you recover if replication copied corrupted or ransomware-encrypted data into the DR region?

I would not automatically trust the replicated DR copy. The diagram keeps Backups & Snapshots as an independent recovery path for this case. Replication helps recovery happen quickly, but it can also copy bad changes from the primary region.

During recovery, the team would use the Integrity Verification step before serving production traffic. We would check object counts and sizes, spot-check checksums, validate metadata consistency, and run application-level smoke tests. If those checks show that replicated data is unsafe, the team uses the RESTORE IF REPLICATION IS UNUSABLE path from Backups & Snapshots to the Standby Storage Cluster.

The Standby Control Plane and required dependencies still need to be active before users can be served. After validation passes, DNS / Global Traffic Manager can move traffic to the DR API Gateway.

The downside is time. Restoring 5 PB from backups may be much slower, so backup recovery must be tested against the four-hour RTO.

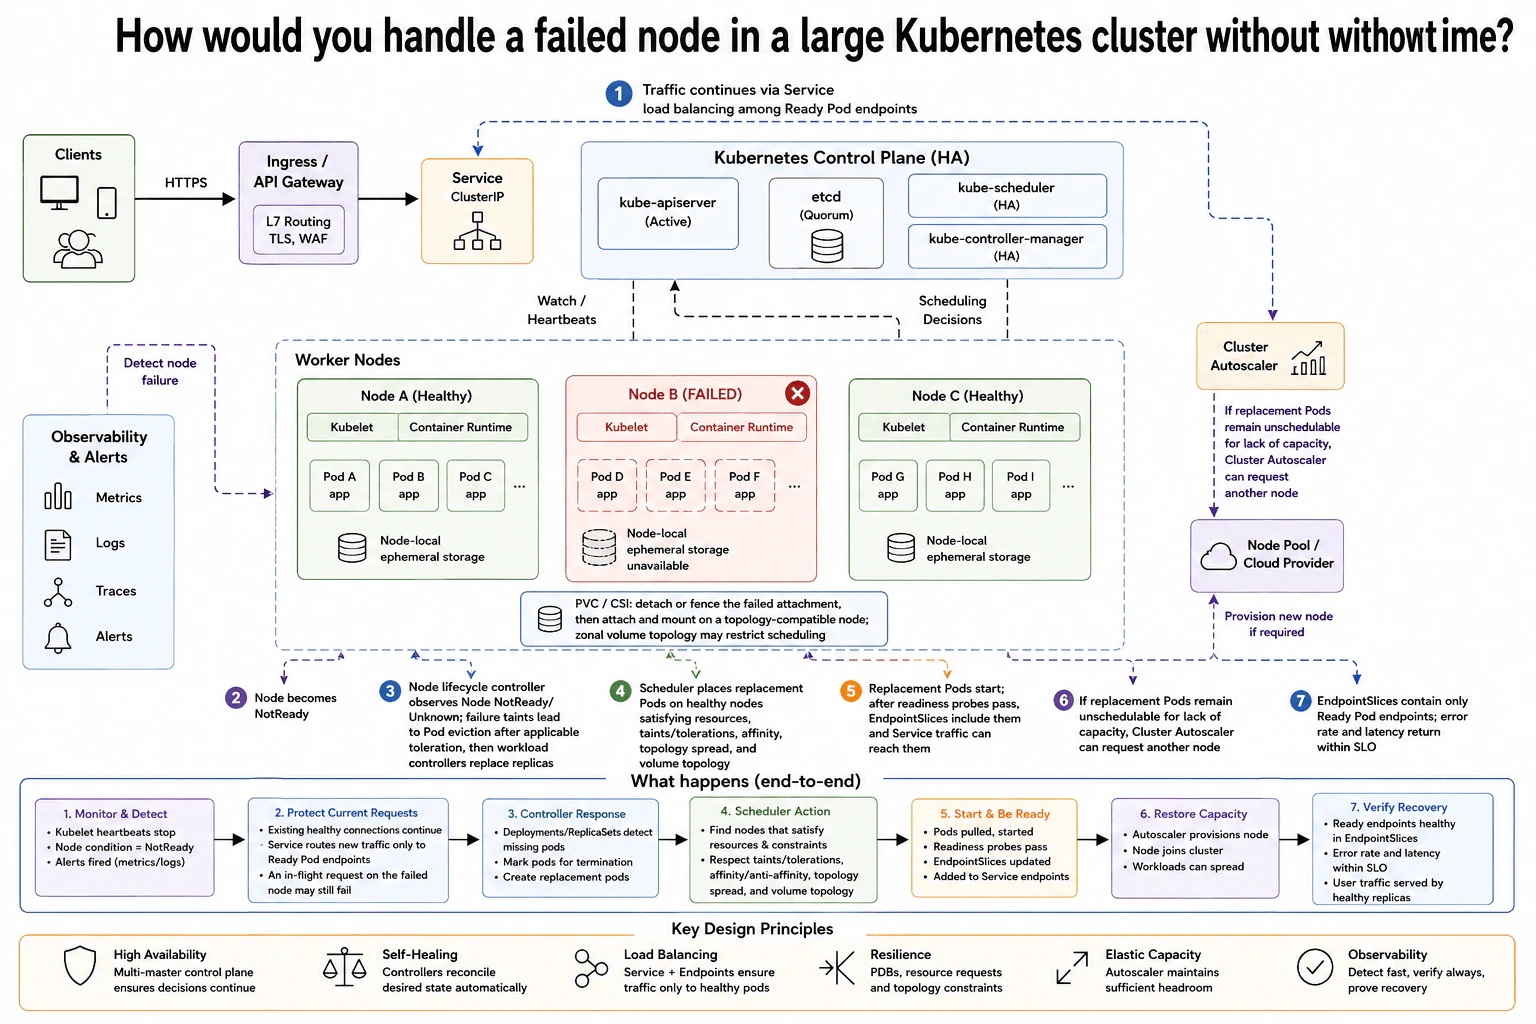
5. How would you handle a failed node in a large Kubernetes cluster without downtime?Containers And KubernetesMediumGoogle

Question Details

A worker node becomes unavailable while replicated workloads are serving traffic. Explain how you would confirm the failure, protect current requests, verify controller and scheduler response, ensure replacement Pods can run elsewhere, handle attached state and topology constraints, restore capacity, and prove that Service endpoints and user traffic recovered.

Short Interview Answer (30-60 seconds)

At a high level, the goal is to survive one worker-node failure while healthy replicas keep serving traffic. The main challenge is removing the failed Pods from traffic and creating replacements on suitable healthy nodes. I would explain it in three parts: detect the node failure, replace and reschedule the lost Pods, then verify recovery. The Service uses Ready Pod endpoints throughout. The main trade-off is that an in-flight request on the failed node may still fail.

Detailed Explanation

The goal is to keep the application serving users when one Kubernetes worker node suddenly becomes unavailable. Healthy replicas must keep receiving new requests while Kubernetes notices the failure and rebuilds the missing replicas elsewhere. The replacement Pods also need enough compute capacity and must satisfy placement and storage rules. The diagram handles this as one recovery flow. It detects the bad node, protects traffic, lets the control plane replace and schedule Pods, handles attached storage when needed, restores worker capacity, and finally checks that Service traffic and application health have returned to normal.

Useful Questions to Ask the Interviewer
  1. Are the workloads already running with multiple replicas across different workers?
  2. Do any affected Pods use PVC or CSI volumes with zone restrictions?
  3. Should the Cluster Autoscaler add workers when existing nodes cannot run replacement Pods?
How would you handle a failed node in a large Kubernetes cluster without downtime? diagram
How to Explain It in an Interview
1. Protect traffic and confirm the failure

I would first keep new traffic away from the failed worker. Clients reach the Ingress / API Gateway, then the Service with a ClusterIP. The Service routes new traffic through Ready Pod endpoints, so healthy replicas on Node A and Node C can keep serving users. An in-flight request already running on failed Node B may still fail.

At the same time, I would confirm the node failure. Kubelet heartbeats stop, and the node condition becomes NotReady or Unknown. Observability & Alerts provides metrics, logs, traces, and alerts to help confirm what happened.

2. Let the control plane replace the lost replicas

The highly available Kubernetes Control Plane keeps managing the cluster. The kube-apiserver is the control-plane entry point, while etcd stores cluster state. The kube-controller-manager observes the failed node and missing workload replicas.

The node lifecycle controller applies failure handling to Node B. After applicable toleration behavior, the failed Pods can be removed from the desired running set. Deployments or ReplicaSets then create replacement Pods so the requested replica count can be restored.

3. Schedule replacement Pods on healthy nodes

The kube-scheduler selects healthy workers for the new Pods. A node must have enough requested CPU and memory. It must also satisfy taints and tolerations, affinity rules, topology spread, and any volume topology limits.

This matters because a healthy node is not automatically a valid destination. Placement rules may prevent a replacement Pod from running there.

4. Handle storage and make replacements Ready

Node-local ephemeral storage belongs to one worker. If Node B is lost, its node-local data becomes unavailable.

A PVC using CSI storage follows a different recovery path. The old attachment may need to be detached or fenced first. The volume can then attach and mount on a topology-compatible node. A zonal volume may restrict which healthy workers can run that Pod.

After a replacement Pod starts, its readiness probe must pass. EndpointSlices then include the Ready Pod, and the Service can send traffic to it.

5. Restore capacity and verify recovery

If replacement Pods stay unschedulable because the cluster lacks capacity, the Cluster Autoscaler can request another worker from the Node Pool / Cloud Provider. After the worker joins, the scheduler can place waiting Pods there.

Finally, I would verify recovery instead of assuming it worked. EndpointSlices should contain healthy Ready endpoints. Error rate and latency should return within the SLO. User traffic should be served by healthy replicas. This gives evidence that both Kubernetes state and real user traffic recovered.

Practical Complexity & Trade-offs

The benefit is that healthy replicas can keep serving new traffic while Kubernetes rebuilds the lost replicas. Controllers restore the desired Pod count, and the scheduler chooses workers that satisfy capacity and placement rules. Readiness probes stop new Pods from receiving traffic too early. The Cluster Autoscaler can add a worker when the cluster is short on capacity. The downside is that recovery is not instant. An in-flight request on the failed node may fail. Attached storage can also slow recovery because it may need detach, fencing, reattachment, and a compatible zone. PDBs help with planned disruptions, but they cannot stop an unexpected node failure.

Why Interviewers Ask This

Interviewers ask this to test whether you understand Kubernetes recovery as an end-to-end process, not just Pod restarting. They want to see how you protect traffic, confirm a node failure, understand controller and scheduler behavior, handle storage and topology limits, restore capacity, and prove recovery. They also want good judgment about failure limits, such as recognizing that a request already running on a failed node cannot be guaranteed to finish.

Interviewer may ask next
What would you do if the replacement Pods remain Pending because no healthy node has enough capacity?

I would first confirm why the replacement Pods are Pending. The scheduler may have no node with enough requested CPU or memory, or another placement rule may be blocking every worker.

If lack of compute capacity is the reason, the Cluster Autoscaler can request another worker from the Node Pool / Cloud Provider. After the new worker joins the cluster, the kube-scheduler can consider it for the Pending Pods. That node must still satisfy taints and tolerations, affinity, topology spread, and any volume topology requirements.

Once the replacement Pods start, I would wait for their readiness probes to pass. EndpointSlices should then include those Ready Pods, allowing the Service to send them traffic. I would check the application error rate and latency against the SLO to prove recovery.

The main downside is time. Provisioning a new worker is slower than using spare capacity that already exists in the cluster.

How would recovery change if a failed Pod uses a zonal PVC through CSI?

I would keep the same node-failure recovery flow, but storage becomes an important scheduler constraint. The replacement Pod cannot simply move to any healthy worker.

When Node B fails, the PVC may still have an attachment associated with that node. The storage system may need to detach or fence the old attachment before another worker can safely use the volume. The kube-scheduler must also choose a node that matches the volume topology. For a zonal volume, that can limit placement to workers in the compatible zone.

After the volume attaches and mounts, the replacement Pod can start. Its readiness probe must pass before EndpointSlices include it as a Ready endpoint. The Service can then send traffic to that Pod. I would verify healthy endpoints, error rate, and latency before declaring recovery complete.

The downside is slower recovery because storage operations and topology limits can delay rescheduling even when compute capacity is available.

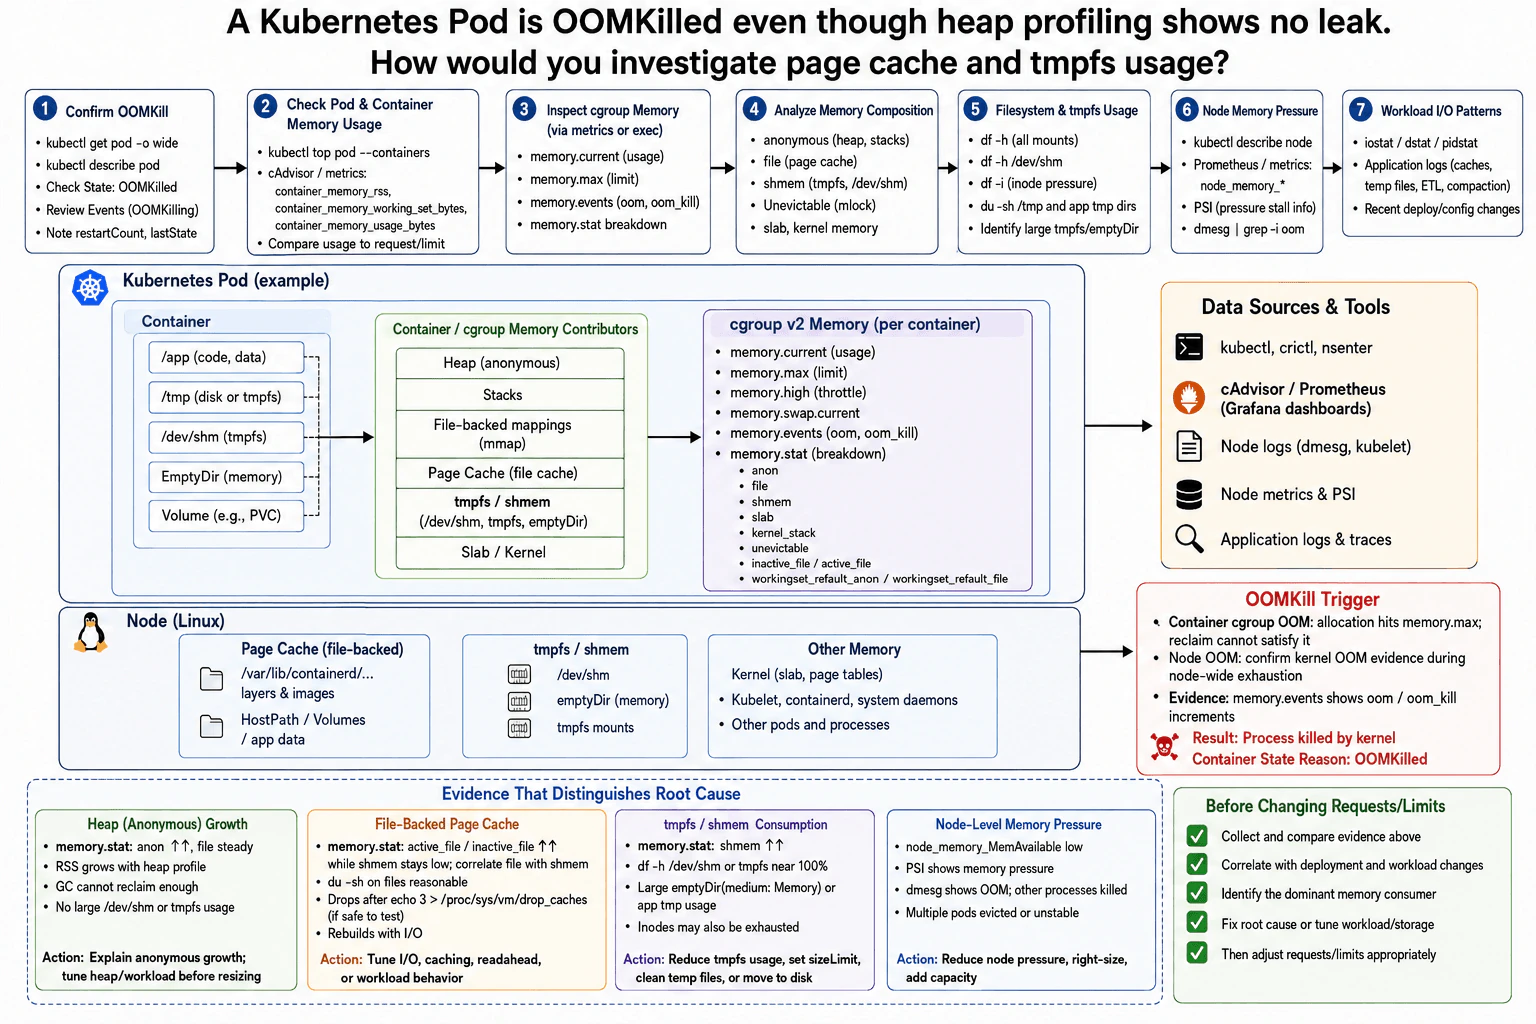
6. A Kubernetes Pod is OOMKilled even though heap profiling shows no leak. How would you investigate page cache and tmpfs usage?Containers And KubernetesHardGoogle

Question Details

Use Pod status and events, container and cgroup memory counters, resident and working-set views, filesystem and tmpfs usage, page-cache behavior, node memory pressure, and workload I/O patterns. State what evidence distinguishes heap growth, file-backed cache, tmpfs consumption, and node-level pressure before changing requests or limits.

Short Interview Answer (30-60 seconds)

At a high level, I would treat this as a memory-accounting problem instead of assuming the heap is the cause. The main challenge is finding which memory type pushed the container into an OOMKill. I would check Pod and cgroup evidence, then separate anonymous memory, file-backed page cache, tmpfs or shmem, and node pressure. I would correlate those results with workload I/O. Only after finding the dominant consumer would I change workload behavior, storage choices, requests, or limits.

Detailed Explanation

An OOMKilled container ran out of memory from Linux's point of view, even when the application heap looks normal. The missing memory may be file data kept in page cache, memory-backed temporary files, or other memory charged to the container. The problem can also involve wider pressure on the node. The goal is therefore to find which memory category grew, confirm where the OOM happened, and connect that evidence to filesystem use and workload activity before changing memory settings.

Useful Questions to Ask the Interviewer
  1. Is the workload using cgroup v2 memory accounting?
  2. Does it use /dev/shm, tmpfs, or a memory-backed emptyDir?
  3. Did the failures begin after an I/O, deployment, or configuration change?
  4. Are other Pods on the same node seeing memory pressure or evictions?
A Kubernetes Pod is OOMKilled even though heap profiling shows no leak. How would you investigate page cache and tmpfs usage? diagram
How to Explain It in an Interview
1. Confirm the OOMKill evidence

I would start with the evidence Kubernetes already gives me. I would inspect the container state, last state, restart count, and Pod events. I would also compare memory usage with the configured request and limit. This confirms the failure before I decide what consumed the memory.

2. Compare container and cgroup memory views

Next, I would compare several memory views instead of trusting one graph. cAdvisor or Prometheus can show container_memory_rss, container_memory_working_set_bytes, and container_memory_usage_bytes. RSS shows resident memory. The working-set metric is commonly calculated from usage after subtracting inactive file cache, so it is useful but is not a perfect measure of reclaimable memory.

With cgroup v2, I would inspect memory.current, memory.max, memory.events, and memory.stat. If the container hits its cgroup limit and reclaim cannot free enough memory, memory.events can show oom or oom_kill increments. memory.stat then helps separate anon, file, shmem, slab, and active or inactive file memory.

3. Distinguish heap, page cache, and tmpfs

If anon grows while file memory stays steady, anonymous memory such as heap or stacks is the stronger suspect. I would compare that with the heap profile and RSS.

For page cache, I would look for growth in active_file or inactive_file while shmem stays low. I would also correlate the increase with heavy file reads. The file counter alone is not enough because cgroup file accounting can include tmpfs and shared memory.

If shmem grows, I would inspect /dev/shm, tmpfs mounts, and memory-backed emptyDir volumes. Large files there consume memory even when the application heap remains flat.

4. Check node pressure and workload I/O

I would inspect the node for MemoryPressure, low available memory, PSI memory pressure, kernel OOM messages, and other Pods being evicted or becoming unstable. This helps separate a container-limit problem from node-wide exhaustion.

Then I would correlate the memory pattern with I/O and recent workload changes. Heavy reads can build file-backed page cache. Writes to /dev/shm or a memory-backed emptyDir can grow shmem.

5. Change the cause, not just the limit

The final action depends on the evidence. Anonymous growth may need heap or workload tuning. Page-cache growth may need different I/O, caching, or readahead behavior. tmpfs growth may require reducing temporary data, setting a size limit, cleaning files, or moving data to disk. Node pressure may require reducing memory use, rescheduling workloads, or adding capacity. I would change requests or limits only after identifying the dominant memory consumer.

Why Interviewers Ask This

The interviewer wants to see whether I can debug memory beyond an application heap profiler. A strong answer shows that I understand container memory accounting, page cache, tmpfs, cgroups, node pressure, and workload I/O. It also tests operational judgment. I should combine several signals, distinguish different memory causes, and avoid changing requests or limits until the evidence explains what is consuming memory.

Interviewer may ask next
What would you do if memory.stat shows file-backed memory growing quickly while the application heap stays flat?

I would treat file-backed memory as the leading suspect, but I would confirm what makes up that memory before changing the limit. I would inspect active_file and inactive_file in memory.stat and check whether shmem stays low. That distinction matters because the broader file counter can also include tmpfs and shared-memory usage.

Next, I would correlate the growth with workload I/O. I would look for large or repeated file reads, application data access, temporary-file activity, or another read-heavy pattern. If page cache is the cause, its growth should line up with that file activity.

The change should target the workload behavior first. I might reduce unnecessary reads, tune application caching or readahead behavior, or change how files are accessed. I would then retest under similar load. The main downside is that reducing page-cache use can increase storage reads and make some operations slower. I would raise the memory limit only if the workload truly needs more memory after that analysis.

How would your investigation change if several Pods on the same node start failing or being evicted at the same time?

I would move node-level pressure much higher in the investigation. One container can hit its own cgroup limit, but several Pods becoming unstable together is strong evidence that the node may also be short of memory.

I would inspect the node for MemoryPressure, available memory, PSI memory pressure, kernel OOM messages, and eviction events. PSI shows whether tasks are spending time stalled because memory is under pressure. I would also compare other Pods and system processes on the node instead of looking only at the original container.

I would still keep the container evidence. memory.events can help show whether that container's cgroup recorded oom or oom_kill. Kernel logs help confirm a node-wide OOM path.

If node pressure is the main cause, I would reduce the node memory footprint, reschedule workloads, or add capacity. The downside is that adding capacity can hide inefficient workloads, so I would still identify the largest consumers.

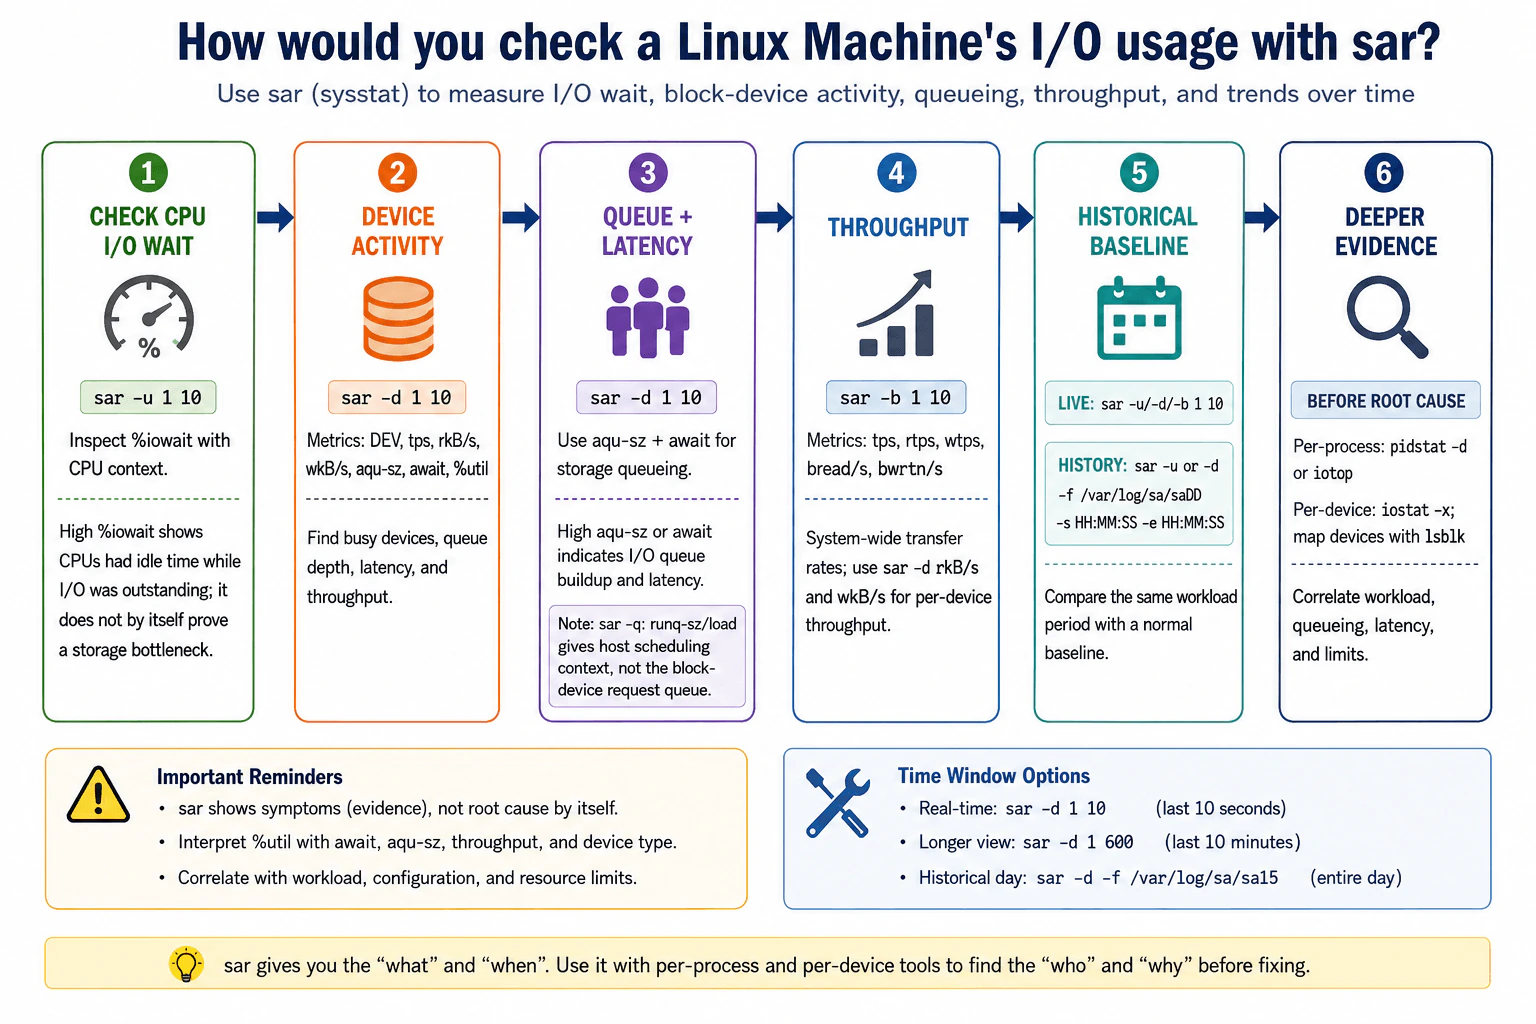
7. How would you check a Linux machine's I/O usage with sar?ObservabilityEasyGoogle

Question Details

Identify the sar views and time window you would inspect for CPU I/O wait, block-device activity, queueing, throughput, and historical comparison. State what each observation can establish and what additional per-process or per-device evidence is required before assigning root cause.

Short Interview Answer (30-60 seconds)

I would check sar -u for %iowait, sar -d for device activity, aqu-sz, await, %util, and per-device throughput, and sar -b for system-wide transfer rates. I would compare live data with a historical baseline, then collect per-process and deeper per-device evidence before assigning root cause.

Detailed Explanation

I would first check whether the computer is spending unusual time waiting for reading or writing work to finish. Then I would find which storage area is busiest, whether work is piling up, how long requests are taking, and how much information is moving. I would look at a short period while the slowdown is happening and compare it with an earlier normal period. These observations can show what changed and when it changed, but they cannot identify the responsible program by themselves. I would collect more evidence before deciding what caused the slowdown.

Useful Questions to Ask the Interviewer
  1. Is the problem happening now, or should I investigate a historical time window?
  2. Do we need only sar analysis, or may I use per-process and per-device tools to confirm the cause?
  3. Is there a known normal period or workload baseline for comparison?
How would you check a Linux machine's I/O usage with sar? diagram
How to Explain It in an Interview

I would use a six-step evidence chain that matches the investigation flow.

  1. Check CPU I/O wait. Run sar -u 1 10 and inspect %iowait together with the other CPU fields. %iowait is the percentage of CPU time spent idle while the system had outstanding I/O. A high value supports the hypothesis that I/O is affecting the host, but it does not by itself prove that storage is the bottleneck.

2. Inspect device activity. Run sar -d 1 10. I would examine DEV, tps, rkB/s, wkB/s, aqu-sz, await, and %util. These show the device, transfers per second, read and write throughput, average outstanding requests, average request latency, and device busy time. I would interpret %util together with await, aqu-sz, throughput, and device type instead of treating a high %util value as universal proof of saturation.

  1. Check queueing and latency. For storage queueing, I would use aqu-sz and await from sar -d. Sustained growth in aqu-sz together with elevated await can indicate that requests are building up and taking longer. I would not use sar -q as the block-device queue measurement. sar -q gives host scheduling and load context, such as run-queue information, which can help distinguish CPU scheduling pressure from storage pressure.
  1. Check throughput. Run sar -b 1 10 and inspect tps, rtps, wtps, bread/s, and bwrtn/s. These are system-wide transfer statistics; bread/s and bwrtn/s are blocks read and written per second, not kilobytes per second. For per-device throughput, I would use rkB/s and wkB/s from sar -d.
  1. Compare with a historical baseline. For live observation, commands such as sar -u 1 10, sar -d 1 10, and sar -b 1 10 provide a short sample. If sysstat collection is enabled, historical files are commonly stored as /var/log/sa/saDD. I can inspect a specific period with a command such as sar -d -f /var/log/sa/saDD -s HH:MM:SS -e HH:MM:SS. I would compare the same workload period with a known normal baseline rather than comparing unrelated times.
  1. Collect deeper evidence before root cause. sar tells me what happened and when, but usually not which process caused it or why. I would use pidstat -d or iotop for per-process I/O, iostat -x for deeper per-device statistics, and lsblk to map Linux device names to the storage layout. I would correlate workload, queueing, latency, throughput, configuration, and storage limits before assigning root cause.

The main tradeoff is that sar is lightweight and useful for both live and historical host-level evidence, but aggregated CPU and device statistics cannot always identify the responsible process or explain why that workload generated the I/O.

Technical Approach
  1. Run sar -u 1 10 and inspect %iowait in CPU context.
  2. Run sar -d 1 10 and inspect DEV, tps, rkB/s, wkB/s, aqu-sz, await, and %util.
  3. Correlate aqu-sz and await to determine whether storage requests are accumulating or becoming slower.
  4. Run sar -b 1 10 and inspect system-wide transfer activity with tps, rtps, wtps, bread/s, and bwrtn/s.
  5. Compare the live window with a similar historical workload period using the sysstat archive and -f, -s, and -e.
  6. If the pattern is abnormal, use pidstat -d or iotop for per-process evidence and iostat -x plus lsblk for deeper per-device evidence.
  7. Assign root cause only after workload, device activity, queueing, latency, throughput, and relevant resource limits agree.
Practical Insights

The sar commands themselves normally have low CPU and memory overhead, so they are suitable for routine diagnosis. Historical cost mainly comes from how often sysstat collects samples and how long those files are retained; shorter intervals and longer retention use more disk space. The larger operational cost is interpretation because one measurement can be misleading. Maintenance includes configuring collection, keeping enough history for comparison, rotating old files, and making sure the chosen sample window matches the period when the problem occurred.

Why Interviewers Ask This

This question tests whether the candidate can use Linux sar data as diagnostic evidence without jumping to a root-cause conclusion. A strong answer distinguishes CPU I/O wait, block-device activity, storage queueing, latency, throughput, and historical behavior, and knows when sar must be supplemented with tools such as pidstat, iotop, iostat, and lsblk.

Common interview mistakes

Common mistakes are treating high %iowait as proof of a disk bottleneck, assuming high %util alone proves device saturation, using sar -q as though it measured the block-device request queue, relying on obsolete svctm reasoning, calling bread/s or bwrtn/s kilobytes per second, confusing system-wide sar -b activity with per-device throughput, comparing unrelated historical periods, and blaming a process or device without collecting supporting per-process and per-device evidence.

Interview tip

Present the answer as one evidence chain: CPU I/O wait, device activity, queue and latency, throughput, historical baseline, then deeper process and device evidence. Explicitly say that sar shows what happened and when, but correlated evidence is required before saying who caused it or why.

Interviewer may ask next
If %iowait is high, can you immediately conclude that the disk is the bottleneck?

No. High %iowait means CPU time was idle while the system had outstanding I/O, but that alone does not identify a slow device or prove storage saturation. I would correlate it with sar -d values such as await, aqu-sz, %util, and throughput, then collect per-process and deeper per-device evidence before assigning root cause.

How would you determine which process is creating the I/O after sar shows an abnormal device pattern?

I would use pidstat -d or iotop to collect per-process I/O evidence during the same problem window. I would correlate that activity with the affected device from sar -d, use iostat -x for deeper device statistics, and use lsblk to map device names to the storage layout. I would assign responsibility only when the process activity matches the device, timing, queueing, latency, and throughput pattern.

8. How would you capture and analyze network traffic with tcpdump?ObservabilityEasyGoogle

Question Details

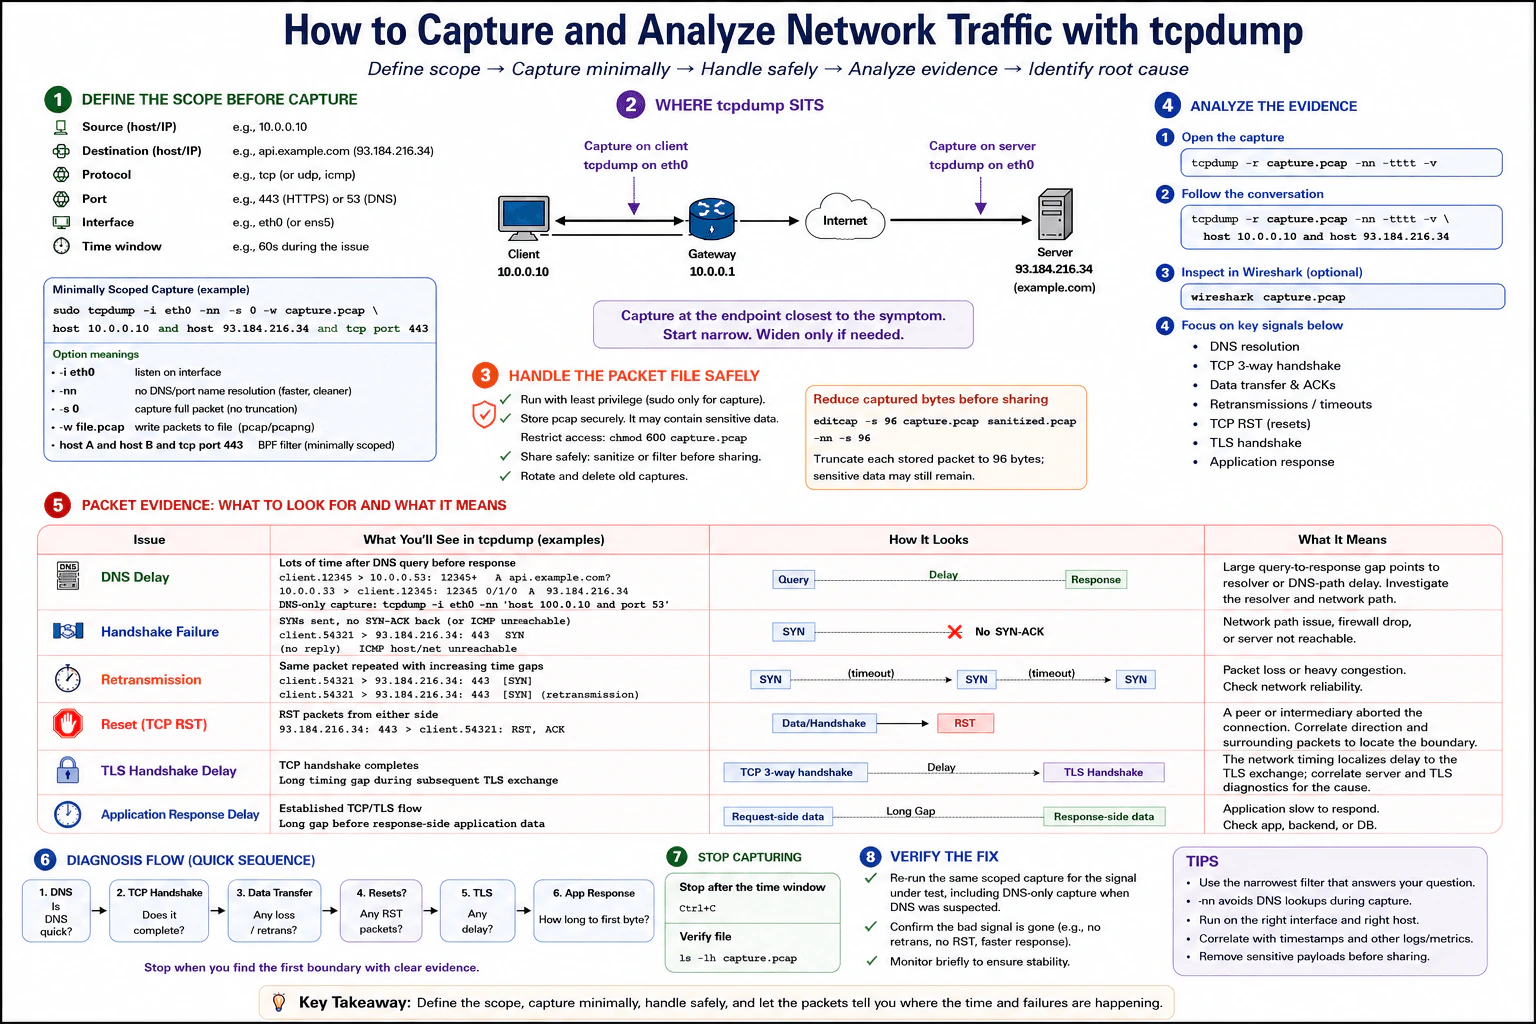
Define the source, destination, protocol, port, interface, and time window before capture. Describe a minimally scoped capture, safe handling of the packet file, and the packet evidence used to distinguish DNS delay, handshake failure, retransmission, reset, TLS delay, and application response delay.

Short Interview Answer (30-60 seconds)

I define source, destination, protocol, port, interface, and time window first, then capture only that traffic. I protect the PCAP and analyze timestamps, DNS exchanges, SYN/SYN-ACK behavior, retransmissions, RST packets, TLS timing, and request-side versus response-side data timing to locate the first failing or slow boundary.

Detailed Explanation

See the Code while reading this explanation.

You are trying to see exactly what is happening between two computers while a problem occurs. First decide who is talking, where the traffic is going, what kind of conversation matters, which connection is involved, where to watch it, and how long to watch. Record only that small slice so you do not collect unnecessary private information. Then compare the order and timing of messages. The goal is to find the first place where something is missing, repeated, unexpectedly stopped, or taking too long, and then investigate that boundary.

Useful Questions to Ask the Interviewer
  1. Which source and destination are involved?
  2. Which protocol and port should I investigate?
  3. Which interface or host is closest to the reported symptom?
  4. What exact time window should the capture cover?
  5. Am I allowed to store packet payloads, or should the capture be truncated or sanitized before sharing?
How would you capture and analyze network traffic with tcpdump? diagram
How to Explain It in an Interview

I would start by defining the capture scope before running tcpdump: source IP, destination IP, protocol, port, interface, and a short time window. For example, if client 10.0.0.10 is having an HTTPS problem with 93.184.216.34, I can capture TCP port 443 on eth0 and write the packets to a PCAP file. I use -nn so tcpdump does not perform name or service lookups, -s 0 when full packet capture is genuinely required, and a narrow BPF filter so unrelated traffic is excluded.

I capture at the endpoint closest to the symptom first. If that does not isolate the boundary, I can capture at another relevant endpoint and compare timestamps. I stop after the defined time window rather than leaving tcpdump running indefinitely.

I treat the PCAP as sensitive data. I store it securely, restrict permissions, retain it only as long as needed, and remove or truncate unnecessary packet data before sharing. Truncation is only risk reduction: even the first bytes of a packet can still contain sensitive information.

For analysis, I read the PCAP with tcpdump using precise timestamps and numeric addresses. Wireshark can be used as an optional visual inspection tool. I follow the relevant conversation and use packet evidence to locate the first abnormal boundary. Packet evidence narrows the investigation; by itself it usually does not prove the final root cause.

For DNS delay, I need a DNS capture rather than assuming an HTTPS-only capture contains the DNS exchange. I compare the DNS query timestamp with its response. A large query-to-response gap points to the resolver or DNS path, but I still correlate other evidence before naming a cause.

For a TCP handshake failure, I look for SYN packets without the expected SYN-ACK. Repeated SYNs show that the connection is not being established. Possible causes include the network path, firewall or security policy, a blocked port, or an unavailable server, so the packets identify the failing boundary rather than proving one specific cause.

For retransmission, I look for TCP data or SYN packets being sent again because the expected acknowledgment did not arrive. Repeated transmissions can indicate loss or severe congestion. I then investigate the network path and correlate interface counters, MTU information, congestion signals, or captures from another boundary.

For a reset, I look for an RST or RST,ACK and note its direction. A reset means that a peer or intermediary aborted the connection. Its direction, surrounding packets, and capture location help identify which boundary should be investigated next.

For TLS delay, I first verify that the TCP handshake completes, then measure the timing of the subsequent TLS exchange. A long timing gap localizes the delay to that phase. tcpdump timing alone does not prove whether CPU pressure, certificate work, cryptography, server load, or another TLS-related condition caused it, so I correlate server and TLS diagnostics before naming the cause.

For application response delay, I verify that TCP and TLS setup completed and then compare the timing between client-to-server request-side data and subsequent server-to-client response-side data. A long gap shifts the investigation toward the application, backend, database, or downstream services. With encrypted HTTPS traffic, I do not claim that ordinary tcpdump output exposes plaintext HTTP requests or responses.

After making the smallest appropriate correction outside the packet capture itself, I repeat the same scoped measurement for the signal under test. If DNS was the suspected boundary, I repeat the DNS-specific capture. I confirm that the previous bad signal is gone, such as repeated SYNs, unexpected resets, retransmissions, or an excessive timing gap, and briefly monitor correlated service telemetry to confirm stable behavior.

The main tradeoff is capture depth versus safety and overhead. A broad or long capture can provide more context, but it also increases storage, analysis effort, and privacy exposure. Full packets may be useful for some investigations, while truncated packets reduce stored data but can remove information needed later. I therefore start narrow and widen only when the evidence requires it.

Key Insight / Why This Solution Works
  1. Define source, destination, protocol, port, interface, and a bounded time window.
  2. Capture at the endpoint closest to the symptom with a narrow BPF filter.
  3. Write packets to a protected PCAP and stop when the planned window ends.
  4. Read the capture with precise timestamps and numeric addresses; use Wireshark only if visual inspection helps.
  5. Follow the relevant conversation and inspect DNS timing, TCP handshake behavior, retransmissions, resets, TLS timing, and application-data timing.
  6. Stop at the first boundary with clear evidence and correlate that evidence with the responsible system.
  7. Apply the smallest safe correction outside the capture process.
  8. Re-run the same scoped test and confirm that the original packet-level symptom has disappeared.
Code
import subprocess


def run_command(command: list[str]) -> None:
    subprocess.run(command, check=True)


# Capture packet-level HTTPS evidence at the client-side eth0 interface.
# The BPF filter limits collection to the two endpoints and TCP port 443, reducing unrelated traffic and privacy exposure.
# tcpdump performs packet-level collection rather than metric sampling or aggregation; no alert condition is configured here.
try:
    run_command(
        [
            "sudo",
            "tcpdump",
            "-i",
            "eth0",
            "-nn",
            "-s",
            "0",
            "-w",
            "capture.pcap",
            "host 10.0.0.10 and host 93.184.216.34 and tcp port 443",
        ]
    )
except KeyboardInterrupt:
    pass

# Stop with Ctrl+C when the defined diagnostic time window ends.
# Bounding the collection limits storage, operational overhead, and unnecessary retention of packet data.

# Read the stored evidence with numeric addresses and precise timestamps.
# Timing, direction, TCP flags, retransmissions, and resets help localize the failing or slow boundary.
run_command(["tcpdump", "-r", "capture.pcap", "-nn", "-tttt", "-v"])

# Restrict offline analysis to the same HTTPS conversation.
# This isolates evidence for TCP establishment, retransmission, reset, TLS timing, and post-handshake data timing.
run_command(
    [
        "tcpdump",
        "-r",
        "capture.pcap",
        "-nn",
        "-tttt",
        "-v",
        "host 10.0.0.10 and host 93.184.216.34 and tcp port 443",
    ]
)

# Capture DNS separately because the HTTPS-only PCAP cannot show the earlier port-53 name-resolution exchange.
# Compare query and response timestamps to test whether DNS is the slow boundary.
try:
    run_command(
        [
            "sudo",
            "tcpdump",
            "-i",
            "eth0",
            "-nn",
            "-w",
            "dns.pcap",
            "host 10.0.0.10 and port 53",
        ]
    )
except KeyboardInterrupt:
    pass

# Create a reduced copy before sharing when 96 stored bytes per packet are sufficient for the diagnostic purpose.
# Truncation reduces retained payload data but does not guarantee removal of secrets or other sensitive information.
run_command(["editcap", "-s", "96", "capture.pcap", "sanitized.pcap"])

# Restrict local access because PCAP files can contain credentials, identifiers, addresses, or application data.
run_command(["chmod", "600", "capture.pcap", "sanitized.pcap", "dns.pcap"])

# Verification: repeat the same scoped capture after the correction and compare the original signal.
# Confirm that the relevant symptom, such as repeated SYNs, retransmissions, resets, or excessive timing gaps, is no longer present.
Why Interviewers Ask This

The interviewer wants to know whether I can use packet evidence methodically instead of guessing. I should define a narrow capture scope, choose the correct interface and capture point, protect the PCAP file, interpret packet timing and TCP behavior, distinguish DNS, connection, retransmission, reset, TLS, and application delays, and verify the result without claiming that one packet pattern alone proves the root cause.

Common interview mistakes

Common mistakes are capturing all traffic instead of defining source, destination, protocol, port, interface, and time window; capturing on the wrong interface; leaving tcpdump running too long; using filters so narrow that required evidence such as DNS is excluded and then assuming it was captured; storing or sharing PCAP files without protecting sensitive data; assuming truncation removes all secrets; treating a missing SYN-ACK, retransmission, or reset as proof of one root cause; claiming ordinary tcpdump exposes plaintext HTTP inside HTTPS traffic; and changing the application before preserving packet evidence.

Interview tip

Present tcpdump as an evidence tool, not a root-cause oracle. Start with the exact scope, show one narrow capture command, explain what each packet pattern tells you, distinguish evidence from possible causes, mention PCAP privacy, and finish by repeating the same scoped capture to verify the correction.

Interviewer may ask next
How would you tell whether a connection problem is DNS, TCP handshake, TLS, or application delay?

I would use timing boundaries in order. First, capture DNS separately and compare the query with its response. Next, verify whether SYN receives SYN-ACK and whether the TCP handshake completes. After TCP is established, measure the subsequent TLS exchange. Finally, after TCP and TLS setup are complete, compare client-to-server request-side data with subsequent server-to-client response-side data. The first phase with a missing packet, repeated packet, reset, or abnormal timing gap identifies the boundary to investigate. I would then correlate logs, server diagnostics, or network telemetry before claiming the exact root cause.

What would you do if the PCAP is too sensitive to share with another team?

I would first determine what packet evidence the other team actually needs. I would keep the original capture in a restricted location, minimize retention, and create a reduced copy when possible. I could filter the PCAP to only the required flow and truncate stored packets, for example with editcap -s 96, but I would not claim that truncation guarantees removal of secrets. Headers and early packet bytes may still contain sensitive information. If packet contents are unnecessary, I would share derived timing or packet metadata instead and follow the organization's security and data-handling policy.

9. Packets reach some parts of a network but not others. How would you isolate the failing segment?ObservabilityMediumGoogle

Question Details

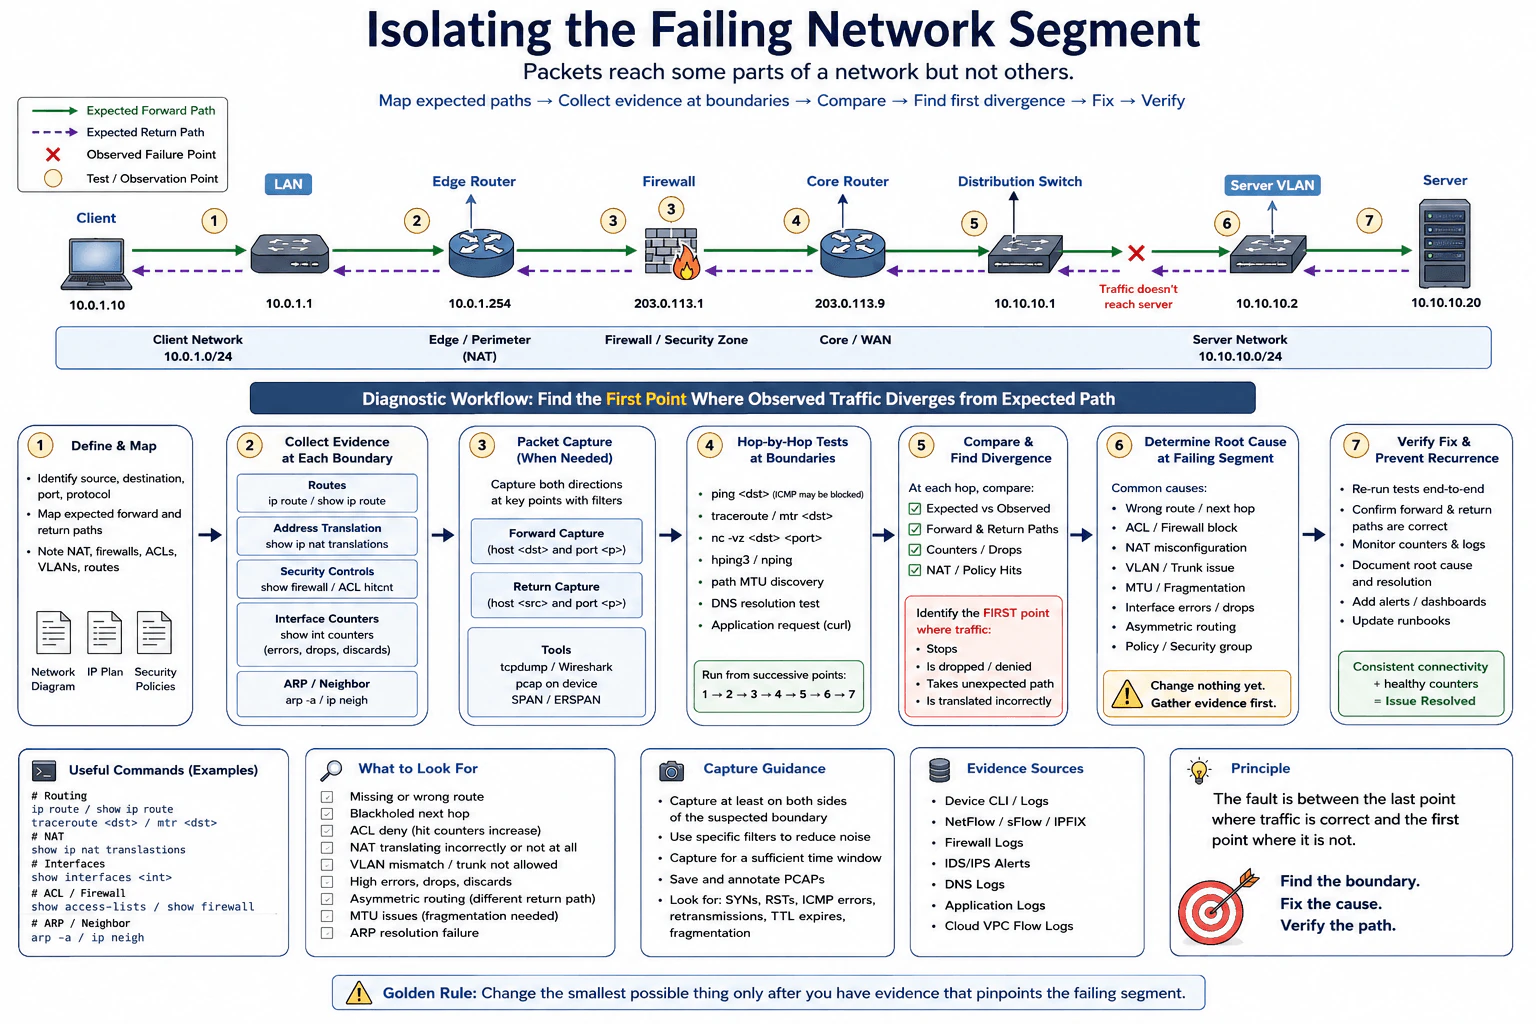
Map the expected forward and return path, then compare routes, address translation, security controls, interface counters, packet captures, and hop-by-hop tests at successive boundaries. Explain how you would locate the first point where observed traffic diverges from the expected path before changing configuration.

Short Interview Answer (30-60 seconds)

I map the expected forward and return paths, then test each boundary using routes, NAT state, security controls, interface counters, targeted packet captures, and hop-by-hop probes. The last correct point and first incorrect point define the failing boundary. I change only the confirmed cause and then retest both directions.

Detailed Explanation

When only part of a network can be reached, I want to discover exactly where the journey stops working. I first draw the route that information should take going to the destination and coming back. Then I check one stopping point at a time instead of changing things randomly. At each point, I compare what should happen with what actually happens. The last point that works and the first point that does not work give me the small area to investigate. Only after finding evidence there do I make a change and test the whole journey again.

Useful Questions to Ask the Interviewer
  1. What are the source and destination addresses, protocol, and destination port?
  2. Which intermediate boundaries are known to be reachable, and from where were those tests performed?
  3. Are NAT, firewalls, ACLs, VLANs, trunks, or other security policies present along the path?
  4. Is the failure one-way, intermittent, or limited to particular sources, destinations, ports, or protocols?
  5. Can I inspect routing tables, neighbor state, interface counters, policy counters, logs, and packet captures at the relevant boundaries?
Packets reach some parts of a network but not others. How would you isolate the failing segment? diagram
How to Explain It in an Interview

I would begin by mapping the expected forward path and the expected return path. I would record the source, destination, protocol, destination port, gateways, routes, VLANs, NAT boundaries, firewalls, ACLs, and other relevant security controls. The return path must be checked separately because replies can take a different route or be blocked even when the request reaches the destination.

Before changing anything, I would collect evidence at successive observation points. At each router or boundary, I would compare the routing decision with the expected next hop. Where NAT exists, I would inspect the translation state and verify that the translated addresses and return mapping are correct. At security boundaries, I would inspect the applicable firewall or ACL policy and its hit or drop counters. On interfaces, I would inspect receive and transmit counters, errors, drops, and discards. I would also check ARP or neighbor state where local next-hop resolution is relevant.

Next, I would test the path hop by hop. Ping can provide basic reachability evidence when ICMP is allowed, but a failed ping does not prove the network path is broken because ICMP may be filtered. Traceroute or mtr can show where probes stop or take an unexpected path. For the real service, I would also test the destination port with a TCP-oriented tool such as nc when appropriate. DNS checks or application requests are useful only when they are part of the observed failure.

If the failing boundary is still unclear, I would use short, narrowly filtered packet captures at key points, ideally on both sides of the suspected boundary. I would compare the same flow in both directions and ask: did the packet arrive, did it leave toward the expected next hop, was it translated correctly, was it denied, and did the reply return? A packet capture proves only what was visible at that observation point during the capture window, so I would correlate it with routes, counters, and policy evidence instead of treating one capture as the whole diagnosis.

The key decision is to find the first point where observed traffic diverges from the expected path. In practice, the fault boundary lies between the last observation point where the traffic is correct and the first observation point where it is missing, denied, incorrectly translated, or sent on an unexpected path. I would stop widening the investigation once that boundary is isolated and test specific hypotheses there.

Typical hypotheses include a wrong route or next hop, blackholed route, ACL or firewall denial, missing or incorrect NAT, VLAN or trunk mismatch, interface errors or drops, neighbor-resolution failure, MTU or fragmentation problems, asymmetric routing, or a policy or security-group issue. I would mark each hypothesis as confirmed or rejected using evidence rather than changing configuration to see what happens.

Once the cause is confirmed, I would make the smallest safe correction. I would document the before-and-after state, then rerun the same end-to-end and boundary tests. Verification means confirming that the intended service traffic succeeds, the forward and return paths are correct, NAT and security policies behave as expected, packet loss or drops at the faulty boundary are gone, and relevant counters and logs remain healthy. If the incident exposed an observability gap, I would add focused monitoring, alerts, dashboards, or runbook guidance so the same type of failure can be isolated faster next time.

Technical Approach
  1. Define the source, destination, protocol, port, and expected forward and return paths.
  2. Mark each meaningful observation boundary: gateway, router, firewall, NAT point, switch, VLAN, and destination.
  3. Preserve evidence before changing configuration.
  4. At each boundary, compare the routing decision with the expected next hop.
  5. Where NAT exists, inspect translation state and verify forward and return mappings.
  6. Check firewall, ACL, policy, and relevant hit or drop counters.
  7. Check interface receive/transmit counters, errors, drops, discards, and ARP or neighbor state.
  8. Run hop-by-hop reachability tests, remembering that blocked ICMP does not by itself prove a network failure.
  9. Test the actual destination port when appropriate.
  10. If needed, take short filtered packet captures on both sides of the suspected boundary.
  11. Compare expected versus observed behavior in both directions and find the first divergence.
  12. Treat the space between the last correct observation point and first incorrect observation point as the fault boundary.
  13. Test specific hypotheses inside that boundary and reject those contradicted by evidence.
  14. Apply the smallest confirmed correction.
  15. Repeat the same forward, return, and end-to-end tests and monitor counters and logs to verify recovery.
Practical Insights

The main cost is engineer time and the amount of evidence collected. More network boundaries mean more tests. Routing tables, counters, and policy hit counts are usually inexpensive to inspect, but they may show only symptoms. Packet captures provide deeper evidence but can consume CPU, storage, and analysis time, so they should use narrow filters and short capture windows. Large routing, NAT, firewall, or flow datasets should be filtered to the affected connection. Operationally, this method is safer because it avoids changing several devices at once and reduces the chance of creating a second problem while diagnosing the first.

Why Interviewers Ask This

This question tests whether the candidate can troubleshoot partial network reachability systematically instead of guessing. A strong answer shows understanding of forward and return paths, routing, address translation, firewalls and ACLs, interface counters, packet captures, neighbor state, and hop-by-hop testing. It also tests operational judgment: collect evidence before changes, identify the first divergence, distinguish evidence from hypotheses, make the smallest safe correction, and verify that both directions remain healthy.

Common interview mistakes

Common mistakes are changing routes or firewall rules before collecting evidence; checking only the forward path and ignoring the return path; assuming failed ping or traceroute proves the exact fault; looking only at routes while ignoring NAT, ACLs, firewall policy, neighbor state, VLANs, and interface counters; taking broad packet captures instead of short filtered ones; treating one counter or capture as proof without correlation; changing several components at once; continuing past the first confirmed divergence instead of narrowing that boundary; and declaring success after one test without verifying the return path and relevant counters or logs.

Interview tip

Anchor the answer around one rule: find the last point where traffic is correct and the first point where it is not. Explain how routes, NAT, security controls, interface counters, neighbor state, packet captures, and hop-by-hop tests provide evidence at successive boundaries. Emphasize both directions, no configuration changes before isolation, the smallest confirmed fix, and verification with the same tests afterward.

Interviewer may ask next
What would you do if traceroute stops at a firewall, but you are not sure whether the firewall is actually dropping the application traffic?

I would not treat the traceroute result as proof because the firewall may filter or rate-limit ICMP or traceroute traffic while allowing the application flow. I would test the actual destination protocol and port, inspect the applicable firewall or ACL policy and its hit or drop counters, verify any NAT state, and use short filtered captures on the ingress and egress sides if needed. If the application packets arrive at the firewall but do not leave toward the expected next hop and the policy evidence explains the drop, that boundary is confirmed. If the packets leave correctly, I would continue to the next observation point.

How would asymmetric routing change your troubleshooting approach?

I would map the forward and return paths independently instead of assuming they are identical. I would inspect routing decisions from both directions and correlate them with packet captures or flow evidence at the relevant boundaries. Asymmetric routing is not automatically wrong, but it can break stateful firewalls or NAT if the reply bypasses the device holding connection or translation state. I would locate where the return path diverges, determine whether that asymmetry is intended, and change routing only if the observed path conflicts with the design or prevents the stateful flow from completing.

10. You are on-call and the Shakespeare black-box probe has returned no search results for five minutes. How would you respond?ObservabilityHardGoogle

Question Details

Establish user impact, scope, and last-known-good time; compare black-box and internal signals; test representative queries; inspect the serving path, dependencies, index freshness, and recent changes; choose a reversible mitigation; communicate status; and define the evidence required for recovery, root cause, and prevention.

Short Interview Answer (30-60 seconds)

I would establish impact, scope, and the last-known-good time; compare the failed probe with internal evidence; run representative queries; isolate the serving boundary; test one evidence-backed hypothesis; apply only a justified reversible mitigation; then verify recovery, communicate status, and preserve evidence for root cause and prevention.

Detailed Explanation

The first goal is to learn whether people are actually unable to get search results or whether only the automatic check is failing. I would find out how widespread the problem is, when search last worked, and whether different searches behave the same way. Before changing anything, I would compare what the outside check sees with what the service itself reports. I would follow the request through the serving path, look for the smallest place where behavior changes, test one likely explanation, make a safe reversible change only when justified, and confirm normal results return.

Useful Questions to Ask the Interviewer
  1. Is the black-box probe failure the only known symptom, or are users also receiving no search results?
  2. Is the issue global or limited to a region, traffic segment, or query type?
  3. When was the last-known-good probe and representative search?
  4. Were there recent deployments, configuration changes, index or data changes, dependency incidents, or other operational changes near that time?
  5. What internal service signals and request-correlation evidence are available?
You are on-call and the Shakespeare black-box probe has returned no search results for five minutes. How would you respond? diagram
How to Explain It in an Interview
1. Establish impact, scope, and last-known-good time

The black-box probe is an external check of user-visible behavior. Its failure confirms a symptom, not a root cause. I first determine whether users are also getting no search results, which regions or traffic segments are affected, whether every query fails, and when the system was last known to behave correctly.

For the user-visible objective, I would use the smallest useful set of signals: the black-box result plus internal evidence that shows whether real search requests are succeeding and returning usable results. If the service has an SLI, or service-level indicator, for successful useful searches and an SLO, or service-level objective, for its expected reliability, I use those to understand impact. I do not treat a single probe result as proof of a global outage.

2. Compare black-box and internal evidence

Next I compare the external symptom with internal service evidence. I look for whether internal requests are succeeding, whether they return expected results, and whether latency or error behavior changed around the last-known-good time. Where available, I correlate structured logs, metrics, traces, health signals, deployment or configuration history, and request identifiers.

Each signal answers a different question. Metrics show aggregated behavior. Logs record discrete events and context. Traces show how a request moves across instrumented boundaries. Health signals show whether components are available. No single signal proves the root cause by itself, so I correlate evidence before making a diagnosis.

Observability also has limits. Sampled traces can miss a failing request. Aggregated metrics can hide a failure affecting only one query type. High-cardinality attributes increase ingestion and storage cost. Short retention can remove older comparison data. Missing telemetry or clock skew can make correlation difficult. Credentials, tokens, personal information, and sensitive search payloads should be redacted or avoided.

3. Run representative queries

I run a small set of representative searches through the normal path. I compare their behavior with the black-box probe and capture correlation information when available. The goal is to determine whether the failure affects all searches or only particular queries, users, regions, or conditions.

If representative searches work while the probe fails, the fault boundary may be specific to the probe or its path. If both fail in the same way, I continue deeper into the serving path. I keep the test set small so diagnosis does not create unnecessary production load.

4. Isolate the smallest affected boundary

I trace the request through generic boundaries consistent with the diagram: client, edge, serving path, search or index, and data. I do not assume a particular implementation such as a specific gateway, CDN, database, or vendor product unless the environment confirms it.

At each boundary I ask whether the request arrived, whether processing completed, and whether the next boundary returned usable data. I specifically inspect dependencies, index or data freshness, data flow, configuration, and recent changes. I compare the current state with the last-known-good state to identify what changed near the start of the incident.

5. Form and test one evidence-backed hypothesis

After narrowing the boundary, I form one hypothesis that explains the observed evidence. For example, evidence could suggest that the serving path is reachable but the search or index boundary is not returning expected data. That remains a hypothesis until a targeted test confirms it.

I test the hypothesis at the smallest affected boundary. If evidence disproves it, I reject it and form another hypothesis. I do not continue treating a rejected explanation as confirmed.

6. Mitigate safely

If user impact requires action, I choose the smallest reversible mitigation supported by the evidence. Depending on what the actual environment supports, that could be a rollback, failover, or reduction of traffic to an affected path. I would not perform one of these actions merely because it appears in a runbook; the current evidence must justify it.

The main tradeoff is restoration speed versus diagnostic certainty. During meaningful user impact, a reversible containment action may restore service before the complete root cause is known. However, an unnecessary change can add another failure or destroy useful evidence. I therefore prefer one controlled, reversible change at a time and record exactly what changed and when.

7. Verify recovery and communicate

After mitigation or correction, I verify from the user-visible side first. Representative searches should return results again, and the black-box symptom should clear. I then confirm that the relevant internal signals have recovered and that the previously affected boundary behaves normally.

I communicate current impact, what is known, what remains uncertain, actions taken, recovery evidence, and the next update. I do not declare recovery based on one successful request alone; I want enough repeated evidence to show that service behavior is stable.

8. Determine root cause and prevention from evidence

Recovery and root cause are separate milestones. After service is stable, I preserve the timeline, tests, changes, and correlated evidence. I then determine the primary cause, contributing factors, and any observability gaps.

Prevention should address the actual failure mechanism. Depending on the evidence, that might mean improving the user-visible SLI, creating a more actionable symptom-based alert, improving request correlation, adding visibility into index or data freshness, strengthening rollback procedures, testing the black-box probe against realistic failure conditions, or closing a telemetry gap. Alerts should have clear ownership, severity, runbook context, and noise controls so responders know what action to take.

Technical Approach
  1. Confirm the user-visible symptom and establish impact, scope, and last-known-good time.
  2. Compare the black-box failure with internal evidence and correlate request information.
  3. Run representative queries to determine whether the probe and real searches fail in the same way.
  4. Trace the path from client to edge, serving path, search or index, and data.
  5. Check dependencies, index or data freshness, data flow, configuration, and recent changes.
  6. Form one evidence-backed hypothesis and test it at the smallest affected boundary.
  7. If containment is necessary, choose the smallest justified reversible mitigation, such as rollback, failover, or reducing affected traffic when supported by the environment.
  8. Verify that search results return and relevant signals recover.
  9. Communicate status and preserve recovery evidence.
  10. Determine root cause, contributing factors, and prevention actions from the preserved evidence.
Practical Insights

The investigation gets more expensive as the number of affected regions, services, dependencies, query types, and telemetry sources grows. Representative queries should stay small so they do not add meaningful load. More logs and traces can make diagnosis easier but increase ingestion, storage, and query cost. High-cardinality attributes can be expensive, while sampling can miss rare failures. Longer retention helps compare current behavior with older healthy behavior but costs more storage. Operationally, narrowing the smallest boundary before changing anything reduces risk, and reversible actions are easier to validate and undo.

Why Interviewers Ask This

This question tests whether the candidate can respond methodically to an ambiguous production symptom without guessing. A strong DevOps Engineer should establish impact and scope, compare external and internal evidence, isolate the smallest faulty boundary, distinguish hypotheses from confirmed causes, choose a reversible mitigation, verify recovery, communicate clearly, and preserve evidence for root-cause analysis and prevention.

Common interview mistakes

Common mistakes are assuming the failed black-box probe proves the entire service is down; declaring a root cause before correlating evidence; checking only infrastructure health while ignoring application-level empty results; testing only one query; ignoring dependencies, index or data freshness, configuration, and recent changes; treating one metric, log, or trace as proof; forgetting sampling, cardinality, retention, missing telemetry, clock skew, and privacy limitations; performing rollback or failover without evidence; changing several things at once; declaring recovery after one successful request; and closing the incident without preserving evidence for root cause and prevention.

Interview tip

Present the response as a disciplined sequence: establish impact first, compare evidence before diagnosing, isolate the smallest boundary, test one hypothesis, choose only a justified reversible mitigation, and verify from both the user-visible and internal perspectives. Explicitly state that the failed probe is a symptom, not the root cause.

Interviewer may ask next
What would you do if the Shakespeare black-box probe still failed but representative user searches were returning correct results?

I would narrow the investigation toward the probe-specific path rather than assuming the search service is unavailable. I would compare the failed probe request with a successful representative request, including query shape, location, timing, response behavior, and available correlation information. I would inspect configuration and boundaries unique to the probe. I would continue watching user-visible service indicators because a successful manual query does not prove every user path is healthy. I would change the probe only after evidence shows that its behavior or configuration is the faulty boundary, then verify both the probe and representative user searches.

How would you decide whether to roll back a recent change before you have a confirmed root cause?

I would consider rollback when user impact is meaningful, timing and evidence strongly associate the recent change with the failure, the rollback is understood and reversible, and its risk is lower than leaving the incident active. I would preserve evidence before rollback and change only one thing at a time. Afterward I would verify that representative searches return results and relevant internal signals recover. A successful rollback is strong evidence that the change is related, but it does not by itself explain the exact failure mechanism or every contributing factor.

More questions load as you scroll

Disclaimer: This interview guide is for educational and informational purposes only. It is designed to help readers prepare, but it does not guarantee any interview result, hiring decision, offer, or outcome. Interview questions, hiring criteria, and preferred answers can vary by employer, interviewer, industry, location, and time. The examples and explanations reflect the authors' research and judgment, are provided without warranties of any kind, and should not be treated as the only correct approach. Diagrams are simplified illustrations intended to highlight the main components and their interactions; actual systems and implementations may be more complex. Alternative approaches may be equally valid or better suited to a particular question, context, or interviewer. To the fullest extent permitted by applicable law, the author, contributors, and publisher are not liable for decisions made, actions taken, or losses incurred based on this guide.

Company Notice: This guide is an independent educational resource and is not affiliated with, endorsed by, sponsored by, or approved by the company named in this guide. Company names are used only to identify interview experiences commonly reported by candidates. Interview practices can change without notice, and inclusion of company-specific content does not mean these questions are official, complete, or guaranteed to be asked. To the fullest extent permitted by law, the author, contributors, and publisher are not responsible for outcomes related to use of this material.

Content Accuracy and Verification: To the fullest extent permitted by applicable law, we do not represent or warrant that interview guides, questions, answers, examples, or diagrams are accurate, complete, current, error-free, or suitable for any particular purpose. You are responsible for independently reviewing and verifying the information before relying on it.