This interview guide is for educational and informational purposes only. It is designed to help readers prepare, but it does not guarantee any interview result, hiring decision, offer, or outcome. Interview questions, hiring criteria, and preferred answers can vary by employer, interviewer, industry, location, and time. All answers, examples, and explanations in this guide are suggested examples for interview preparation, not definitive answers or instructions for professional practice. They are based on research and judgment, are provided without warranties of any kind, and should be adapted to the question, role, and applicable laws and professional requirements. Diagrams are simplified illustrations intended to highlight the main concepts and their relationships; actual situations, systems, and practices may be more complex. Alternative approaches may be equally valid or better suited to a particular question, context, or interviewer. To the fullest extent permitted by applicable law, the contributors and publisher are not liable for decisions made, actions taken, or losses incurred based on this guide.
State Laws and Professional Responsibilities
Laws and requirements governing an occupation vary by state and jurisdiction. You are responsible for checking the current laws, licensing requirements, and scope-of-practice rules that apply to your location and role, and for ensuring that your answers and actions comply with them. Adapt examples in this guide to those requirements. This guide is not legal advice.
Identity, Image, and Privacy Notice
To respect individual privacy, some names, profile photographs, avatars, biographical details, and other identifying information displayed in this guide may be replaced with pseudonyms, licensed stock images, illustrative avatars, composite images, or representative descriptions. Unless a person is expressly identified as an actual contributor, a displayed name, image, or profile should not be understood as depicting or identifying a specific candidate, interviewer, employee, or other real individual. These representations are provided for editorial and illustrative purposes only and do not imply endorsement, employment, participation, or affiliation with this guide or any company mentioned in it. Any resemblance to an actual person is coincidental.
Company Notice
This guide is an independent educational resource and is not affiliated with, endorsed by, sponsored by, or approved by the company named in this guide. Company names identify reported interview experiences or the employer context of clearly labeled original practice exercises. Interview practices can change without notice, and inclusion of company-specific content does not mean these questions are official, complete, or guaranteed to be asked. To the fullest extent permitted by law, the author, contributors, and publisher are not responsible for outcomes related to use of this material.
Content Accuracy and Verification
To the fullest extent permitted by applicable law, we do not represent or warrant that interview guides, questions, answers, examples, or diagrams are accurate, complete, current, error-free, or suitable for any particular purpose. You are responsible for independently reviewing and verifying the information before relying on it.
Questions or comments?
Contact us for general questions, or share feedback, technical corrections, and comments with the community.
A client needs to reach a service by hostname. Trace the provider-neutral resolution path from the local stub resolver through caches and recursive lookup to an authoritative answer. Cover A, AAAA, CNAME, and negative responses; TTL behavior; what the client observes when an answer is stale or unavailable; and the evidence that separates a DNS failure from a later TCP, TLS, or application failure.
Short Interview Answer (30-60 seconds)
At a high level, DNS turns a hostname into the address a client needs to reach a service. The main challenge is getting that answer quickly while handling cached, expired, missing, and failed lookups correctly. I would explain three flows: the local cache path, the recursive lookup path, and the failure path. A and AAAA return IP addresses, while CNAME points to another name. Caching makes lookups faster, but expired entries can make the client wait for a fresh answer.
Detailed Explanation
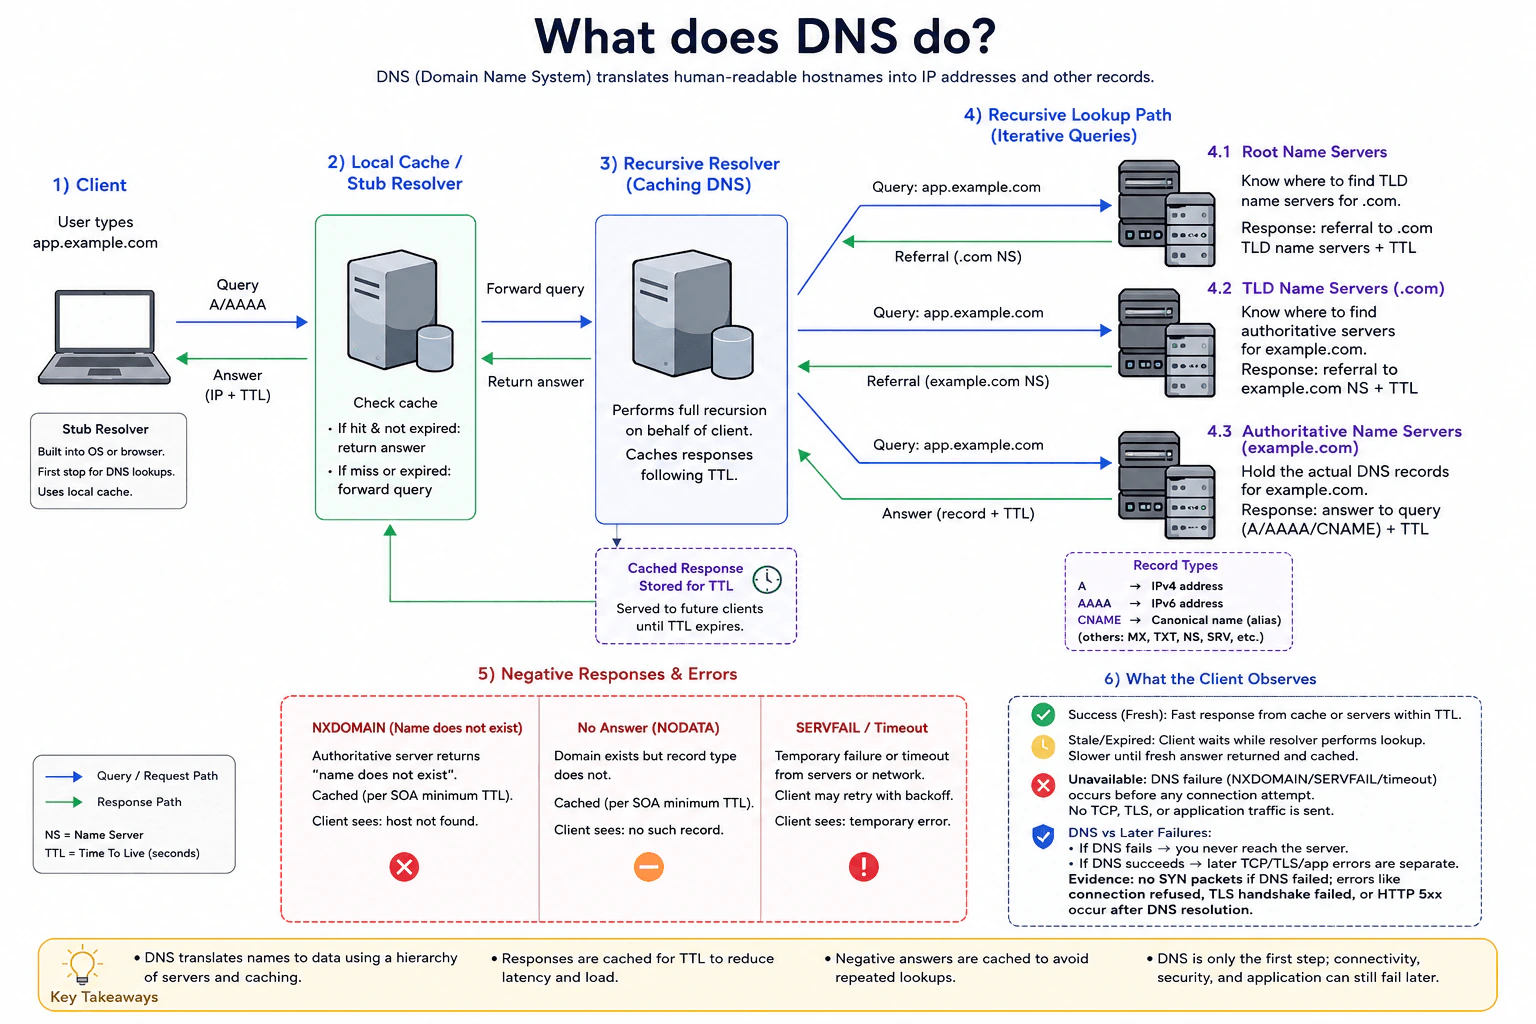
DNS helps a client find a service when it only knows a hostname, such as app.example.com. The client needs an address before it can start the network connection. The answer may already be cached, or the resolver may need to ask several DNS servers. The diagram organizes this into the client and local cache, the recursive lookup through the DNS hierarchy, and the result or failure the client sees. It also shows how cached answers expire and how DNS failures differ from later connection failures.
Useful Questions to Ask the Interviewer
Should I explain both IPv4 and IPv6 results?
Should I include CNAME handling and negative DNS answers?
Should I separate DNS, TCP, TLS, and application failures?
How to Explain It in an Interview
1. Start with the client and local cache
I would start with the client because DNS happens before the service connection. The client asks its stub resolver to find app.example.com with an A or AAAA lookup. An A record gives an IPv4 address. An AAAA record gives an IPv6 address.
The stub resolver checks its local cache first. If it has a valid answer and the TTL has not expired, it returns that answer quickly. TTL means Time To Live, which tells a cache how long it may keep a DNS result. If the answer is missing or expired, the query goes to a Recursive Resolver.
2. Follow the recursive lookup
The Recursive Resolver performs the lookup for the client and caches responses for their TTL. For a fresh lookup, it asks a Root Name Server about app.example.com. The root returns a referral to the .com name servers.
The resolver then asks a TLD Name Server for .com. TLD means top-level domain. That server returns a referral to the name servers for example.com.
3. Get the answer from the domain
The resolver next asks the Authoritative Name Servers for example.com. These servers hold the DNS records for that domain and return the requested record with its TTL.
A records contain IPv4 addresses. AAAA records contain IPv6 addresses. A CNAME is an alias pointing to another hostname, so the resolver follows that name until it gets the needed address record. It caches the response and returns the answer toward the client.
4. Handle expired and negative answers
A fresh cache hit is fast. If the cached entry has expired, the resolver performs a new lookup, so the client may wait longer.
NXDOMAIN means the requested name does not exist. NODATA means the name exists, but the requested record type does not. The diagram shows negative answers being cached using the zone's SOA information. SERVFAIL or a timeout means resolution failed temporarily.
5. Separate DNS from later failures
I would finish by checking failures in order. If DNS fails, the client does not get the address needed for a connection, so TCP, TLS, and application traffic do not begin.
If DNS succeeds but the connection is refused or times out, the problem is later in the TCP path. If TCP works but the secure handshake or certificate check fails, it is a TLS problem. If DNS, TCP, and TLS succeed but the server returns an HTTP 4xx or 5xx response, the problem is at the application layer.
Practical Complexity & Trade-offs
The benefit of caching is speed. The client and Recursive Resolver can reuse a DNS answer while its TTL is still valid, so fewer upstream lookups are needed. The downside is freshness. A cached value can remain in use until its TTL expires, so record changes may not be visible everywhere at once. After expiration, the client may wait while the resolver gets a fresh answer. Negative answers can also be cached, which avoids repeated lookups for missing names or record types. DNS only finds the destination. A successful DNS answer does not guarantee that TCP, TLS, or the application will work.
Why Interviewers Ask This
Interviewers ask this to see whether you understand what happens before a client connects to a service. They want you to trace the lookup through caches, the Recursive Resolver, Root Name Servers, TLD Name Servers, and Authoritative Name Servers. They also want clear reasoning about TTLs, A, AAAA, CNAME, negative responses, and failures. A strong answer separates DNS problems from later TCP, TLS, and application problems.
Interviewer may ask next
What happens if the DNS record changes while some clients still have the old answer cached?
I would keep the same DNS flow and focus on TTL behavior. A client or Recursive Resolver may continue using an old cached answer while that answer's TTL is still valid. Changing the record on the Authoritative Name Servers does not instantly remove every cached copy.
When each cached entry expires, the next lookup can go back through the resolver and obtain the newer record. Different clients can therefore see the change at different times because their cached entries may have different remaining TTL values.
If an entry is already expired, it should not be treated as a normal valid cache hit in the flow shown here. The resolver performs a fresh lookup, and the client may wait longer while that answer is fetched and cached again.
The main downside is the speed-versus-freshness trade-off. Longer TTLs reduce DNS lookup work, but old answers may remain visible longer. Shorter TTLs make changes appear sooner, but they cause more recursive lookups.
How would you prove that an outage is a DNS failure instead of a TCP, TLS, or application failure?
I would test the layers in the same order as the diagram. First, I would check whether the hostname resolves. If the lookup returns NXDOMAIN, SERVFAIL, or a timeout without the needed address, the evidence points to DNS. The client cannot start the later connection because it has no destination address.
If DNS returns an address, I would test TCP next. A connection refusal or connection timeout after successful DNS points to the network path or listening service instead of DNS.
If TCP connects but the secure handshake or certificate check fails, I would investigate TLS. If TLS succeeds and the server then returns an HTTP 4xx or 5xx response, DNS has already succeeded and the failure is at the application layer.
The main complication is caching. One client may have a valid cached answer while another client performs a fresh lookup, so comparing DNS results and TTL state helps explain why symptoms differ.
2. Why can TCP congestion control become a production problem?Cloud InfrastructureMediumMeta
i Question Details
A distributed service uses long-distance TCP connections and sees unstable throughput and tail latency despite available endpoint CPU. Explain how slow start, congestion windows, loss or ECN signals, retransmission, round-trip time, buffer growth, and competing flows can affect the connection. Define the packet, socket, and application measurements needed before changing algorithms, buffers, or topology.
Short Interview Answer (30-60 seconds)
At a high level, TCP can become a production problem because it changes its sending rate based on network feedback, not endpoint CPU. Long RTT makes window growth and recovery slower. I would explain three things: how the congestion window grows, how loss or ECN causes backoff and retransmission, and what packet, socket, and application measurements we need before tuning. The main trade-off is that larger buffers may reduce early drops but can create queueing delay and worse tail latency.
Detailed Explanation
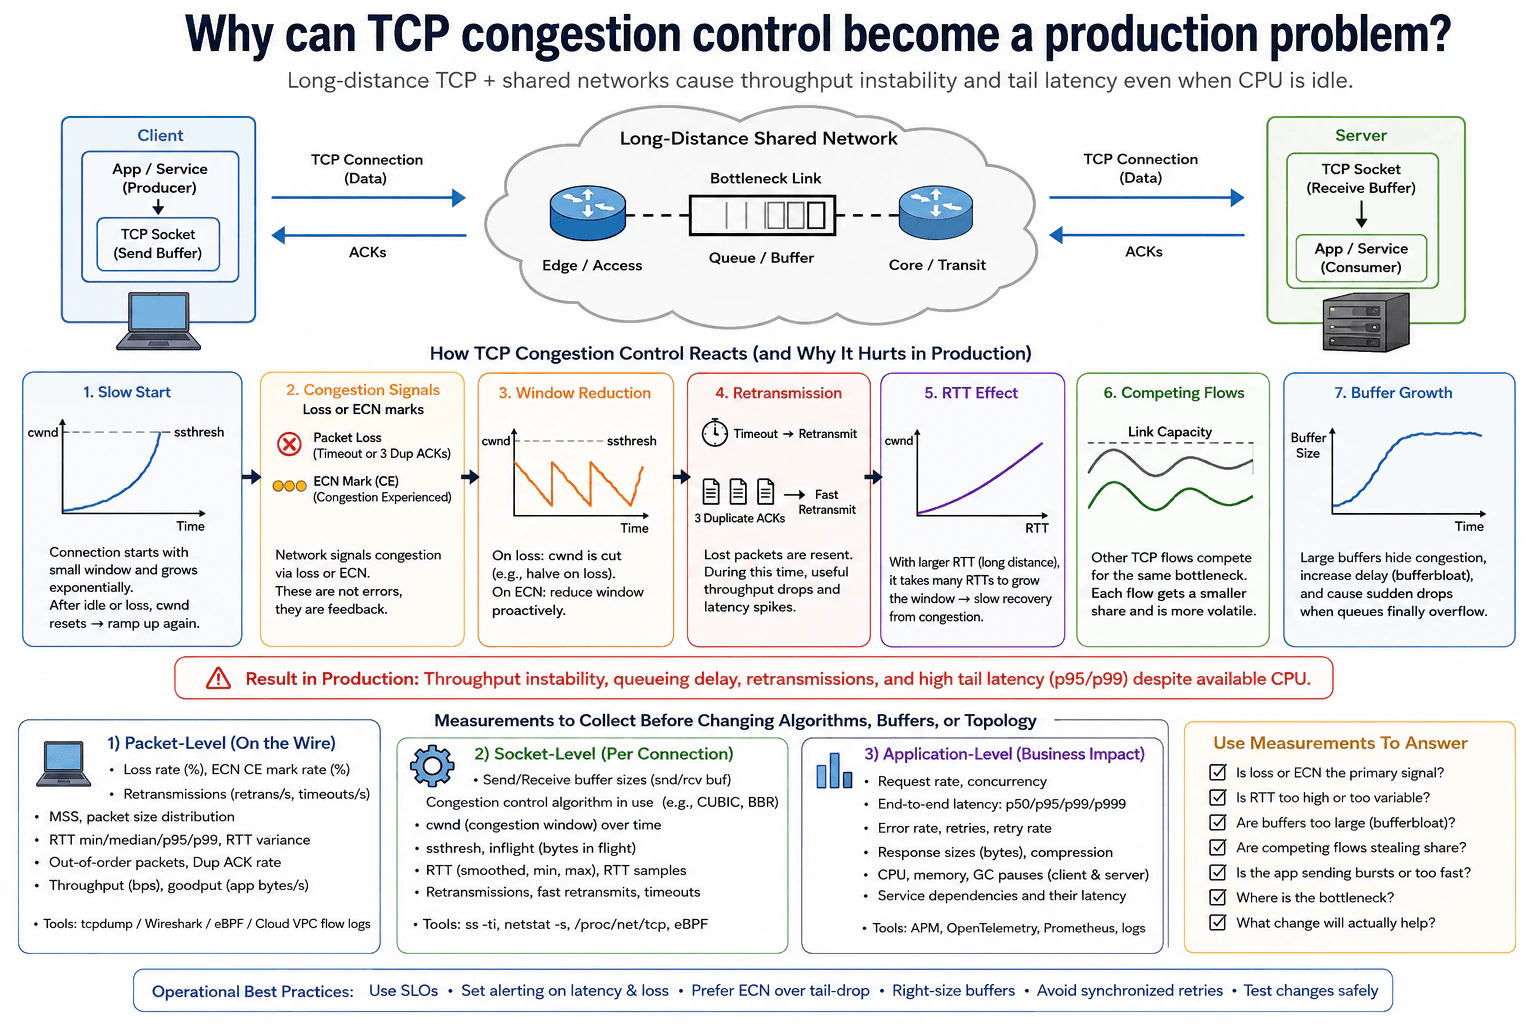
The service must move data reliably across long-distance TCP connections while keeping response times stable. The difficult part is that free CPU does not prove the network is healthy. Packets can wait at a bottleneck, compete with other flows, or be lost. TCP reacts by changing how much data it allows in flight. Those reactions can make useful data speed rise and fall. They can also increase p95 and p99 latency. I would explain the connection behavior first, then its production effects, and finally the measurements needed before changing algorithms, buffers, or topology.
Useful Questions to Ask the Interviewer
Is packet loss or an ECN mark the main congestion signal?
How large and variable is the round-trip time?
Do queues grow when tail latency rises?
Are many TCP flows sharing the same bottleneck?
Does the application send traffic in large bursts?
Where is the bottleneck on the network path?
How to Explain It in an Interview
1. Start with the end-to-end connection
The client application writes data into its TCP send buffer. TCP sends packets across the long-distance shared network and through a bottleneck queue. The server receives them through its TCP receive buffer. ACKs travel back to confirm received data. The connection can therefore be slow even when both endpoints have spare CPU.
2. Explain slow start and the congestion window
TCP starts with a limited congestion window, or cwnd. This controls how much unacknowledged data may be in flight. During slow start, cwnd grows quickly as ACKs return. A larger RTT means each feedback round takes longer. The connection therefore takes more time to grow its window and more time to recover after congestion.
3. Explain congestion signals and retransmission
Packet loss and ECN can tell TCP that the path is congested. ECN means Explicit Congestion Notification and can signal congestion without dropping the packet. TCP responds by reducing cwnd. Packet loss may also require retransmission. A timeout can trigger retransmission, while duplicate ACKs can trigger fast retransmit. During this period, useful data speed falls and application latency can spike.
4. Explain competing flows and buffer growth
Other TCP flows may compete for the same bottleneck capacity. Each connection can receive a changing share, so its speed becomes more variable. Large buffers can delay packet drops by holding more packets. The downside is bufferbloat, which means packets spend too long waiting in queues. If a full queue later overflows, losses can arrive in bursts and make recovery more painful.
5. Measure before changing anything
At packet level, I would measure loss rate, ECN CE mark rate, retransmissions, MSS and packet sizes, RTT distribution and variance, duplicate ACKs, reordering, throughput, and goodput. At socket level, I would inspect send and receive buffers, the congestion-control algorithm, cwnd over time, ssthresh, bytes in flight, RTT samples, retransmissions, fast retransmits, and timeouts. At application level, I would measure request rate, concurrency, p50 through p999 latency, errors, retries, response sizes, compression, CPU, memory, GC pauses, and dependency latency. Only then would I test changes such as ECN use, buffer sizing, congestion-control settings, or network topology.
Practical Complexity & Trade-offs
The benefit of TCP congestion control is that it protects a shared network from too much traffic. The downside is that its feedback loop can make production performance unstable. Long RTT makes window growth and recovery slower. Loss can reduce the congestion window and force retransmissions. Competing flows can change how much link capacity one connection receives. Larger buffers may prevent an early drop, but they can also create bufferbloat and long queueing delay. I would not tune from one metric. I would compare packet, socket, and application measurements, change one thing at a time, and measure again against latency and loss SLOs.
Why Interviewers Ask This
The interviewer wants to see whether you can distinguish a network problem from an endpoint CPU problem. They also want to know whether you understand TCP feedback, RTT, congestion windows, loss, ECN, retransmissions, queues, and competing flows. Most importantly, they are testing production judgment. A strong candidate measures the packet path, socket state, and application impact before changing congestion algorithms, buffer sizes, or topology.
Interviewer may ask next
What would you do if packet loss stays low, but p99 latency becomes very high as traffic increases?
I would first check whether the bottleneck queue is growing. Low packet loss does not mean the path is healthy. A large buffer can keep accepting packets instead of dropping them, so packets spend more time waiting. That is bufferbloat.
I would compare packet RTT with the application's p99 latency. At packet level, I would look at RTT percentiles, RTT variance, loss, ECN marks, duplicate ACKs, and retransmissions. At socket level, I would inspect cwnd, bytes in flight, socket RTT, send and receive buffers, and retransmission counters. At application level, I would compare request concurrency with p95, p99, and p999 latency.
If RTT rises as traffic rises while loss remains low, queue growth is a strong signal. I would also check whether competing flows or application bursts are filling the bottleneck. I would then test buffer changes carefully and measure the result again. The downside of smaller buffers is that packets can be dropped sooner, so I must validate both latency and useful data speed.
How would your diagnosis change if many TCP connections start competing for the same bottleneck link?
I would focus more on per-connection measurements because the shared bottleneck can divide capacity differently over time. One connection may slow down even when the total link is still carrying a lot of traffic. That can create unstable throughput and tail latency without an endpoint CPU problem.
At packet level, I would compare loss, ECN marks, RTT, duplicate ACKs, retransmissions, throughput, and goodput while the number of competing flows changes. At socket level, I would compare cwnd, ssthresh, bytes in flight, RTT, retransmissions, and the congestion-control algorithm for several connections. At application level, I would check whether p95, p99, and p999 latency rise as concurrency increases.
I would also look for synchronized bursts or retries because several connections can fill the queue together. These measurements tell me whether shared-link competition is the main cause before I change TCP settings or topology. The downside is that per-flow analysis creates more data and requires careful correlation across packet, socket, and application measurements.
3. How would you design global load balancing for billions of requests per second with p99 latency below 100 ms and no external CDN?Cloud InfrastructureHardMeta
i Question Details
Design the authoritative traffic-steering and regional request path across Meta-operated edge and compute locations. Cover client mapping, anycast or DNS choices, health and capacity signals, connection termination, regional and zonal balancing, overload shedding, configuration propagation, stateful dependencies, failover authority, route convergence, tail-latency control, DDoS resistance, observability, and recovery from a bad global policy without creating a simultaneous worldwide failure.
Short Interview Answer (30-60 seconds)
At a high level, the goal is to send huge global traffic to a healthy region while keeping p99 latency below 100 ms. The hard part is making fast local decisions without one global failure taking everything down. I would explain three flows: client mapping, edge and region selection, then regional processing and recovery. Authoritative DNS returns a Service VIP, Meta-operated Anycast edge handles the request, and the REGION SELECTOR chooses one eligible region. The trade-off is that safer global changes and reroutes can take time to converge.
Detailed Explanation
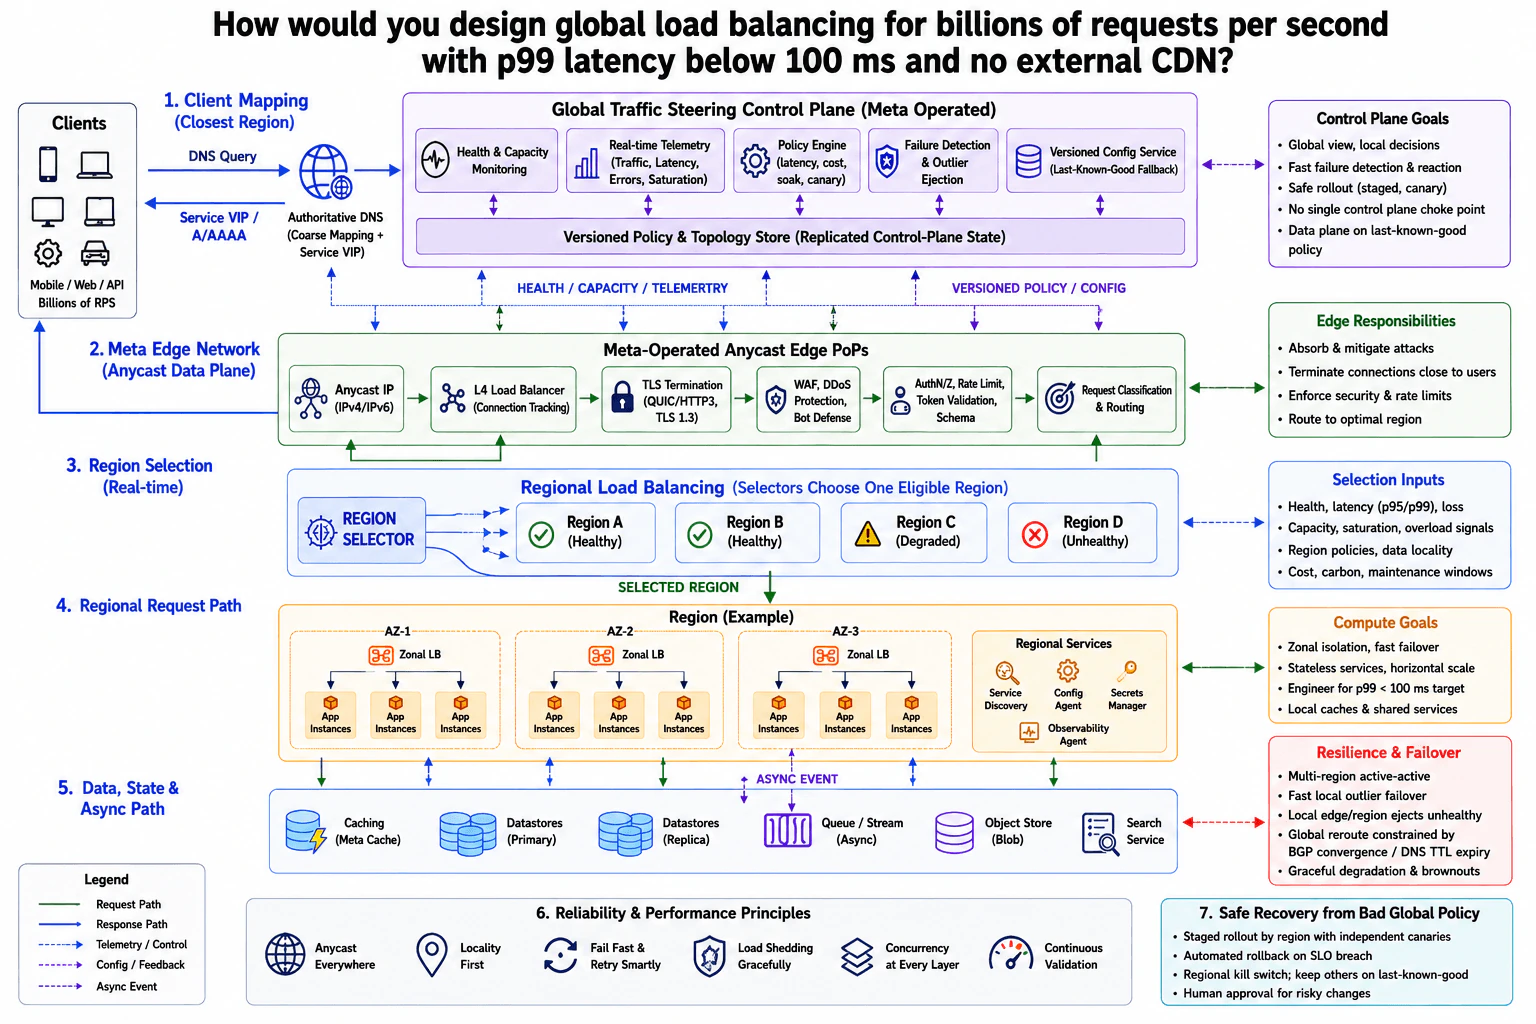
The system must send each user request to a nearby healthy place that still has room to serve it. It must do this very quickly, even when traffic is huge or one location has problems. Meta operates the edge itself, so the design cannot depend on an outside CDN. The diagram separates the problem into client mapping, edge processing, region selection, regional and zonal balancing, shared data services, and safe global control. It also keeps local serving independent enough that one bad policy or control-plane problem does not stop the whole world.
Useful Questions to Ask the Interviewer
Should different services use different region-selection policies?
How long may an edge continue using its last-known-good policy?
Which requests may be shed or handled with brownouts during overload?
How to Explain It in an Interview
1. Map the client to the Meta-operated edge
I would start by getting the client onto the edge quickly. The client sends a DNS Query to Authoritative DNS. DNS returns a Service VIP using A or AAAA records.
The client sends traffic to that Anycast IP. Anycast means many edge locations advertise the same service address. The network therefore brings the request toward a nearby reachable Meta-operated edge location.
2. Protect and classify the request at the edge
The request first reaches the L4 Load Balancer, which handles connection tracking. TLS Termination then ends the encrypted connection using the protocols shown in the diagram. WAF, DDoS Protection, and Bot Defense filter harmful traffic.
AuthN/Z, Rate Limit, Token Validation, and Schema checks protect the service. Request Classification & Routing then sends the request toward the REGION SELECTOR. These controls also help absorb attacks and shed excess work before it reaches regional compute.
3. Select one eligible region
The REGION SELECTOR chooses one region instead of broadcasting the request everywhere. It uses health, p95 and p99 latency, loss, capacity, overload signals, regional policy, data locality, cost, carbon, and maintenance information.
Healthy regions can receive traffic. Degraded or unhealthy regions can be avoided or ejected. The selected request then enters one regional request path.
4. Balance inside the selected region
Inside the region, Zonal LBs spread requests across App Instances in AZ-1, AZ-2, and AZ-3. The design uses stateless services and horizontal scaling. Zonal isolation limits the effect of a local failure.
Regional Services include Service Discovery, Config Agent, Secrets Manager, and Observability Agent. Applications use Caching, Datastores Primary, Datastores Replica, Object Store, and Search Service. An ASYNC EVENT can go to Queue / Stream so background work does not block the main response.
5. Control latency, overload, failures, and global changes
The Global Traffic Steering Control Plane collects health, capacity, traffic, latency, errors, and saturation signals. Its Policy Engine, Failure Detection, and Outlier Ejection help keep bad destinations out of service. Versioned Policy & Topology Store keeps replicated control-plane state. Versioned Config Service provides a last-known-good fallback.
The data plane can continue using that last-known-good policy during control-plane trouble. Local outlier ejection reacts faster than a full global reroute. Global changes may still wait for BGP convergence or DNS TTL expiry.
For the p99 target, the design keeps work local, sheds load gracefully, uses concurrency at each layer, fails fast, retries carefully, and continuously validates behavior. Risky policy changes use regional canaries, automatic rollback on SLO breach, regional kill switches, and human approval. The main trade-off is safer failure isolation versus slower global convergence.
Practical Complexity & Trade-offs
The benefit is that most request decisions happen close to users. Anycast gives one service address across many Meta-operated edge locations. Local health checks and outlier ejection can react before a full global reroute finishes. The downside is that global routing changes are not instant. BGP convergence and DNS TTL expiry can delay some traffic movement. The control plane is also more complex because it must combine health, capacity, latency, policy, and configuration signals safely. We accept that complexity because the data plane can keep serving with its last-known-good policy. Regional canaries and kill switches reduce worldwide failure risk.
Why Interviewers Ask This
Interviewers use this question to test how you break a massive global traffic problem into clear layers. They want to see judgment about DNS, Anycast, edge security, regional selection, overload handling, zonal isolation, stateful dependencies, and safe configuration changes. They also want to know whether you can keep fast local decisions separate from slower global control while explaining the failure and latency trade-offs clearly.
Interviewer may ask next
What would you change if the Global Traffic Steering Control Plane became unavailable for several minutes?
I would keep the request-serving data plane running on its last-known-good policy. The edge should not need a live control-plane answer for every user request. That lets healthy edge locations and regions continue serving traffic while the control plane recovers.
Local health and outlier decisions should still work. An unhealthy target can be removed locally. Regional and zonal balancing can also continue with the policy they already have. I would stop risky global configuration changes until the control plane is healthy again.
When control service returns, Versioned Config Service and the Versioned Policy & Topology Store can resume sending updates. I would roll those updates out through independent regional canaries instead of changing the whole world together. The main downside is that some routing information may be old during the outage. A request may therefore use a less optimal region for a short time, but the serving path stays available.
How would the design react if one region became overloaded while it was still technically healthy?
I would treat overload as a routing signal before waiting for the region to fail. The Selection Inputs already include capacity, saturation, and overload signals. The REGION SELECTOR can use those signals to stop choosing a region that is running out of room.
At the Meta-operated edge, Rate Limit and Request Classification & Routing can reduce excessive work early. Inside the selected region, Zonal LBs continue spreading accepted requests across App Instances. Load Shedding Gracefully can reject or reduce work before the whole region becomes unstable.
The selector can choose another eligible region for new requests. A larger global reroute may still be limited by BGP convergence or DNS TTL expiry. The main downside is that aggressive shedding can reject useful requests too soon. I would therefore combine real health, latency, and capacity signals with continuous validation instead of reacting to one noisy measurement.
4. Explain containerization.Containers And KubernetesEasyMeta
i Question Details
Trace a Linux container from an image and runtime request to a running process. Explain the root filesystem and image layers, namespaces, cgroups, capabilities, devices, networking, and the shared host kernel. Distinguish process isolation from a virtual-machine boundary, and state what happens to writable data, logs, and the process when the container or host stops.
Short Interview Answer (30-60 seconds)
At a high level, containerization runs an application as an isolated process while sharing the host Linux kernel. The main challenge is giving that process separate filesystem, process, network, device, and resource views without creating a full virtual machine. I would explain it in three parts: building the layered image, creating the container through the runtime, and applying Linux isolation controls. The benefit is fast startup and high density. The trade-off is weaker isolation than a VM because containers share one kernel.
Detailed Explanation
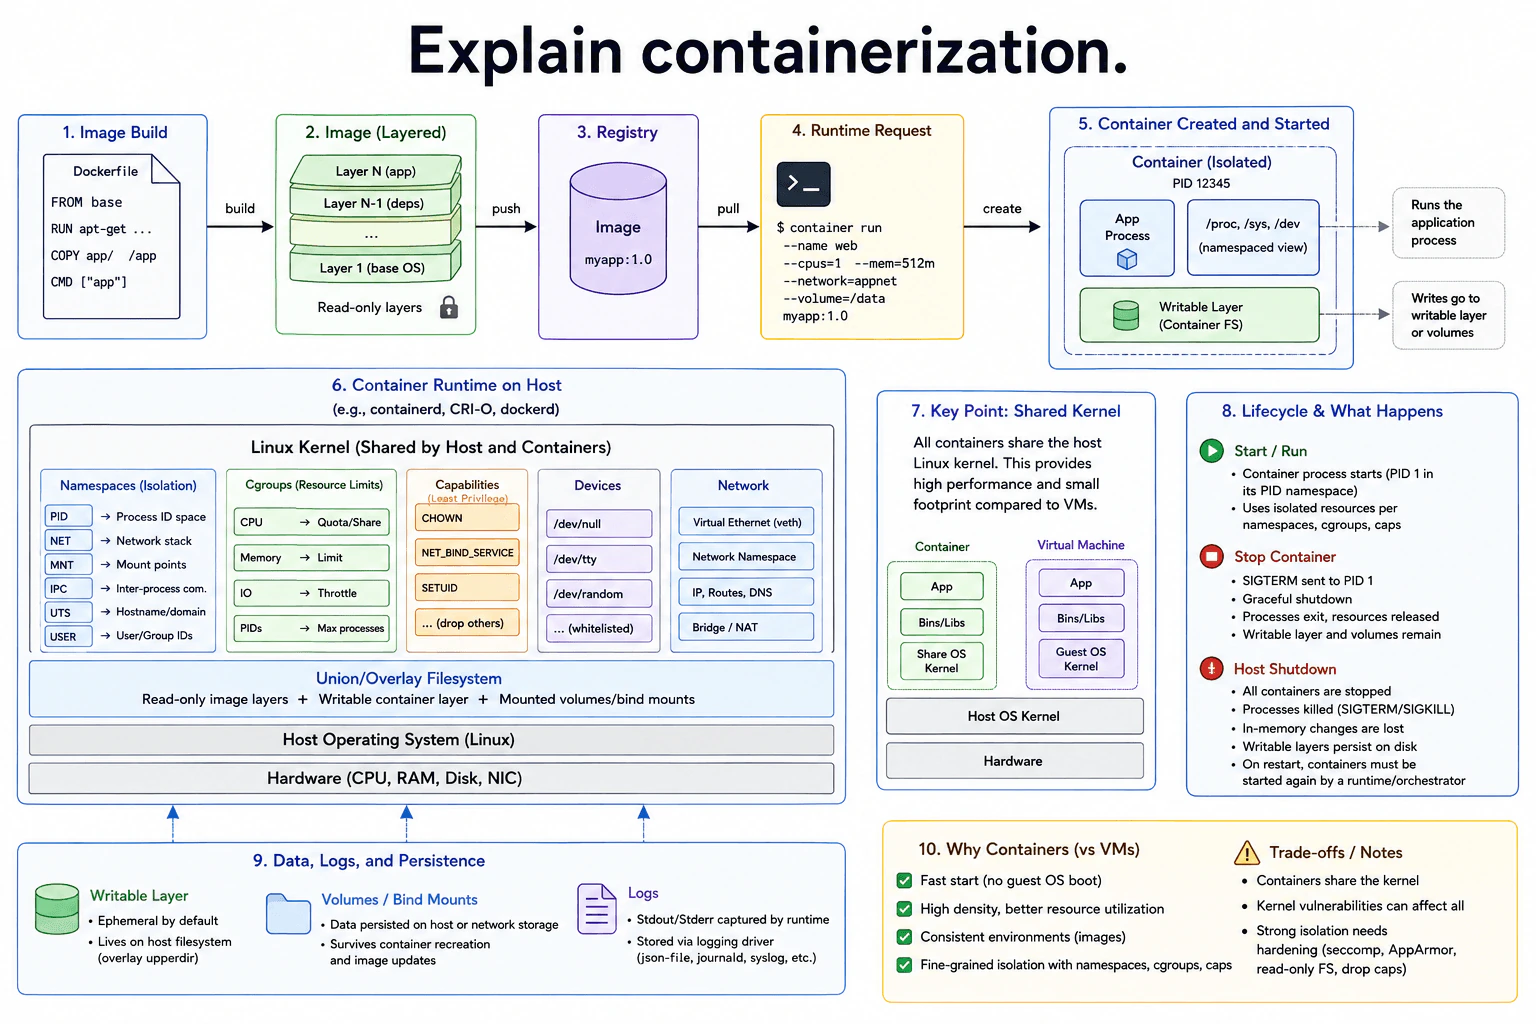
The goal is to package an application with the files it needs and run it in an isolated environment. The hard part is creating useful isolation without starting another complete operating system. A Linux container does this by giving the application separate views of processes, files, networking, devices, and resources while still using the host Linux kernel. The diagram follows this journey from image build to a running process. It then shows the isolation controls, filesystem behavior, networking, persistence, logging, and what happens when the container or host stops.
Useful Questions to Ask the Interviewer
Should I focus on Linux containers and the shared Linux kernel model?
Should I cover both container shutdown and full host shutdown?
Should I include volumes, writable layers, and runtime-managed logs?
How to Explain It in an Interview
1. Start with the layered image
I would start with the image because it provides the container's starting filesystem. A Dockerfile is built into several read-only layers. The lowest layer can contain base operating-system files. Higher layers add dependencies and the application. The image can then be pushed to a registry and pulled by another host.
The image layers remain read-only. This lets many containers start from the same packaged application.
2. Trace the runtime request
Next, a user sends a container run request. The example specifies CPU, memory, network, and volume settings. The container runtime pulls the image when needed, creates the container, and starts its application process.
The runtime adds a writable container layer above the read-only image layers. A union or overlay filesystem combines those layers into the container filesystem. Mounted volumes or bind mounts can also appear inside that filesystem while keeping their data outside the container's writable layer.
3. Explain Linux isolation controls
The application is still a Linux process. Namespaces give it separate views of process IDs, mount points, networking, IPC, host names, and user IDs.
Cgroups control resource use. They can set CPU shares or quotas, memory limits, I/O throttling, and maximum process counts. Capabilities split powerful Linux privileges into smaller permissions. The runtime can drop most capabilities and keep only required ones, such as NET_BIND_SERVICE. Device access can also be limited to approved device files under /dev.
4. Explain container networking and the shared kernel
For networking, the container can receive a virtual Ethernet interface, called a veth, inside its network namespace. It has its own IP settings, routes, and DNS view. A bridge and NAT can connect that isolated network to the host network.
The most important boundary is the shared Linux kernel. Containers do not boot their own kernel. This makes them lightweight and fast to start. A virtual machine normally has its own guest operating system and kernel, so its isolation boundary is stronger.
5. Explain data, logs, and lifecycle
When the container stops normally, its main process receives SIGTERM and gets time for graceful shutdown. Its processes then exit and their memory is released. The writable container layer can remain while that container still exists, but it is not the right place for important long-term data.
Volumes or bind mounts keep data outside that writable layer and can survive container recreation. Standard output and standard error can be captured by the runtime and stored through its logging driver.
If the host shuts down, all container processes stop because the shared kernel stops. In-memory changes disappear. Writable layers stored on the host disk can remain after an ordinary shutdown, and mounted-volume data can also survive when its storage remains available. After restart, the runtime or an orchestrator must start the containers again.
Practical Complexity & Trade-offs
The benefit is that containers start quickly because they do not boot a guest operating system. They also use fewer resources, so one host can run many isolated application processes. Read-only image layers make the same package easy to reuse. The downside is that every container shares the host kernel. A kernel security problem can therefore affect several containers. Namespaces, cgroups, capabilities, device restrictions, read-only filesystems, and security profiles reduce this risk. Storage also needs care. The writable container layer is useful for temporary changes, but important data should normally go to a volume or bind mount.
Why Interviewers Ask This
Interviewers ask this to see whether you understand what a container really is. They want to hear that it is an isolated Linux process, not a small virtual machine. They also check whether you can connect image layers, namespaces, cgroups, privileges, networking, storage, logs, and shutdown behavior. A strong answer explains both the efficiency benefit and the shared-kernel security trade-off.
Interviewer may ask next
What would you change if the application must keep important data after containers are removed and recreated?
I would keep the same container design, but I would move important data out of the writable container layer. That layer is useful for temporary filesystem changes, but it belongs to the container and should not be treated as durable application storage.
I would use a volume or bind mount, as shown in the diagram. The application would still see the mounted path inside its container filesystem, but the actual data would live outside the writable container layer. A replacement container could then mount that same stored data after the original container is removed.
The read-only image layers would not change. They would still provide the application and dependencies. Logs could also continue going through stdout and stderr to the runtime logging driver instead of being kept only inside the container filesystem.
The downside is extra storage management. We now need to manage permissions, backups, capacity, and the lifecycle of that mounted data separately from the container.
How would you make the container safer if the application does not need full Linux privileges?
I would reduce the permissions available to the container process instead of giving it broad Linux privileges. The diagram shows capabilities as one important control. Capabilities split powerful root permissions into smaller pieces. I would drop unnecessary capabilities and add back only the few the application needs, such as NET_BIND_SERVICE when it must bind to a protected port.
I would also restrict device access so the container can use only approved entries under /dev. A read-only root filesystem can reduce unwanted file changes when the application supports it. Security controls such as seccomp, AppArmor, or SELinux can further limit system calls and operating-system access.
Namespaces would still isolate process, mount, network, IPC, host-name, and user views. Cgroups would still control CPU, memory, I/O, and process counts.
The downside is that tighter restrictions require testing. Removing a required capability, device, or system call can cause the application to fail.
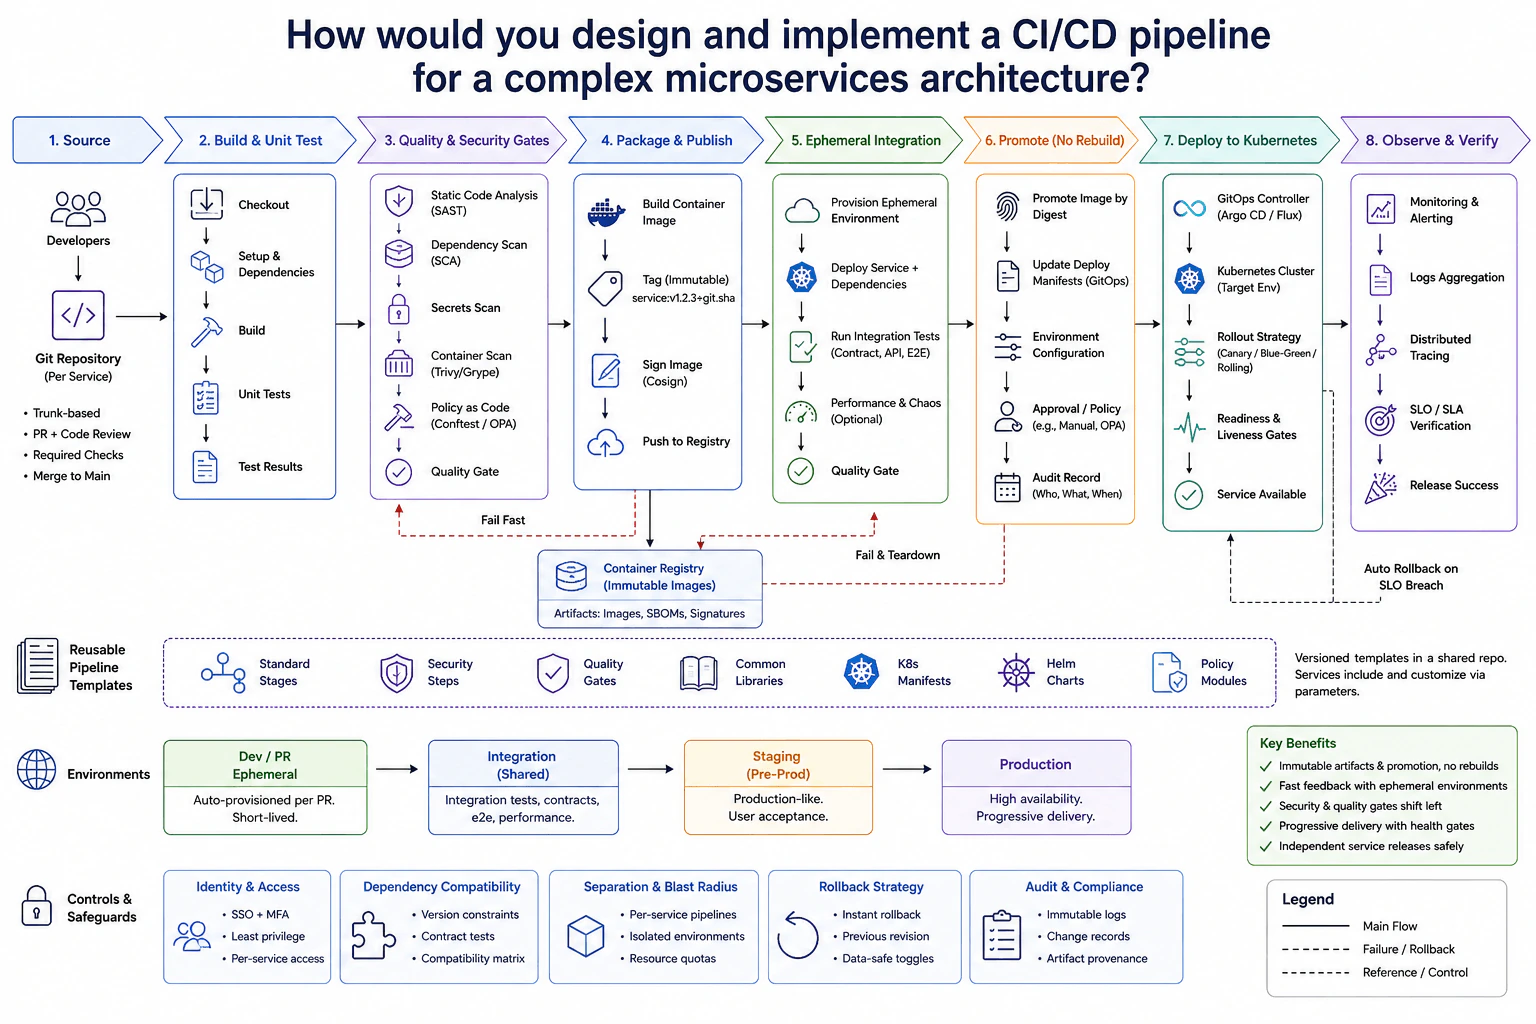
5. How would you design and implement a CI/CD pipeline for a complex microservices architecture?Containers And KubernetesMediumMeta
i Question Details
Describe one delivery path from source revision to immutable container artifacts and Kubernetes rollout. Cover reusable pipeline templates, service-specific variation, tests and security checks, registry identity, environment configuration, dependency compatibility, ephemeral integration environments, promotion rather than rebuild, deployment health gates, progressive exposure, rollback, audit records, and how one service can release independently without allowing a shared pipeline defect to affect every service.
Short Interview Answer (30-60 seconds)
At a high level, I would let each microservice move from source code to Kubernetes through the same safe delivery path. The main challenge is sharing pipeline standards without creating one shared failure that can break every service. I would explain three flows: build and verify the revision, publish and test one container image, then promote that same image through environments. Health gates, progressive rollout, audit records, and rollback make releases safer. The downside is more pipeline and policy maintenance.
Detailed Explanation
The goal is to move a source revision into Kubernetes safely and repeatably. This is harder with many microservices because each service may change independently and may depend on different versions of other services. We also need common delivery rules without making every service use exactly the same settings. The diagram solves this with reusable pipeline templates, service-specific parameters, strong quality gates, one signed container artifact, short-lived integration environments, promotion without rebuilding, controlled Kubernetes rollout, and continuous verification after deployment.
Useful Questions to Ask the Interviewer
Can every service deploy independently, or do some services release together?
Which security and quality checks must block promotion?
Which rollout methods are allowed for production releases?
How to Explain It in an Interview
1. Start with source and reusable pipeline templates
I would start with a Git Repository for each service. Developers use trunk-based development, pull requests, code review, required checks, and then merge to the main branch.
The pipeline uses versioned Reusable Pipeline Templates. They provide Standard Stages, Security Steps, Quality Gates, Common Libraries, K8s Manifests, Helm Charts, and Policy Modules. Services include the shared template but provide their own parameters. This keeps the common path consistent while allowing service-specific variation.
2. Build, test, and stop bad revisions early
The pipeline checks out the exact revision, sets up dependencies, builds the service, and runs Unit Tests. It then runs Static Code Analysis, Dependency Scan, Secrets Scan, Container Scan, and Policy as Code checks.
Any failed Quality Gate stops the release. Dependency Compatibility is also checked through version constraints, contract tests, and a compatibility matrix. These checks matter because one service may change while another still expects an older interface.
3. Build one artifact and test it in isolation
After the gates pass, the pipeline builds the container image once. It gives the image an unchangeable revision-based identity, signs it, and pushes it to the Container Registry. The registry keeps Images, SBOMs, and Signatures.
Next, the pipeline provisions a Dev / PR Ephemeral environment. It deploys the service with its required dependencies and runs Contract, API, and E2E tests. Optional performance and chaos tests can run there too. If verification fails, the pipeline tears down the environment and stops promotion.
4. Promote the same image into Kubernetes
A successful artifact is promoted by image digest rather than rebuilt. The pipeline updates Deploy Manifests through GitOps and applies Environment Configuration for the target environment. Approval or Policy can block the promotion, and an Audit Record records who changed what and when.
A GitOps Controller such as Argo CD or Flux applies the desired state to the Kubernetes Cluster. The service can use Canary, Blue-Green, or Rolling rollout. Readiness and Liveness Gates prevent an unhealthy version from becoming fully available.
5. Verify the release, rollback, and limit blast radius
Monitoring and Alerting, Logs Aggregation, Distributed Tracing, and SLO / SLA Verification check the release after deployment. A failed health condition can trigger rollback to the Previous revision.
Per-service pipelines, isolated environments, resource quotas, and per-service access reduce blast radius. One service can therefore release without forcing unrelated services to release. Versioned shared templates also prevent every service from automatically taking a defective template change at the same moment.
The trade-off is extra pipeline, policy, and template work. In return, releases are repeatable, traceable, easier to verify, and safer to reverse.
Why Interviewers Ask This
Interviewers want to see whether you can make delivery safe without forcing every microservice to release together. They are testing your judgment around reusable automation, security checks, artifact identity, service dependencies, Kubernetes health gates, progressive rollout, rollback, and audit history. They also want to know whether you understand blast radius. The key skill is explaining why each control exists and where failures should stop the release.
Interviewer may ask next
What would you change if a defective shared pipeline template could break deployments for many services at once?
I would keep the Reusable Pipeline Templates, but I would make their versions explicit. Each service would reference a known template version instead of automatically taking the newest template change.
A new template version would first run through a small set of service pipelines. Those services would still use the same Build & Unit Test, Quality & Security Gates, Package & Publish, Ephemeral Integration, Promote, Deploy to Kubernetes, and Observe & Verify stages from the diagram. If those releases stay healthy, more services can adopt the new template version.
Per-service pipelines and isolated environments are important here. One service can remain on its current working template while another tests a newer template. Audit records would also show which template version produced each release.
If the new template causes failures, services can return to the previous template version without changing their application image. The downside is that the platform team may need to support several template versions for a period of time.
How would you handle a release when one microservice changes an interface used by several other services?
I would keep the same pipeline, but I would give more weight to Dependency Compatibility before promotion. The diagram already includes version constraints, contract tests, a compatibility matrix, and an Ephemeral Integration environment.
The changed service first runs its normal build, unit, security, container, and policy checks. Contract tests then verify that the new interface still matches what consumer services expect. The short-lived environment deploys the service with the required dependencies and runs API and E2E tests against that combination.
If the change stays compatible, the service can continue through promotion independently. If it breaks an expected contract, the Quality Gate stops the release before staging or production. The teams can then make the interface backward compatible or coordinate the dependent changes.
The same signed image digest is still promoted after verification. It is not rebuilt for another environment. The downside is that strong compatibility testing takes time and requires teams to maintain accurate contracts and version information.
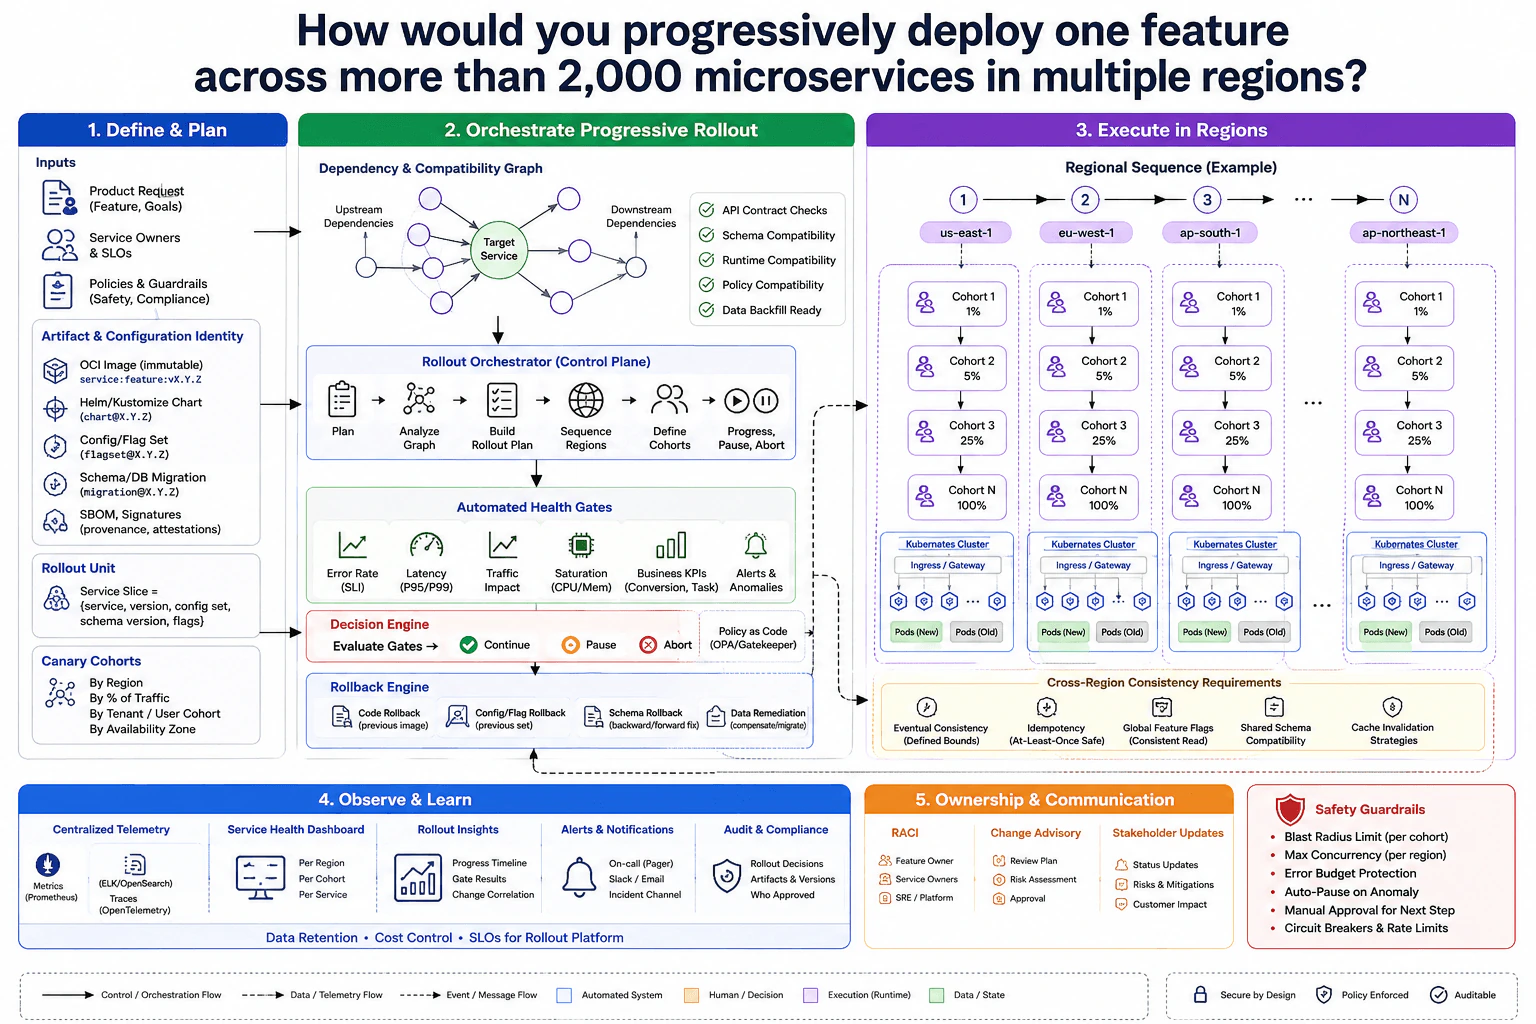
6. How would you progressively deploy one feature across more than 2,000 microservices in multiple regions?Containers And KubernetesHardMeta
i Question Details
Design the rollout unit, dependency and compatibility graph, artifact and configuration identity, regional sequence, canary cohorts, automated health gates, cross-region consistency requirements, pause and abort rules, rollback of code and data changes, observability, ownership, and communication. Explain how the platform prevents one faulty shared component or policy from turning the rollout into a simultaneous multi-region incident.
Short Interview Answer (30-60 seconds)
At a high level, I would make this rollout gradual, observable, and easy to stop. The main challenge is limiting blast radius across more than 2,000 services and several regions. I would divide the rollout into planning, controlled regional execution, and health-based decisions. Each region moves through 1%, 5%, 25%, and 100% cohorts only after automated gates pass. A failed gate pauses or aborts the rollout. The trade-off is slower delivery in exchange for much safer changes.
Detailed Explanation
The goal is to release one feature across thousands of services without letting one bad change become a global incident. This is difficult because services depend on each other, regions can behave differently, and code, configuration, and data may change together. The diagram solves this by defining one rollout unit, checking dependencies and compatibility, moving through small canary cohorts, and advancing regions in sequence. Health signals decide whether to continue, pause, or abort. Rollback, ownership, communication, and safety guardrails are part of the same rollout process.
Useful Questions to Ask the Interviewer
Which services and regions are affected by this feature?
Which dependency or compatibility failures must block the rollout?
Which health signals and business KPIs define a successful cohort?
Which code or data changes can be safely rolled back?
Which rollout steps require manual approval?
How to Explain It in an Interview
1. Define one controlled rollout unit
I would start by treating the feature as one service slice. That slice contains the service version, configuration set, schema version, and feature flags.
The platform also identifies the exact OCI image, Helm or Kustomize chart, Config or Flag Set, Schema or DB Migration, and SBOM signatures. This makes every rollout version clear and traceable. Canary cohorts can be chosen by region, traffic percentage, tenant or user cohort, or availability zone.
2. Analyze dependencies before deployment
Next, the Rollout Orchestrator analyzes the dependency and compatibility graph. It checks upstream and downstream dependencies around the target service.
Blocking checks include API contracts, schema compatibility, runtime compatibility, policy compatibility, and data-backfill readiness. The control plane then builds the rollout plan, sequences regions, defines cohorts, and controls progress, pause, and abort decisions.
3. Progress through health-gated regional cohorts
The rollout starts in one region, such as us-east-1. Inside that region, the Kubernetes Cluster progresses through 1%, 5%, 25%, and 100% cohorts. New and old Pods may run together behind the Ingress or Gateway during this process.
After each cohort, Automated Health Gates check error rate, P95 and P99 latency, traffic impact, CPU and memory saturation, business KPIs, and alerts or anomalies. The Decision Engine evaluates those gates and chooses Continue, Pause, or Abort. Policy as Code also feeds those decisions.
Only after the required gates pass does the platform move to the next region, such as eu-west-1, ap-south-1, and later regions. This sequence, together with a per-region concurrency limit, prevents one bad shared component or policy from being pushed everywhere at once.
4. Keep cross-region behavior safe and reversible
Cross-region rules still matter while different regions run different rollout stages. The diagram allows eventual consistency, which means regions may briefly differ, but only within defined bounds.
It also requires idempotency, meaning repeated work is safe when an operation happens more than once. Global Feature Flags must provide a consistent read. Shared schemas must stay compatible, and cache invalidation must follow a defined strategy.
If a gate fails, the Rollback Engine can restore the previous code image or configuration set. Schema rollback must remain backward and forward compatible. Data changes may need compensation or another migration instead of a simple reversal.
5. Observe, own, and communicate the rollout
Centralized Telemetry collects metrics, logs, and traces. The Service Health Dashboard shows results per region, cohort, and service. Rollout Insights show the progress timeline, gate results, and change correlation.
Feature Owners, Service Owners, and SRE or Platform teams have clear RACI responsibilities. Change Advisory covers review, risk assessment, and approval. Stakeholders receive status updates, risks, mitigations, and customer-impact information.
Safety Guardrails limit blast radius per cohort and maximum concurrency per region. They protect the error budget, support auto-pause on anomalies, allow manual approval for the next step, and use circuit breakers and rate limits. Together, these controls stop one faulty rollout from becoming a simultaneous multi-region incident.
Practical Complexity & Trade-offs
The benefit is that a bad release reaches only a small cohort or one region first. Automated gates also reduce the need for a person to watch every dashboard. The downside is that delivery takes longer because each cohort and region must prove it is healthy. Compatibility rules add work because old and new Pods may run together. Data changes are harder than code changes because some migrations cannot simply be undone. We accept this extra process because it sharply reduces blast radius. The design favors small, reversible steps instead of pushing the feature everywhere at once.
Why Interviewers Ask This
The interviewer wants to see whether you can control risk at very large scale. They are testing your judgment about dependencies, compatibility, canaries, regional sequencing, automated health gates, rollback, and blast-radius control. They also want to see whether you understand that safe deployment is not only a Kubernetes problem. Observability, ownership, approvals, and communication are part of the solution.
Interviewer may ask next
What would you change if the first region passes its canary gates, but the next region shows a sharp increase in errors?
I would stop progression in that region and prevent later regions from starting. A healthy result in the first region does not prove that every region will behave the same way.
The Decision Engine would evaluate the Automated Health Gates for the failing cohort. If error rate or another required signal crosses its allowed limit, the result becomes Pause or Abort. A pause gives owners time to inspect metrics, logs, traces, and Rollout Insights. An abort sends the change to the Rollback Engine.
For code, I would restore the previous image. For configuration, I would restore the previous set. Schema changes must stay backward and forward compatible. Data changes may require compensation or another migration rather than a simple undo.
The important protection is regional sequencing plus the maximum concurrency limit. Later regions do not continue while this problem is unresolved. The downside is that regions may temporarily run different rollout stages, so compatibility rules must remain valid.
How would you handle a shared schema change that is required by many services in this rollout?
I would make schema compatibility a blocking condition before broad rollout. The dependency and compatibility graph should show which upstream and downstream services depend on that shared schema.
Before deployment, the platform checks Schema Compatibility and Data Backfill Ready. The schema must support the period when old and new Pods run together. This matters because a rollback may return some workloads to the previous application version.
I would keep the same regional sequence and canary cohorts. Each cohort must pass the normal error, latency, resource, business, and anomaly gates before expansion. If the shared schema causes trouble, the Decision Engine can Pause or Abort before more regions receive the change.
The Rollback Engine can handle a compatible schema rollback. A data change that cannot be reversed safely may need compensation or another migration. The downside is more migration planning and a slower rollout, but this keeps one shared schema change from becoming a simultaneous multi-region incident.
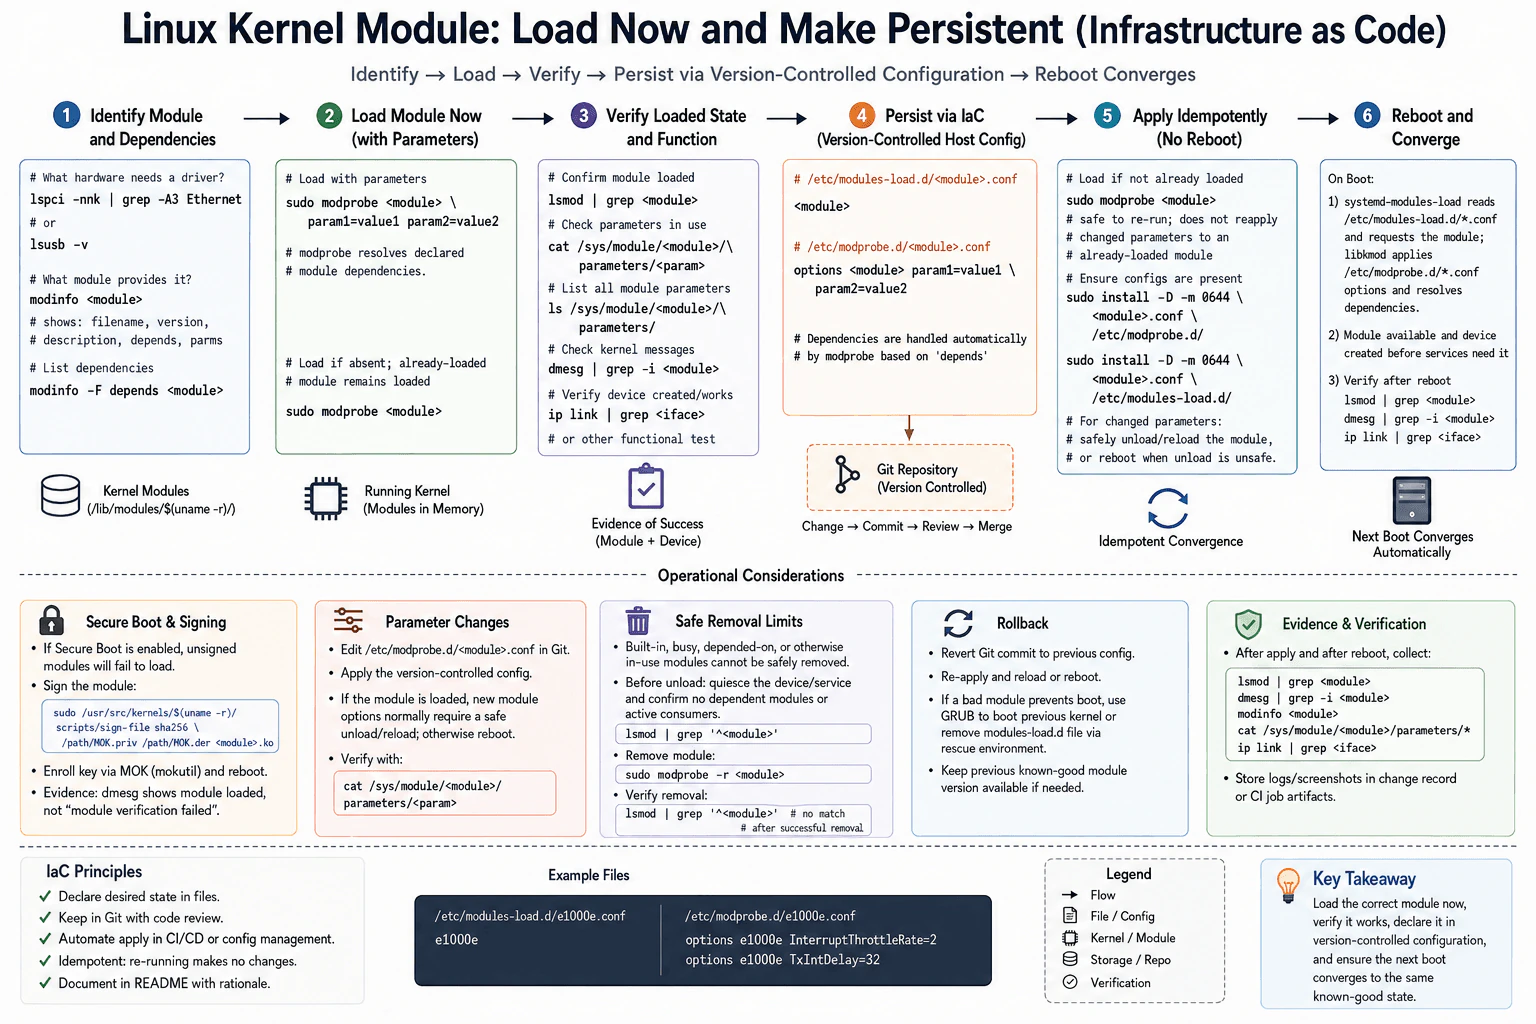
7. How do you load a Linux kernel module and make that configuration persistent?Infrastructure As CodeEasyMeta
i Question Details
A required driver is available as a loadable module rather than built into the kernel. Explain how you identify the exact module and dependencies, load it into the running kernel, pass approved parameters, verify the loaded state and device behavior, and declare the desired boot-time configuration through version-controlled host configuration. Cover idempotent application, module signing or Secure Boot failure, parameter changes, safe removal limits, rollback, and evidence that the next reboot converges to the intended state.
Short Interview Answer (30-60 seconds)
Use modinfo to confirm the module, dependencies, and parameters, then load it with modprobe. Verify the module and device, persist the module in /etc/modules-load.d and its options in /etc/modprobe.d under version control, apply idempotently, and verify the same state after reboot.
The goal is to make a required part of the machine available now and make sure the same setup returns after every restart. First, identify the correct part for the hardware and understand what other parts it needs. Turn it on with only approved settings, then check that the hardware really works. Save the desired setup in reviewed files so repeated automation gives the same result. Also plan for security rejection, changed settings, unsafe removal, rollback, and proof that a later restart returns the machine to the intended working state.
Useful Questions to Ask the Interviewer
Is the module name already known, or should I identify it from the target hardware?
Which module parameters are approved, and are any expected to change without a reboot?
Is Secure Boot enabled, and what module-signing process is approved for these hosts?
Which configuration-management or host-automation tool owns the files under /etc?
Can I reboot a test host to prove next-boot convergence?
How to Explain It in an Interview
I would separate the task into two states: make the running kernel correct now, then declare the same desired state for future boots.
First, identify the exact module. For PCI hardware I can inspect lspci -nnk, and for USB hardware I can use lsusb -v. After I have a candidate module, modinfo <module> shows metadata, while modinfo -F depends <module> shows its declared dependencies and modinfo -p <module> shows supported parameters. I would verify these instead of guessing the driver name or parameter names.
For the running kernel, I would normally use modprobe, because it uses module metadata and resolves declared dependencies. For example, sudo modprobe <module> param1=value1 param2=value2 loads the module with approved load-time parameters. Re-running modprobe <module> when the module is already loaded is safe, but it does not reapply new load-time parameter values to that existing instance.
Next, verify both state and behavior. lsmod | grep '^<module>' confirms that the module is loaded. Runtime module parameters are exposed under /sys/module/<module>/parameters/, so I would read the relevant files there rather than treating module parameters as generic sysctl values. I would inspect dmesg for load, firmware, signature, or device errors, and I would test the actual device, such as checking the expected network interface with ip link when the module is a network driver.
For persistence, the repository becomes the source of truth for the host configuration. /etc/modules-load.d/<module>.conf contains the module name so it is requested during boot. /etc/modprobe.d/<module>.conf contains entries such as options <module> param1=value1 param2=value2. On a systemd host, systemd-modules-load reads the modules-load configuration and requests the module. The libkmod/modprobe path applies matching /etc/modprobe.d/*.conf options and resolves module dependencies.
The host automation should apply these files idempotently: if the desired files are already correct and the module is already loaded, another run should not produce a different configuration. The files should be version controlled, reviewed, and validated before deployment. This specific workflow does not require Terraform-style remote state or locking because the desired state is represented by repository-managed host files rather than a remote infrastructure state backend.
Parameter changes need special care. Updating /etc/modprobe.d/<module>.conf changes the parameters used the next time that module is loaded; it does not normally change an already-loaded instance. If a new value must take effect immediately and the parameter is not safely writable at runtime, I would quiesce the affected device or service, confirm there are no dependent modules or active consumers, then safely unload and reload the module. If removal is unsafe, I would reboot instead. I would verify the resulting value with cat /sys/module/<module>/parameters/<param>.
Removal also has limits. A built-in module cannot be removed, and a busy module or one required by dependent modules should not be unloaded. Before sudo modprobe -r <module>, I would quiesce the user of the device and inspect the module and dependency state. After successful removal, the module should no longer appear in lsmod.
With Secure Boot enabled, an unsigned or untrusted module can be rejected. I would confirm the failure in kernel logs and follow the organization's approved signing process instead of disabling Secure Boot as the normal workaround. That can include signing the module with an approved key and enrolling the trusted key through the platform's supported process, such as MOK where applicable.
For rollback, I would revert the repository configuration to the previous known-good version, reapply it, and reload or reboot as required. If a bad module configuration prevents a normal boot, recovery can require booting a previous known-good kernel or using a rescue environment to remove the problematic modules-load configuration.
Finally, I would prove convergence after both the configuration apply and the next reboot. I would capture lsmod, dmesg, modinfo, the values under /sys/module/<module>/parameters/, and a device-level functional check. That evidence shows that the module, approved parameters, and device behavior returned to the intended state after reboot rather than merely working during the current session.
Key Insight / Why This Solution Works
Identify the hardware and exact module with hardware discovery and modinfo.
Inspect declared dependencies and supported parameters.
Load the module with modprobe and approved parameters.
Verify lsmod, /sys/module parameter values, dmesg, and device behavior.
Store the module name in /etc/modules-load.d/<module>.conf and approved options in /etc/modprobe.d/<module>.conf under version control.
Apply the repository-managed files idempotently and load the module if it is absent.
For changed parameters, safely unload and reload only when the device, consumers, and dependencies allow it; otherwise reboot.
Handle Secure Boot rejection through the approved signing and trust process.
Roll back by reverting to the previous known-good repository configuration.
Reboot when permitted and collect evidence that the same module, parameters, and device behavior return.
Code
#!/usr/bin/env python3from __future__ import annotations
import os
import subprocess
import tempfile
from pathlib import Path
# Repository-owned desired state for the example shown in the diagram.# These parameter names must be validated against the exact module build on the target kernel.
MODULE = "e1000e"
MODULES_FILE = Path("/etc/modules-load.d/e1000e.conf")
OPTIONS_FILE = Path("/etc/modprobe.d/e1000e.conf")
MODULES_CONTENT = "e1000e"
OPTIONS_CONTENT = "options e1000e InterruptThrottleRate=2 TxIntDelay=32"defrun(
args: list[str],
*,
check: bool = True,
stdout: int | None = None,
) -> subprocess.CompletedProcess[str]:
return subprocess.run(
args,
check=check,
text=True,
stdout=stdout,
)
# Validate module availability before changing persistent host state.# modinfo also confirms that this is a loadable module for the running kernel.
run(["modinfo", MODULE], stdout=subprocess.DEVNULL)
# Validate the approved load-time parameters against the target module version.# Kernel updates can change available parameters, so fail before deployment if either is missing.
module_params = run(["modinfo", "-p", MODULE], stdout=subprocess.PIPE).stdout
ifnotany(line.startswith("InterruptThrottleRate:") for line in module_params.splitlines()):
raise SystemExit("InterruptThrottleRate parameter is not available")
ifnotany(line.startswith("TxIntDelay:") for line in module_params.splitlines()):
raise SystemExit("TxIntDelay parameter is not available")
# Apply repository-owned file content only when it differs from the current host file.# This makes repeated configuration runs idempotent and leaves file ownership with automation.defwrite_if_changed(path: Path, content: str) -> None:
desired = f"{content}\n".encode()
with tempfile.NamedTemporaryFile(delete=False) as tmp:
tmp.write(desired)
tmp_path = Path(tmp.name)
try:
same = Falseif run(["sudo", "test", "-f", str(path)], check=False).returncode == 0:
same = (
run(
["sudo", "cmp", "-s", str(tmp_path), str(path)],
check=False,
).returncode
== 0
)
ifnot same:
run(["sudo", "install", "-D", "-m", "0644", str(tmp_path), str(path)])
finally:
tmp_path.unlink(missing_ok=True)
# Declare that the module must be requested during boot.# On systemd hosts, systemd-modules-load reads configuration under /etc/modules-load.d/.
write_if_changed(MODULES_FILE, MODULES_CONTENT)
# Declare the approved options used when libkmod/modprobe loads the module.# Changing this file does not automatically change parameters on an already-loaded instance.
write_if_changed(OPTIONS_FILE, OPTIONS_CONTENT)
# Load the module now only when it is absent.# modprobe is dependency aware and reads the persistent options from /etc/modprobe.d/.withopen("/proc/modules", encoding="utf-8") as modules_file:
loaded = any(line.startswith(f"{MODULE} ") for line in modules_file)
ifnot loaded:
run(["sudo", "modprobe", MODULE])
# Verify loaded state, module metadata, runtime parameters, and device-facing evidence.# These checks are read-only and can also be repeated after reboot to prove convergence.withopen("/proc/modules", encoding="utf-8") as modules_file:
loaded_line = next((line for line in modules_file if line.startswith(f"{MODULE} ")), None)
if loaded_line isNone:
raise SystemExit(f"{MODULE} is not loaded")
print(loaded_line, end="")
run(["modinfo", MODULE])
parameters_dir = Path(f"/sys/module/{MODULE}/parameters")
ifnot parameters_dir.is_dir():
raise SystemExit(f"{parameters_dir} does not exist")
print((parameters_dir / "InterruptThrottleRate").read_text(encoding="utf-8"), end="")
print((parameters_dir / "TxIntDelay").read_text(encoding="utf-8"), end="")
run(["ip", "link"])
# Do not automate `modprobe -r` here.# Safe removal requires quiescing the affected device or service and confirming that no dependent# modules or active consumers still require the module; otherwise use an approved reboot instead.
Why Interviewers Ask This
This question checks whether you understand both the Linux kernel-module lifecycle and the DevOps requirement to turn a one-time host command into repeatable, reviewable desired state. Interviewers want to see correct module discovery, dependency-aware loading, parameter handling, functional verification, boot persistence, idempotent automation, Secure Boot awareness, safe change and removal behavior, rollback, and evidence that a reboot reproduces the intended configuration.
Common interview mistakes
Common mistakes include guessing the module instead of checking hardware and modinfo; using insmod as the normal loader and missing dependencies; treating a successful modprobe as proof that the device works; checking module parameters with sysctl instead of /sys/module/<module>/parameters; assuming an edited /etc/modprobe.d file changes an already-loaded instance; restarting systemd-modules-load as a substitute for a safe unload/reload; removing a busy or depended-on module; disabling Secure Boot instead of correcting module trust; making manual /etc changes outside version control; and claiming persistence without proving the state after reboot.
Interview tip
Present the solution as two connected states: make the running kernel correct now, then declare the same desired state for future boots. Mention modprobe for dependency-aware loading, /etc/modules-load.d and /etc/modprobe.d for persistence, /sys/module for parameter evidence, safe reload limits, Secure Boot handling, rollback, and post-reboot verification.
Interviewer may ask next
What would you do if a module parameter changes while the module is already loaded?
First determine whether that specific parameter is safely writable at runtime. If it is a load-time-only parameter, update the version-controlled /etc/modprobe.d configuration. To apply it immediately, quiesce the affected device or service, confirm there are no dependent modules or active consumers, and safely unload and reload the module. If unloading is unsafe, reboot instead. Then verify the active value under /sys/module/<module>/parameters/ and test the device.
What would you do if Secure Boot prevents the module from loading?
Confirm the rejection in the kernel logs and verify whether the module is unsigned or signed by an untrusted key. Keep Secure Boot enabled unless an explicit policy says otherwise. Use the organization's approved module-signing process, enroll the trusted key through the supported platform mechanism when necessary, then retry the load. Verify the module, its parameters, and device behavior after loading and again after reboot.
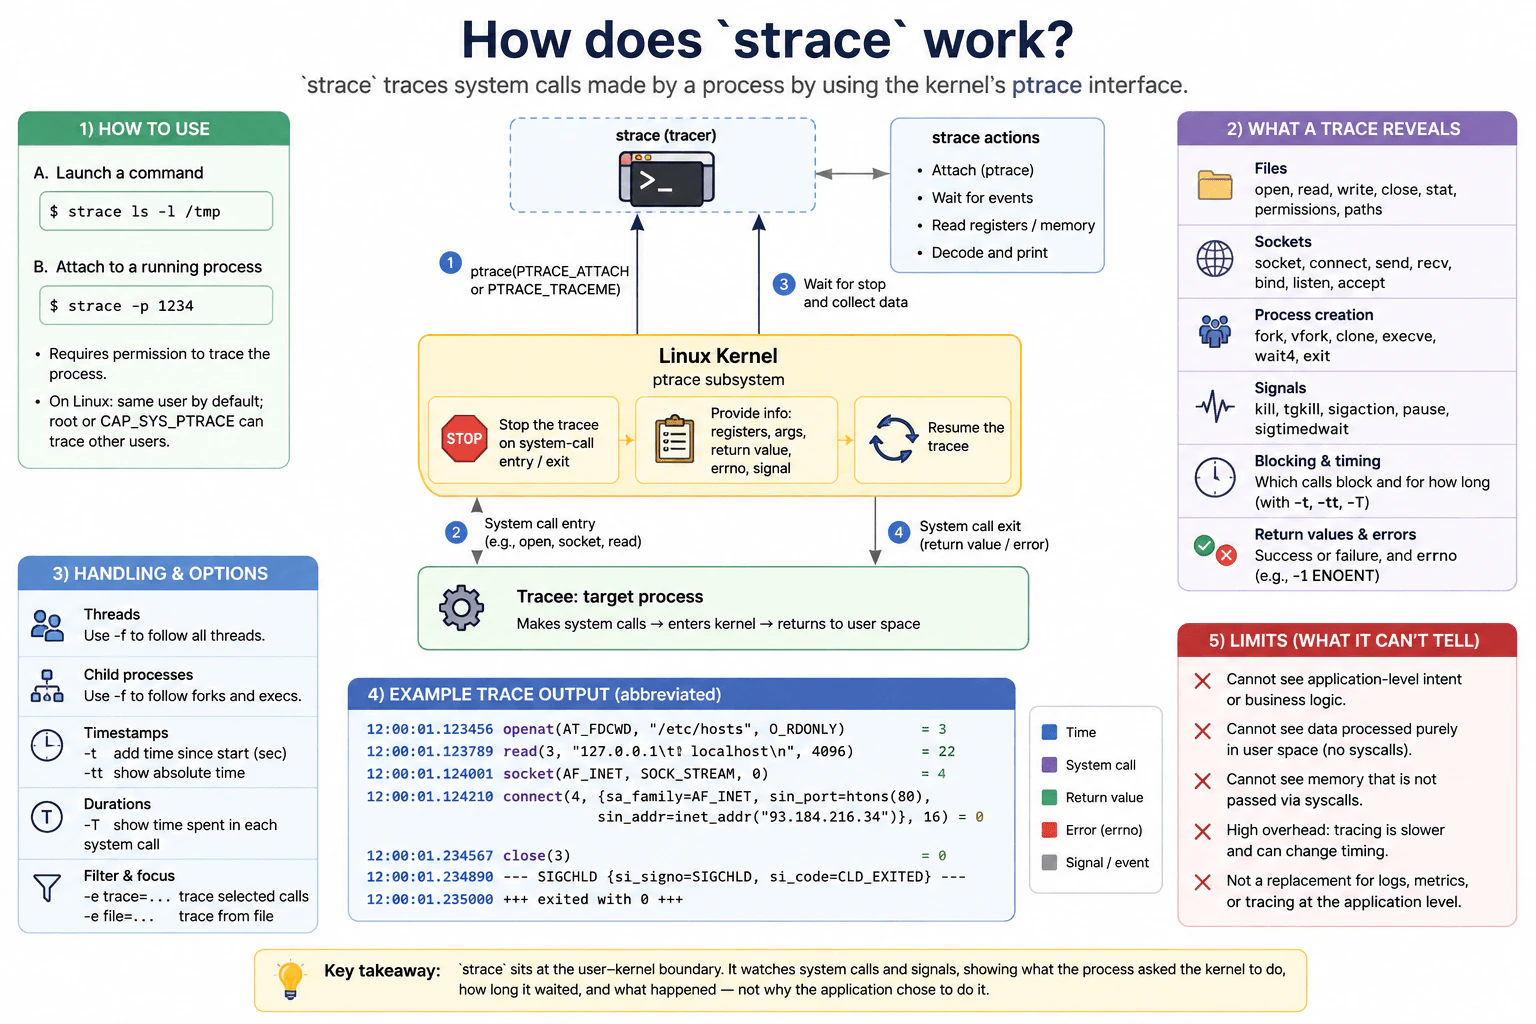
8. How does `strace` work?ObservabilityEasyMeta
i Question Details
Explain what boundary strace observes, how it attaches to or launches a process, and what a system-call trace can reveal about files, sockets, process creation, signals, blocking, return values, and errors. Include attach permissions and overhead, multi-threaded or child-process handling, timestamp and duration options, and what the trace cannot establish about application-level intent by itself.
Short Interview Answer (30-60 seconds)
strace uses Linux ptrace to observe a process when it enters and leaves system calls. It shows arguments, return values, errors, signals, and timing, which helps diagnose files, sockets, child processes, and blocking. It adds overhead and cannot explain application-level intent by itself.
Detailed Explanation
A program often asks the computer to do things it cannot do alone, such as open a file, talk to another machine, start another program, wait for something, or stop. strace lets us watch those requests and see what happened after each one. This is useful when a program is slow, cannot find a file, cannot connect, or stops unexpectedly. It can also show when a request happened, how long it took, and whether it succeeded. The key limit is that it shows what happened, not the program's business reason for doing it.
Useful Questions to Ask the Interviewer
Should I explain both attaching to an existing process and launching a new process under strace?
Should I include common options for following children and measuring timing?
Should I discuss Linux permission restrictions and production overhead?
How to Explain It in an Interview
strace observes the boundary between a Linux user-space process and the kernel. It does not read application logs or understand application source code. Instead, it relies on Linux's ptrace tracing mechanism. At relevant trace stops around system-call entry and exit, the kernel allows the tracer to inspect information such as the system-call number, arguments, registers, return value, and signal state. strace decodes that information into readable output, resumes the target, and continues observing later events.
There are two common ways to start tracing. To launch a new command under tracing, use a command such as strace ls -l /tmp. To inspect an already running process, use strace -p 1234. Attaching requires permission to trace the target. Linux permission checks can depend on user IDs, dumpability, capabilities such as CAP_SYS_PTRACE, Linux Security Modules, and settings such as Yama ptrace_scope. Therefore, being the same user often helps but does not guarantee that attachment will always be allowed.
A system-call trace can reveal several important kinds of evidence. File calls such as openat, read, write, close, and stat can show paths, access attempts, permissions-related failures, missing files, and I/O behavior. Socket calls such as socket, connect, send, recv, bind, listen, and accept can show network activity and connection errors. Process-related calls such as fork, vfork, clone, execve, wait4, and exit-related calls show process creation, program execution, waiting, and termination. Signals can also be displayed, including signal delivery and related events.
Return values are especially useful. A successful call normally shows its result, while a failed call commonly shows -1 followed by an error name such as ENOENT. For example, if openat returns -1 ENOENT, that is evidence that the attempted path did not exist from the kernel's point of view at that moment. It does not, by itself, explain why the application chose that path.
strace is also useful for blocking and latency investigations. Timestamp options such as -t and -tt show when events occur, while -T shows how much elapsed time a system call took from the tracer's perspective. This can expose a slow connect, a blocked read, or another kernel interaction that spends significant time waiting. Timing must still be interpreted carefully because tracing adds overhead and can change the timing of the observed process.
For programs that create additional execution contexts, -f follows descendants created through calls such as fork, vfork, or clone, which is useful for multi-process and multi-threaded programs. Output from several traced tasks can be interleaved, so process or thread identifiers and timestamps help reconstruct ordering. Filtering selected system calls with options such as -e trace=... can reduce noise, and -o <file> can save the trace for later analysis.
The major limitation is scope. strace observes system calls, signals, and related kernel-boundary events. It cannot directly reveal application-level intent, business logic, or computations and state changes that remain entirely in user space. It also should not be treated as a replacement for application logs, metrics, distributed traces, profiles, or a debugger.
The practical rule is: use strace when the question is, "What is this process asking the Linux kernel to do, what did the kernel return, and where is it waiting?" Use higher-level observability or debugging tools when the question is, "Why did the application decide to do this?"
Technical Approach
Identify the process or command whose operating-system behavior needs inspection.
Launch it under strace or attach with -p, after confirming tracing permission.
Reproduce the symptom while collecting only the relevant system calls when possible.
Inspect file, socket, process, signal, return-value, and error evidence.
Use -t or -tt for timestamps and -T when call duration matters.
Use -f when relevant child processes or threads must also be followed.
Treat observed calls and return values as kernel-boundary evidence, not proof of application intent.
Correlate the trace with logs, metrics, distributed traces, profiles, or application knowledge when the suspected cause is above the system-call boundary.
Stop tracing after the investigation because it adds overhead, then verify normal behavior without the tracer.
Practical Insights
strace does not have a meaningful Big-O complexity for this interview question because it is a tracing tool, not an algorithm. Its main cost is operational. Traced system calls and signals require additional kernel and tracer work, so programs that generate many trace events can run noticeably slower and produce large output. Following many threads or child processes increases that volume further. Saving traces consumes storage, and trace arguments or buffers can contain sensitive information. For production use, tracing should be targeted, temporary, filtered when practical, and handled securely.
Why Interviewers Ask This
This question checks whether the candidate understands the Linux user-space to kernel boundary and can use low-level evidence to diagnose real process behavior. A strong answer explains what strace observes, how tracing starts, what its output can reveal, attach permissions and overhead, handling of threads and child processes, useful timestamp and duration options, and the important limitation that system calls alone do not explain application-level intent.
Common interview mistakes
Common mistakes are saying that strace reads application logs or understands business logic; assuming every same-user process can always be attached despite Linux security restrictions; forgetting that tracing adds overhead and can change timing; looking only at system-call names while ignoring return values and error names; tracing only the original process when relevant work happens in children or threads; collecting an enormous unfiltered trace without useful timestamps; assuming a slow system call automatically proves the application-level root cause; and treating strace as a replacement for logs, metrics, distributed traces, profiles, or a debugger.
Interview tip
Explain strace from the boundary first: a user-space process makes system calls into the Linux kernel, and strace observes those interactions through ptrace. Then cover launch versus attach, return values and errors, files and sockets, -f, timestamps and -T, permissions, and overhead. Finish with the key limitation: it shows what the process asked the kernel to do and what happened, but not why the application made that decision.
Interviewer may ask next
How would you use `strace` to investigate a process that appears to be hanging?
Attach to the process with strace -p <PID> if permissions allow it and observe which system calls repeat or spend a long time waiting. Add -t or -tt for timestamps and -T for call duration. If relevant work happens in descendants or threads, use -f. Calls such as read, connect, poll, or futex may reveal where execution is waiting at the kernel boundary. I would then correlate that evidence with application logs, metrics, traces, profiles, or a debugger before claiming an application-level root cause, because strace alone does not establish intent.
What are the risks or tradeoffs of running `strace` on a production process?
strace adds overhead because tracing introduces extra stops and tracer work around observed events, so a syscall-heavy process can become slower and its timing can change. Following many children or threads can generate large, interleaved output. Trace output may also contain file paths, command arguments, network details, or data passed through system calls, so sensitive information must be protected. In production, I would trace for the shortest useful period, filter the scope where possible, store output securely, and verify behavior again after tracing is removed.
9. Tell me about yourself.BehavioralEasyMeta
i Question Details
Give a concise, truthful walkthrough of your background that emphasizes production engineering, infrastructure, reliability, automation, or operational coding. Connect the progression among your roles, the systems you personally owned, and the kind of scope you are now seeking, while distinguishing your contribution from team outcomes and avoiding a complete resume recital.
Interview tip:
Use STAR to structure your answer: briefly explain the Situation and Task, make Action the most detailed part, and finish with the Result. For example, describe how your background progressed toward production engineering, infrastructure, reliability, automation, and operational coding, explain the systems you personally owned, show how you worked with other teams, and connect that experience to the type of DevOps scope you are seeking now.
Situation
In my previous roles, I gradually moved toward work focused on production systems, infrastructure, automation, and reliability. I found that I was most interested in understanding how applications run in real environments and how engineering teams can operate those systems safely.
Task
My responsibility became making delivery and operations more reliable. I needed to help engineers deploy changes safely, improve infrastructure consistency, respond to production issues, and reduce repetitive operational work while being clear about which parts I personally owned and which outcomes came from the wider team.
Action
I focused on building practical DevOps skills around those responsibilities. I automated repeatable deployment and infrastructure tasks so the same process could be used consistently instead of depending on manual steps. I worked with continuous integration and delivery pipelines to make builds, tests, and releases easier to understand and safer to run. I used infrastructure as code so infrastructure changes could be reviewed and tracked like application code. I also paid close attention to monitoring, logs, alerts, and production behavior because automation is only useful when we can see whether the system is healthy. When incidents happened, I helped investigate the technical cause, communicated clearly with the people involved, and looked for follow up improvements that could prevent the same problem. I worked closely with developers and other engineers, but I stayed clear about my own contribution, especially the automation, infrastructure changes, operational analysis, and reliability improvements I personally handled.
Result
That progression gave me a strong interest in DevOps work that combines coding, infrastructure, reliability, and collaboration. I learned that strong operations are not only about fixing problems after they happen. They are also about designing safer processes before problems occur. I am now looking for a role where I can take broader ownership of production systems, improve engineering workflows, and continue building reliable automation at larger scale.
Why Interviewers Ask This
Interviewers ask this question to understand how clearly you can explain your professional story and whether your experience matches the role. A strong answer shows a logical progression toward DevOps work, clear ownership of your contributions, relevant technical depth, and a thoughtful reason for the scope you want next.
Interviewer may ask next
Which part of your DevOps experience has prepared you most for the role you are seeking now?
The strongest preparation has been combining automation with production ownership. Writing automation taught me how to make processes consistent, while working with deployments, monitoring, and incidents taught me to think about what happens after a change reaches production. That combination helped me develop better judgment about reliability, operational risk, and how engineering decisions affect the people running the system.
How do you distinguish your own contribution from the work of the wider team?
I describe the team goal first, then explain the parts I personally handled. For example, the wider team may have been responsible for delivering and operating an application, while I personally worked on infrastructure automation, deployment workflows, monitoring, operational investigation, or reliability improvements. I think that distinction is important because it gives a clear picture of both collaboration and individual ownership.
DevOps Engineer Resume Examples
Explore the resume examples below to find the one that best matches your target DevOps Engineer role.
Disclaimer: This interview guide is for educational and informational purposes only. It is designed to help readers prepare, but it does not guarantee any interview result, hiring decision, offer, or outcome. Interview questions, hiring criteria, and preferred answers can vary by employer, interviewer, industry, location, and time. All answers, examples, and explanations in this guide are suggested examples for interview preparation, not definitive answers or instructions for professional practice. They are based on research and judgment, are provided without warranties of any kind, and should be adapted to the question, role, and applicable laws and professional requirements. Diagrams are simplified illustrations intended to highlight the main concepts and their relationships; actual situations, systems, and practices may be more complex. Alternative approaches may be equally valid or better suited to a particular question, context, or interviewer. To the fullest extent permitted by applicable law, the contributors and publisher are not liable for decisions made, actions taken, or losses incurred based on this guide.
State Laws and Professional Responsibilities: Laws and requirements governing an occupation vary by state and jurisdiction. You are responsible for checking the current laws, licensing requirements, and scope-of-practice rules that apply to your location and role, and for ensuring that your answers and actions comply with them. Adapt examples in this guide to those requirements. This guide is not legal advice.
Company Notice: This guide is an independent educational resource and is not affiliated with, endorsed by, sponsored by, or approved by the company named in this guide. Company names identify reported interview experiences or the employer context of clearly labeled original practice exercises. Interview practices can change without notice, and inclusion of company-specific content does not mean these questions are official, complete, or guaranteed to be asked. To the fullest extent permitted by law, the author, contributors, and publisher are not responsible for outcomes related to use of this material.
Content Accuracy and Verification: To the fullest extent permitted by applicable law, we do not represent or warrant that interview guides, questions, answers, examples, or diagrams are accurate, complete, current, error-free, or suitable for any particular purpose. You are responsible for independently reviewing and verifying the information before relying on it.