11. A deployment takes more than two hours. How would you find where the time is going?
Treat the total duration as the sum of identifiable stages rather than one pipeline metric. Correlate a single run ID across queue wait, agent provisioning, checkout, dependency restore, build, tests, scans, artifact transfer, approval wait, deployment, rollout readiness, and post-deployment verification. Compare with a known-good baseline and inspect retries, serialization, cache effectiveness, external-service latency, resource saturation, and log gaps. Define evidence that separates deliberate waiting from a hung or repeatedly failing step before optimizing it.
I would time every deployment stage under one run ID, compare each duration with a known-good baseline, and investigate the largest differences. Then I would use timestamps, retries, cache behavior, external latency, resource signals, and telemetry gaps to prove the bottleneck before changing it.
A deployment taking more than two hours only tells me that the whole process is slow. It does not tell me which part is responsible. I would divide the process into smaller steps and measure how long each one takes. Then I would compare those times with a normal deployment and focus on the biggest difference. I would check whether the delay is expected, whether work is still moving slowly, or whether a step has stopped or keeps trying again. I would change only the proven problem, repeat the run, and watch later runs.
- Do we already record start time, end time, status, and retries for every deployment stage?
- Is there a known-good deployment or historical baseline I can compare with?
- Are approval waits or other deliberate pauses included in the two-hour duration?
- Can one deployment run ID be correlated across stage records, logs, metrics, traces, and approvals?
- Have agent capacity, caching, retries, or external services recently changed?
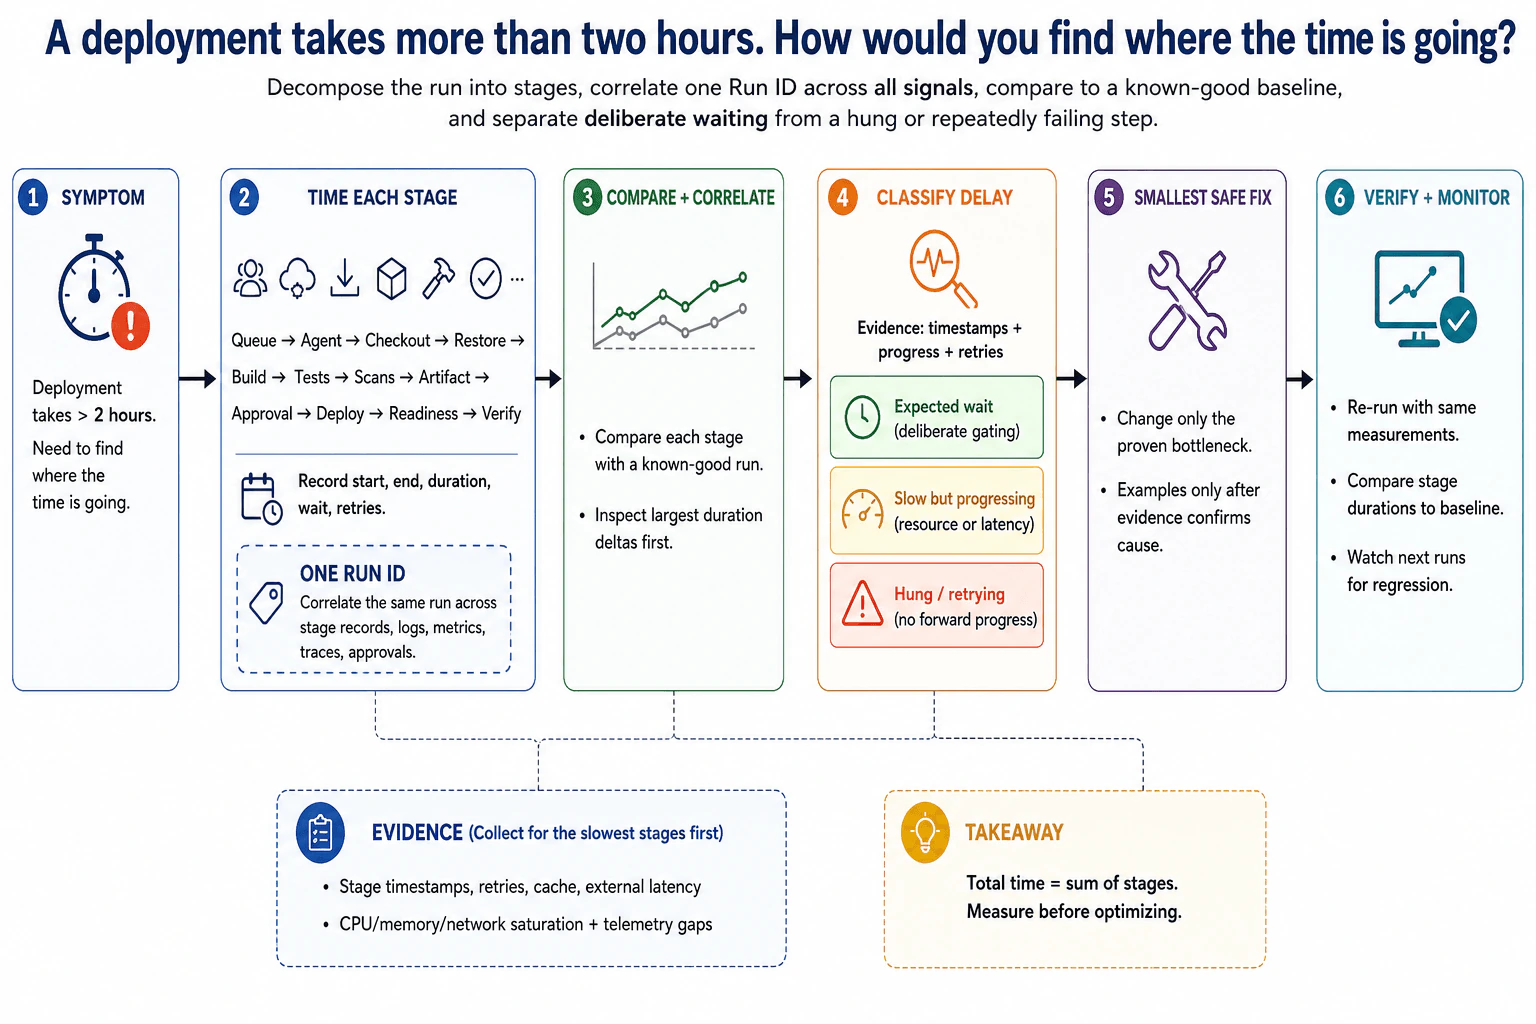
I would use an evidence-first flow: measure every stage, correlate one run, compare with normal behavior, classify the delay, change only the proven bottleneck, and verify with the same measurements.
The symptom is simple: the deployment takes more than two hours. I would not assume which stage is slow from the total duration alone. The total should be treated as the sum of identifiable stages.
I would capture start time, end time, duration, wait time, status, and retry count for the major stages:
- Queue wait
- Agent provisioning
- Checkout
- Dependency restore
- Build
- Tests
- Scans
- Artifact transfer
- Approval wait
- Deployment
- Rollout readiness
- Post-deployment verification
This shows where the time is actually spent instead of treating the whole pipeline as one number.
I would use one run ID for the deployment and correlate that same run across stage records, structured logs, metrics where appropriate, traces when available, deployment events, and approval records.
The run ID prevents evidence from different deployments from being mixed together. I would also keep timestamps consistent and account for clock skew because incorrect clocks can make stage boundaries look wrong.
For metrics, I would avoid putting a unique run ID on every metric series because that creates high cardinality and unnecessary ingestion and storage cost. Run-level detail is usually better correlated through logs, traces, events, or carefully designed links from aggregate metrics.
I would compare every current stage duration with a known-good deployment or historical normal range. I would inspect the largest positive duration differences first.
If queue time increased sharply, I would investigate capacity or scheduling. If dependency restore became slower, I would investigate cache effectiveness and package-feed latency. If approval wait explains the extra time and the approval is intentional, that is deliberate waiting rather than a technical hang.
A historical median and higher percentiles are more useful than relying on one previous run when enough history exists because normal duration can vary from run to run.
For the stages with the largest differences, I would collect evidence such as:
- Stage timestamps and progress events
- Retry and backoff history
- Cache hits, misses, and reuse behavior
- External-service latency and errors
- CPU, memory, disk, and network saturation
- Structured logs and deployment events
- Traces across instrumented boundaries
- Missing telemetry or gaps in expected events
Each signal answers a different question. Metrics show trends and saturation. Logs show detailed events and errors. Traces show latency across instrumented boundaries. None of them alone automatically proves the root cause.
I would classify the abnormal time into one of three practical states.
Expected wait: The deployment is intentionally waiting, such as for an approval or scheduled gate. Records should explain why the stage is paused.
Slow but progressing: The stage continues making forward progress, but it is slower than the baseline. Possible areas to investigate include limited resources, serialized work, weak cache reuse, large artifacts, or slow external services.
Hung or retrying: The stage shows no meaningful forward progress, repeatedly fails, repeatedly retries, spends time in backoff, or misses expected progress events. I would inspect retries, timeouts, dependency health, and stage-specific evidence.
The distinction matters because the correction depends on the evidence. More capacity will not fix a deliberate approval wait, and increasing a timeout will not correct an operation that repeatedly fails.
After narrowing the slow stage, I would test one hypothesis at a time.
For resource saturation, I would correlate the slow interval with CPU, memory, disk, or network pressure. For retries, I would correlate retry timestamps and backoff time with the stage duration. For caching, I would inspect hits, misses, and whether reusable inputs changed. For an external dependency, I would compare its latency and error behavior with normal runs.
If the evidence disproves a hypothesis, I would reject it and move to the next supported explanation rather than continuing as though it were confirmed.
I would change only the proven bottleneck. The exact correction depends on the confirmed cause. It might involve restoring effective caching, removing unnecessary serialization, correcting a retry condition, providing appropriate capacity to a saturated stage, or addressing a slow external dependency.
I would avoid changing several unrelated things at the same time because that makes it difficult to know which change helped and increases deployment risk.
I would rerun the deployment with the same stage measurements. I would compare the affected stage duration with the known-good baseline and confirm that the total duration improved for the expected reason.
I would also check that retries, failures, or other health signals did not become worse. Finally, I would watch several later runs for regression instead of declaring success after one unusually fast deployment.
The primary service-level indicator, or SLI, is deployment duration. I would also track stage-duration SLIs because the total duration alone does not identify the bottleneck. A service-level objective, or SLO, defines the acceptable deployment-performance target over time. Alert thresholds should follow that objective rather than being arbitrary.
A useful dashboard would show total deployment duration, stage durations, queue time, retry counts, success or failure state, cache effectiveness where available, and relevant resource or external-service signals. Operators should be able to compare a current run with normal historical behavior.
Alerts should be symptom based and actionable. A deployment-duration SLO breach should identify the affected pipeline or environment, ownership, severity, and the runbook or investigation view. Noise controls should prevent repeated alerts for the same condition.
Telemetry has operational limits. Sampling can hide some traces. Short retention can remove evidence before an investigation begins. Missing instrumentation creates blind spots. High-cardinality labels increase metric cost. Clock skew can distort duration calculations. Logs and traces can increase ingestion and storage costs. Credentials, tokens, personal information, and sensitive payloads must be redacted before telemetry is stored.
The key takeaway is: total deployment time equals the sum of its stages. Measure before optimizing. Correlate one run, compare with a baseline, prove the bottleneck, make the smallest safe correction, and verify it.
- Record the deployment symptom and one run ID.
- Split the run into queue, agent, checkout, restore, build, tests, scans, artifact, approval, deployment, readiness, and verification stages.
- Capture start time, end time, duration, wait time, status, and retries for each stage.
- Compare every stage with a known-good baseline.
- Investigate the largest duration differences first.
- Correlate timestamps, retries, cache behavior, external latency, resource saturation, logs, metrics, traces, approvals, and telemetry gaps using the same run ID.
- Classify the delay as expected waiting, slow but progressing, or hung/retrying.
- Test the strongest evidence-supported hypothesis and reject disproved hypotheses.
- Apply only the smallest correction supported by confirmed evidence.
- Rerun with the same measurements, compare with the baseline, and monitor later runs for regression.
Stage timing is inexpensive because it needs only a small amount of data for each deployment stage. Logs and traces can create much more stored data, especially with long retention or high collection rates. Metrics are efficient for trends, but high-cardinality labels can become expensive. Additional instrumentation also creates maintenance work. The goal is to collect enough evidence to explain the delay without creating unnecessary data volume, cost, privacy risk, or operational complexity.
This question tests whether the candidate diagnoses a long deployment using evidence instead of guessing. A strong answer decomposes the total time into stages, correlates evidence from the same run, compares abnormal stages with known-good behavior, and distinguishes deliberate waiting from genuine slowdowns, hangs, or repeated retries. It also tests judgment around caching, external dependencies, resource saturation, missing telemetry, safe correction, and verification.
Common mistakes are looking only at the total two-hour duration, guessing which stage is slow, optimizing before measuring, comparing unrelated runs, treating an intentional approval wait as a technical failure, treating a slow but progressing stage as hung, ignoring retries and backoff time, ignoring cache misses or external-service latency, assuming one signal such as CPU usage proves the cause, using unique run IDs indiscriminately as metric labels, overlooking telemetry gaps or clock skew, changing several things at once, and declaring success after one faster run without monitoring later deployments.
Present the answer as a clear diagnostic sequence: decompose the two hours into stage durations, correlate one run ID, compare each stage with a known-good baseline, investigate the largest delta, classify the delay as expected waiting, slow progress, or hung/retrying behavior, change only the proven bottleneck, and verify using the same measurements.