This interview guide is for educational and informational purposes only. It is designed to help readers prepare, but it does not guarantee any interview result, hiring decision, offer, or outcome. Interview questions, hiring criteria, and preferred answers can vary by employer, interviewer, industry, location, and time. All answers, examples, and explanations in this guide are suggested examples for interview preparation, not definitive answers or instructions for professional practice. They are based on research and judgment, are provided without warranties of any kind, and should be adapted to the question, role, and applicable laws and professional requirements. Diagrams are simplified illustrations intended to highlight the main concepts and their relationships; actual situations, systems, and practices may be more complex. Alternative approaches may be equally valid or better suited to a particular question, context, or interviewer. To the fullest extent permitted by applicable law, the contributors and publisher are not liable for decisions made, actions taken, or losses incurred based on this guide.
State Laws and Professional Responsibilities
Laws and requirements governing an occupation vary by state and jurisdiction. You are responsible for checking the current laws, licensing requirements, and scope-of-practice rules that apply to your location and role, and for ensuring that your answers and actions comply with them. Adapt examples in this guide to those requirements. This guide is not legal advice.
Identity, Image, and Privacy Notice
To respect individual privacy, some names, profile photographs, avatars, biographical details, and other identifying information displayed in this guide may be replaced with pseudonyms, licensed stock images, illustrative avatars, composite images, or representative descriptions. Unless a person is expressly identified as an actual contributor, a displayed name, image, or profile should not be understood as depicting or identifying a specific candidate, interviewer, employee, or other real individual. These representations are provided for editorial and illustrative purposes only and do not imply endorsement, employment, participation, or affiliation with this guide or any company mentioned in it. Any resemblance to an actual person is coincidental.
Company Notice
This guide is an independent educational resource and is not affiliated with, endorsed by, sponsored by, or approved by the company named in this guide. Company names identify reported interview experiences or the employer context of clearly labeled original practice exercises. Interview practices can change without notice, and inclusion of company-specific content does not mean these questions are official, complete, or guaranteed to be asked. To the fullest extent permitted by law, the author, contributors, and publisher are not responsible for outcomes related to use of this material.
Content Accuracy and Verification
To the fullest extent permitted by applicable law, we do not represent or warrant that interview guides, questions, answers, examples, or diagrams are accurate, complete, current, error-free, or suitable for any particular purpose. You are responsible for independently reviewing and verifying the information before relying on it.
Questions or comments?
Contact us for general questions, or share feedback, technical corrections, and comments with the community.
11. How would you retrieve Kubernetes logs that are more than one month old?ObservabilityMediumApple
i Question Details
Design the log-retention path required before node-local container logs rotate or disappear. Cover collection, buffering, enrichment with cluster and workload identity, durable storage, retention and indexing, access control, query boundaries, time synchronization, and checks for freshness, gaps, duplicates, and successful retrieval of the older records.
Short Interview Answer (30-60 seconds)
Ship the logs off each Kubernetes node before rotation. Buffer failures, enrich records with cluster and workload metadata, use UTC timestamps, store them durably, and retain searchable indexes long enough. Query the required historical range securely, or restore archived data first, then verify gaps, duplicates, counts, and timestamps.
The main idea is simple: do not expect old records to remain on the machines where they were first created. Copy them to a safe long-term location while they are still available, keep enough information to know where each record came from, and keep them longer than one month. When someone needs older records, search only the needed dates and systems. Also prove that records arrived without missing or repeated entries, that clocks agree, that only approved people can read them, and that an old-record search really works.
Useful Questions to Ask the Interviewer
How long must the logs be retained: 90 days, 180 days, 365 days, or another period?
Must all retained logs remain immediately searchable, or may older records be restored from object storage when needed?
Which sources are in scope: pod stdout and stderr, application sidecars, kubelet and container-runtime logs, system logs, or all of them?
What retrieval latency is acceptable for logs older than one month?
What security, privacy, encryption, regional-storage, or deletion requirements apply?
How to Explain It in an Interview
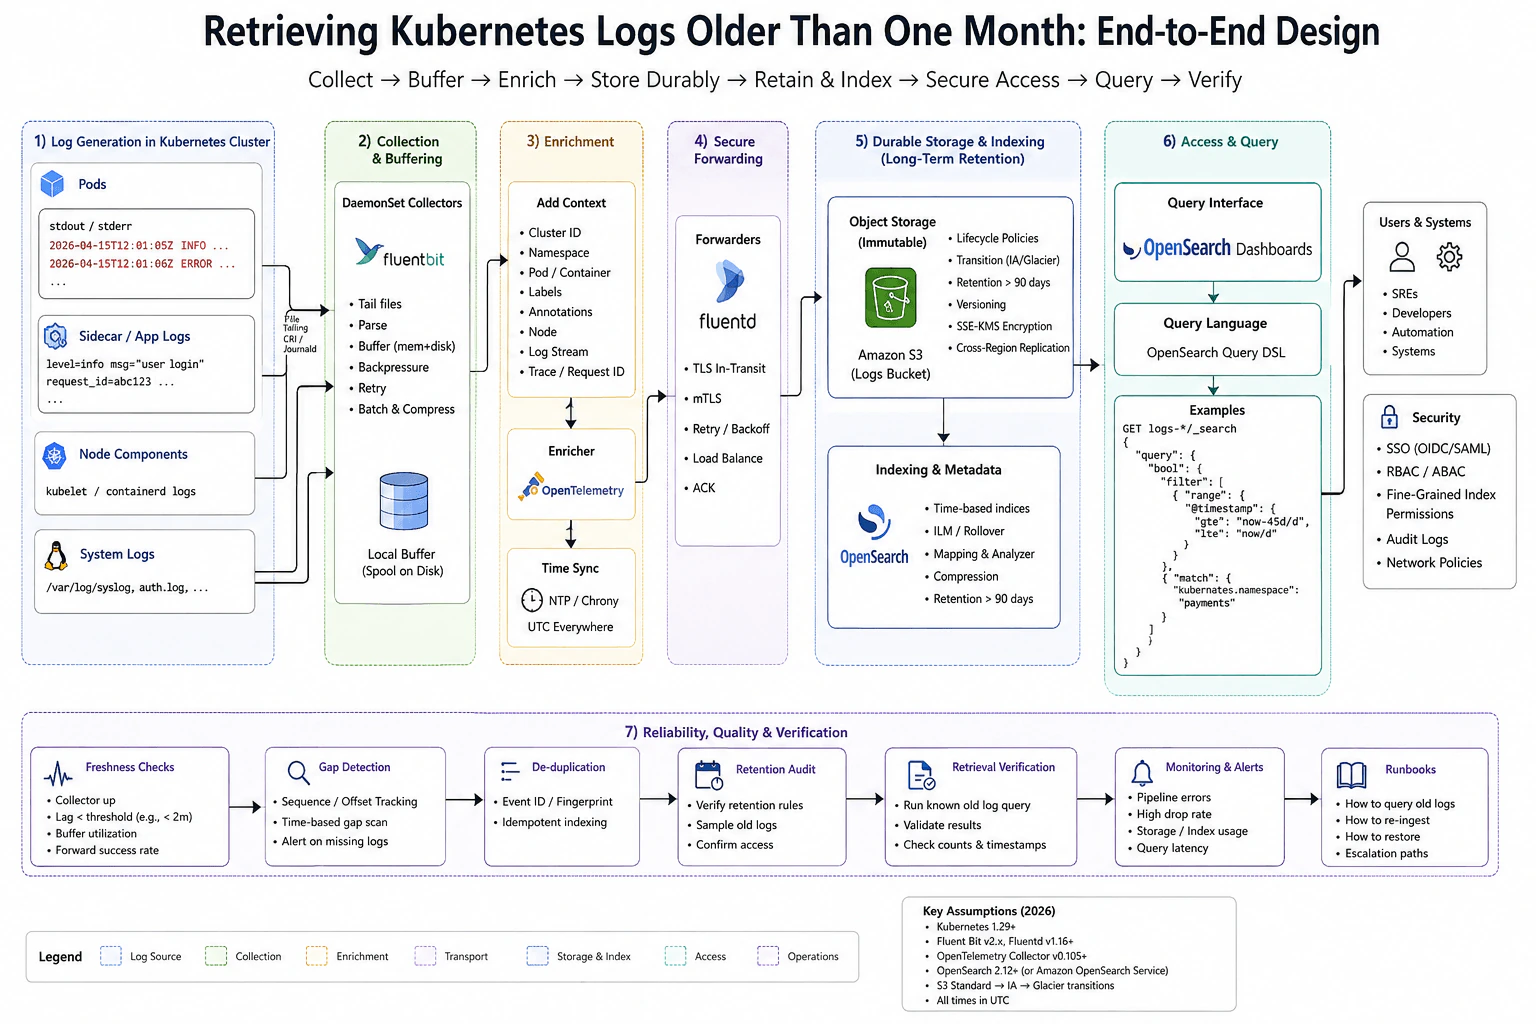
I would start with the retention boundary. Kubernetes nodes are replaceable, and container or node-local log files can rotate long before one month. Therefore, the reliable design is to collect the logs before rotation and make the external logging platform the long-term source of truth.
The diagram uses DaemonSet collectors such as Fluent Bit to tail the required files or journal sources. This includes pod stdout and stderr, sidecar or application logs, kubelet and container-runtime logs, and operating-system logs. The collector parses records, batches and compresses them, applies backpressure, retries failed delivery, and uses a local disk spool so a temporary downstream outage does not immediately lose logs.
I would treat delivery as at-least-once rather than promising exactly-once behavior. That means retries can create duplicates. Stable event identifiers or fingerprints and idempotent indexing are therefore useful for detecting or suppressing repeated records.
Next, enrich each record with stable context. The diagram adds cluster ID, namespace, pod, container, labels, annotations, node, log stream, and trace or request ID when one already exists. These attributes let operators narrow an old-log search to the correct workload. I would control high-cardinality labels because unnecessary unique values increase index size and query cost. Credentials, tokens, personal data, and sensitive payloads should be redacted before long-term retention.
The enrichment path also depends on trustworthy time. Nodes should synchronize clocks with NTP or Chrony, and timestamps should be normalized to UTC. Clock skew can otherwise create apparent gaps, incorrect ordering, and failed time-range searches.
The diagram then securely forwards logs through Fluentd or a similar forwarding layer. Transport uses TLS or mTLS, with retry and backoff, acknowledgements, and load balancing. An OpenTelemetry Collector can participate in enrichment or routing when that matches the platform architecture. The important point is that transport failures are buffered and observable rather than silently dropping data.
For durable retention, the diagram keeps an immutable long-term copy in Amazon S3. Logs can be partitioned by time and workload identity, compressed, encrypted with a managed key, protected with versioning or replication where required, and managed with lifecycle policies. Older objects may transition to lower-cost storage such as infrequent-access or archival tiers. The retention rule must exceed the oldest records the organization may need, such as more than 90 days when month-old retrieval is required.
For fast searches, the diagram uses OpenSearch with time-based indexes, rollover or index lifecycle management, controlled mappings, compression, and index retention longer than 90 days. This searchable copy is separate from the durable archive. Keeping a long period continuously indexed gives faster retrieval but costs more CPU, storage, and indexing capacity. Keeping older records only in object storage is cheaper but increases recovery time because archived data may need restoration or re-ingestion before searching.
Access must also be bounded. The diagram uses SSO with OIDC or SAML, RBAC or ABAC, fine-grained index permissions, network controls, and audit logs. A user should receive only the clusters, namespaces, indexes, and time ranges required for their role.
To retrieve a record more than one month old, I would first determine the exact time window and workload boundary. Then I would run a bounded OpenSearch query against the retained indexes, filtering by timestamp and useful Kubernetes attributes such as namespace. The diagram's example searches a historical range using OpenSearch Query DSL rather than scanning every retained log.
If the requested period is older than the OpenSearch retention window but the objects still exist in S3, I would follow the restore or re-ingest runbook. I would locate only the required time partitions, restore them if their storage class requires it, re-ingest that bounded range into a temporary or designated index, preserve the original timestamps and metadata, run the query, validate the results, and remove the temporary searchable copy according to policy.
Finally, I would verify the complete pipeline instead of trusting configuration alone. The freshness SLI is collector-to-backend lag; an agreed SLO might, for example, require that lag to stay below two minutes. I would also track buffer utilization, forwarding success, drop rate, backlog, storage and index usage, and query latency. Gap detection can use sequence, offset, or time-based checks. Duplicate checks can use event IDs or fingerprints. Retention audits confirm that old data still exists. Most importantly, I would periodically run a known query for records older than 30 days and validate returned counts and timestamps. That proves the system can actually retrieve the data.
Technical Approach
Identify the Kubernetes log sources and determine how quickly their node-local files rotate.
Deploy DaemonSet collectors such as Fluent Bit to tail container, kubelet, runtime, and system log sources before rotation.
Parse, batch, compress, and spool records to local disk so downstream failures can be retried with backpressure instead of immediately dropping data.
Enrich records with cluster ID, namespace, pod, container, labels, annotations, node, log stream, and existing trace or request IDs.
Normalize timestamps to UTC and keep node clocks synchronized with NTP or Chrony.
Securely forward records using TLS or mTLS with retry, backoff, acknowledgements, and load balancing.
Store an immutable durable copy in Amazon S3 with time-based partitioning, encryption, lifecycle policies, and retention longer than one month.
Keep the required searchable period in OpenSearch using time-based indexes, rollover or ILM-style lifecycle management, controlled mappings, and compression.
Enforce SSO, RBAC or ABAC, fine-grained index permissions, network controls, and audit logging.
Retrieve old records with a bounded time-range query plus workload filters such as namespace, cluster, pod, or request ID.
If the requested period is no longer indexed but is still archived, restore or re-ingest only that historical partition into a searchable index.
Verify collector freshness, buffer health, forwarding success, gaps, duplicates, retention, timestamps, permissions, counts, and a known retrieval older than 30 days.
Alert on actionable failures such as pipeline errors, excessive lag, high drop rate, backlog, storage or index pressure, and abnormal query latency.
Practical Insights
The cost grows mainly with log volume and retention. More logs require more collector CPU, network bandwidth, disk buffering, object storage, and indexing capacity. Search work grows with the amount of indexed data examined, so a narrow query for one time range and namespace is much cheaper than an unbounded search. Longer OpenSearch retention gives faster retrieval but costs more than keeping old data only in object storage. Archival tiers reduce storage cost but increase restore time. High-cardinality fields also make indexes larger and harder to maintain, so only useful workload attributes should be indexed.
Code
# Select only the historical window needed instead of scanning the full retention period.# The @timestamp field is the normalized UTC event time used for historical retrieval.# The namespace filter narrows the query to the intended Kubernetes workload boundary.# Authentication is supplied separately through the approved SSO, proxy, or credential mechanism.import json
import urllib.request
query = {
"query": {
"bool": {
"filter": [
{
"range": {
"@timestamp": {
"gte": "now-46d/d",
"lt": "now-45d/d",
}
}
},
{
"term": {
"kubernetes.namespace": "payments",
}
},
]
}
}
}
request = urllib.request.Request(
"https://opensearch.example.invalid/logs-*/_search",
data=json.dumps(query).encode("utf-8"),
headers={"Content-Type": "application/json"},
method="GET",
)
with urllib.request.urlopen(request) as response:
print(response.read().decode("utf-8"))
# Verify the returned records separately by checking expected counts, timestamps, and workload identity.# A successful HTTP request alone does not prove that the retained historical data is complete.
Why Interviewers Ask This
This question tests whether the candidate understands that Kubernetes node-local logs are ephemeral and that historical retrieval must be designed before those files rotate or disappear. It evaluates the full path shown in the diagram: log collection, buffering, enrichment, secure forwarding, durable retention, indexing, access control, bounded querying, time synchronization, verification, and recovery when searchable indexes have expired but archived records still exist.
Common interview mistakes
A common mistake is trying to use kubectl logs after the node-local files have already rotated. Another is configuring a long business-retention requirement while keeping OpenSearch indexes for only 30 days and providing no archive-and-restore path. Other mistakes include having no local spool, assuming at-least-once transport produces no duplicates, omitting cluster or workload identity, indexing uncontrolled high-cardinality labels, using unsynchronized clocks, running unbounded historical searches, storing secrets or personal data, granting broad index permissions, ignoring collector backlog or drops, and assuming successful ingestion proves that records older than one month are actually retrievable.
Interview tip
Lead with the key decision: Kubernetes node-local logs are temporary, so month-old retrieval must be designed before rotation. Then walk through the same flow as the diagram: collect, buffer, enrich, securely forward, store durably, index, control access, query, and verify. Finish with the cost-versus-speed tradeoff between always-searchable indexes and cheaper archived storage.
Interviewer may ask next
What would you do if the requested logs still exist in Amazon S3 but their OpenSearch indexes have already expired?
I would identify the archived objects for the required cluster, workload, and time partitions instead of restoring unrelated history. If the objects are in an archival storage class, I would restore those objects first. Then I would re-ingest only that bounded range into a temporary or designated OpenSearch index, preserving the original UTC timestamps and Kubernetes metadata. I would use stable event identifiers where possible to avoid duplicate indexing, validate record counts and gaps, run the historical query, and remove the temporary searchable copy according to retention and access policy.
How would you prove that the logging pipeline can reliably retrieve Kubernetes logs older than one month?
I would test the complete path. I would measure collector-to-backend lag as a freshness SLI, monitor local buffer utilization, forwarding success, drop rate, backlog, storage and index usage, and query latency. I would use sequence, offset, or time-based checks to detect missing ranges and event IDs or fingerprints to detect duplicates. I would audit retention settings, verify UTC clock synchronization and access permissions, and periodically execute a known query for records older than 30 days. I would validate expected records, counts, timestamps, and workload attributes so retention is proven by successful retrieval rather than configuration alone.
12. How would you move logs and metrics to an ELK or Splunk platform?ObservabilityHardApple
i Question Details
Design an end-to-end telemetry pipeline from applications, containers, hosts, and cloud services into the selected platform. Cover agents or collectors, parsing and schema normalization, metadata enrichment, buffering and backpressure, authentication and encryption, routing and tenancy, indexing, retention, duplicate and loss handling, dashboards, alerts, migration cutover, and signals that prove ingestion remains complete and timely.
Short Interview Answer (30-60 seconds)
I would collect logs and metrics close to each source, normalize and enrich them, buffer for backpressure, secure transport with TLS or mTLS, route by tenant and data type, index into Elasticsearch with lifecycle policies, and validate completeness, latency, duplicates, dashboards, alerts, and cutover before retiring the old path.
Detailed Explanation
The goal is to move useful operating information from every important system into one place without losing it, delaying it too much, or mixing data between teams. I would first decide what must be collected, who owns it, how long it should be kept, and what people need to see when something goes wrong. Then I would build the path in small stages, check each stage with counts and timing, protect private information, and run the old and new paths together until the results match closely enough for a safe switch.
Useful Questions to Ask the Interviewer
Is ELK already selected, or should I also compare the same architecture with Splunk?
Which sources and volumes matter most: applications, Kubernetes, hosts, cloud services, or network infrastructure?
What retention, tenant-isolation, privacy, and regulatory requirements apply?
What ingestion delay and data-loss tolerance are acceptable?
Must migration be zero-downtime, and how long can dual ingestion run?
How to Explain It in an Interview
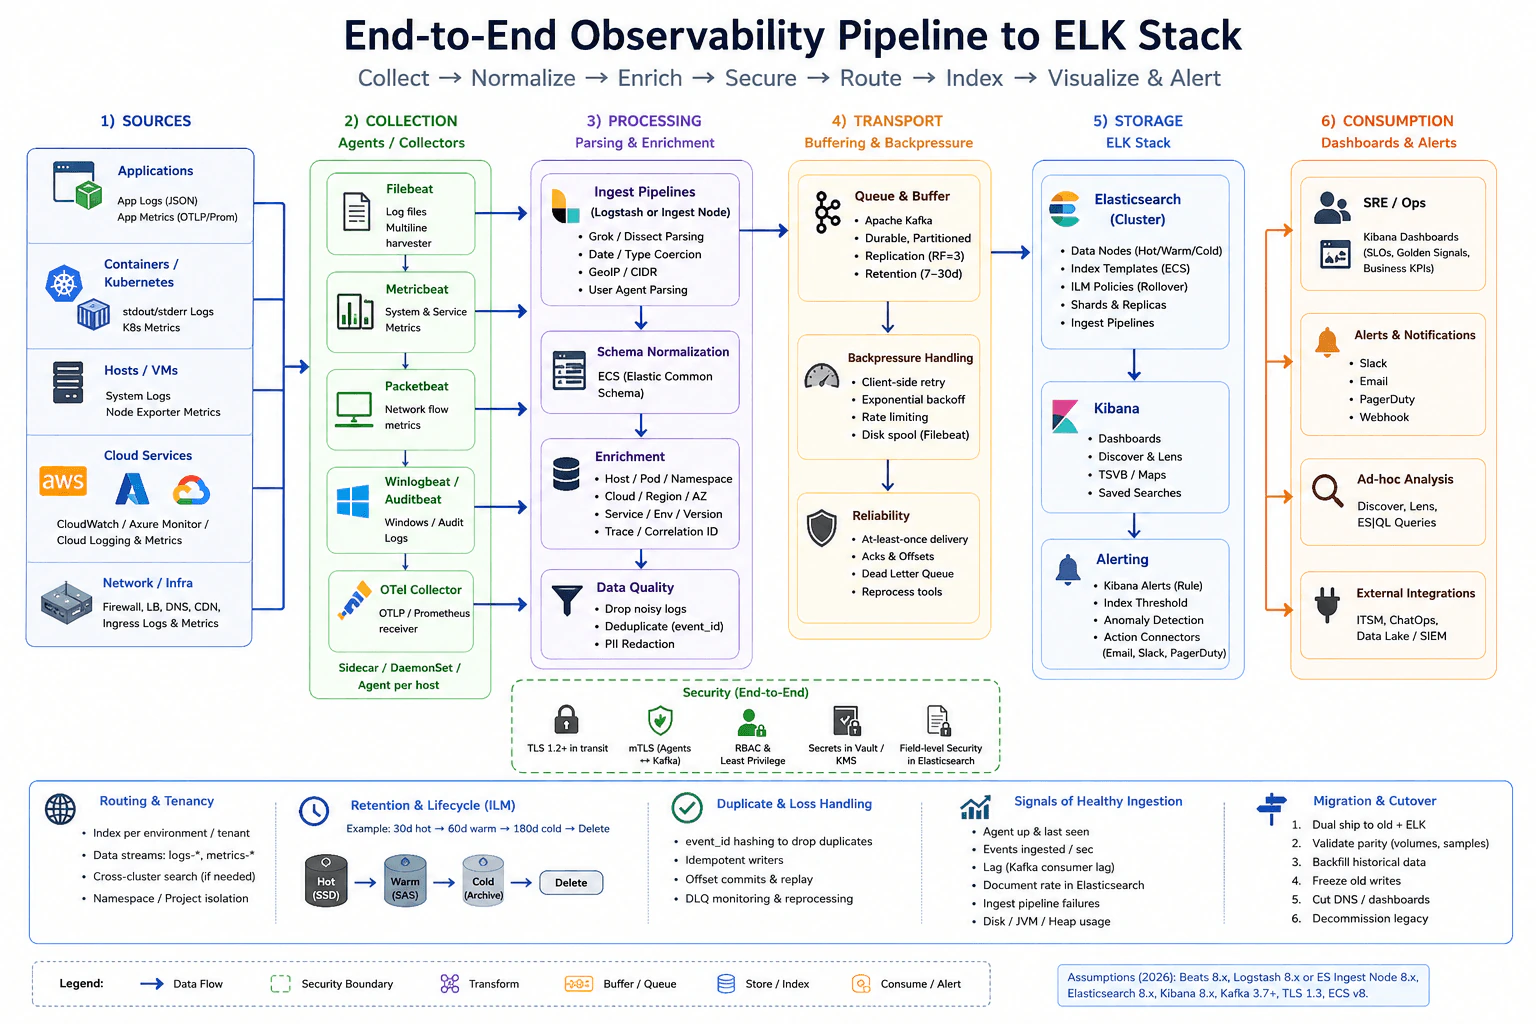
I would draw the system left to right as sources → collectors → processing → durable transport → Elasticsearch → Kibana and alerts, with security, routing, retention, reliability, and migration controls across the pipeline.
Sources. Applications emit structured JSON logs and application metrics. Kubernetes supplies stdout/stderr logs and Kubernetes metrics. Hosts supply system logs and host metrics. Cloud services contribute platform logs and metrics. Network infrastructure such as firewalls, load balancers, DNS, and CDN services contributes network logs or telemetry.
Collection. I would collect telemetry close to its source. The approved diagram uses Filebeat for log files, Metricbeat for system and service metrics, Packetbeat for network protocol or flow telemetry, Winlogbeat or Auditbeat for Windows and audit logs, and an OpenTelemetry Collector where OTLP or Prometheus-compatible input is useful. Agents can run as sidecars, DaemonSets, or host services. Local buffering or disk spooling protects against short downstream interruptions.
Parsing and normalization. Logs pass through Logstash or an Elasticsearch ingest node. Parsing can use grok or dissect, date and type conversion, GeoIP or CIDR handling, and user-agent processing where appropriate. I would normalize fields to a common schema such as ECS so searches and dashboards behave consistently across services. I would redact personal or sensitive information and create a stable event identifier when practical.
Enrichment. Add useful context such as host, pod, namespace, cloud region or availability zone, service, environment, version, trace or correlation ID, and tenant information. These attributes let operators correlate telemetry across application, container, host, and cloud boundaries. I would avoid uncontrolled high-cardinality values because they increase indexing, memory, storage, and query cost.
Buffering and backpressure. For a pipeline that needs durable decoupling and replay, I would place a queue such as Apache Kafka between processing and Elasticsearch. The approved diagram assumes a durable, partitioned, replicated Kafka layer with an example retention of 7-30 days. Producers use retries with exponential backoff, bounded rate controls, and local disk spooling where appropriate. Consumers commit offsets only after successful handling so data can be replayed after a failure.
Reliability and failed records. I would design for at-least-once delivery because retries are safer than silently losing telemetry. At-least-once delivery can create duplicates, so I would use stable event IDs or fingerprints and idempotent indexing when possible. Permanently failed records can go to a dead-letter path for inspection and later reprocessing. I would never silently discard malformed or failed events without a measurable policy.
Security. Encrypt telemetry in transit with TLS and use mTLS where agent or service identity must be authenticated. Store credentials in a secret-management system such as Vault or KMS-backed secret storage, enforce RBAC and least privilege, and redact sensitive data before it reaches the index. Encryption at rest should cover Elasticsearch data and snapshots. The diagram assumes TLS 1.2 or later in transit, with stronger settings such as TLS 1.3 preferred where the deployed components support them.
Routing and tenancy. Route by source, environment, team, tenant, and data type. The diagram shows separate logical streams such as production logs, staging logs, security logs, and metrics. Tenant isolation can use separate data streams or indices combined with access controls. I would avoid creating an excessive number of tiny indices because shard overhead can become expensive. Cross-cluster search can be used when separate clusters are justified.
Indexing and retention. Elasticsearch receives normalized events through data streams, index templates, and ingest pipelines. Shards and replicas are chosen from actual volume, query load, and availability requirements. Index Lifecycle Management moves data through hot, warm, and cold tiers and eventually deletes it. The diagram gives an example of 30 days hot, then 60 days warm, then 180 days cold before deletion. Those numbers are design assumptions, not universal defaults; production retention should follow search needs, compliance requirements, recovery needs, and cost.
Dashboards and alerts. Kibana provides dashboards, Discover and Lens exploration, saved searches, maps where useful, and alerting. Operational dashboards should show service health, SLO or SLI views, business signals where appropriate, and the health of the telemetry pipeline itself. Alerts should be symptom-based and actionable, with ownership, severity, runbook context, and noise controls. Example destinations in the diagram include Slack, email, PagerDuty, and webhooks.
Signals that prove ingestion is complete and timely. I would measure events ingested per second, Kafka consumer lag, Elasticsearch document rate, ingest-pipeline failures, queue depth, disk and JVM pressure, delivery success, drop or error rate per source, expected-source coverage, and freshness from event timestamp to searchable time. No single number proves completeness. I would reconcile counts and representative samples across collection, queue, and indexing boundaries and account for retries, duplicates, late data, and clock skew.
Migration and cutover. I would dual-ship to the old path and ELK first. Then I would compare volumes and representative samples, validate dashboards and alerts, backfill historical data if required, freeze writes or configuration changes to the legacy path near cutover, switch consumers and dashboards to ELK, and keep rollback available. The legacy system should be decommissioned only after the new pipeline remains stable for the agreed validation period.
The main tradeoffs are reliability versus infrastructure cost, retention versus storage cost, richer enrichment versus cardinality, and durable buffering versus extra latency and operational complexity. The diagram's platform assumptions are Beats 8.x, Logstash 8.x or Elasticsearch ingest nodes, Elasticsearch 8.x, Kibana 8.x, Kafka 3.7+, and ECS v8; in a real implementation I would verify the repository-pinned versions and compatibility before deployment. I would define freshness and completeness SLIs and SLOs before choosing alert thresholds so operators can prove that telemetry remains both useful and timely.
Technical Approach
Inventory application, container, host, cloud, and network telemetry sources.
Define required signals, ownership, tenant boundaries, freshness and completeness SLIs/SLOs, privacy rules, and retention requirements.
Deploy source-appropriate agents or collectors with bounded local buffering.
Parse, normalize to ECS or another agreed schema, redact sensitive data, and enrich with service, environment, host, Kubernetes, cloud, correlation, and tenant metadata.
Send through a durable Kafka queue when decoupling, backpressure handling, and replay are required.
Apply TLS or mTLS, secret management, RBAC, least privilege, field-level protections where needed, and encryption at rest.
Route to tenant- and data-type-specific Elasticsearch data streams or indices.
Apply index templates, shard and replica settings, and ILM retention tiers.
Use at-least-once delivery, offsets, dead-letter handling, stable event IDs, deduplication, idempotent writes, and replay to control loss and duplicates.
Build Kibana dashboards and actionable alert rules.
Dual-run the old and new pipelines, compare counts and samples, backfill if necessary, cut over with rollback available, and decommission the old path only after validation.
Practical Insights
The main cost grows with how much telemetry is produced, how much processing is done, and how long the data is retained. More events increase network traffic, Kafka storage, Elasticsearch indexing work, disk usage, and query cost. More replicas and longer queue retention improve resilience but use more storage. Rich metadata makes investigation easier, but high-cardinality fields can increase memory and index size. Parsing rules, routing paths, tenant isolation, and lifecycle policies also add maintenance work. A durable queue adds another service and some latency, but it absorbs bursts, applies backpressure, and gives operators a reliable replay point when downstream systems fail.
Why Interviewers Ask This
This question tests whether the candidate can design a production telemetry pipeline rather than only name observability products. The interviewer is evaluating collection strategy, parsing and schema design, metadata enrichment, buffering and backpressure, security, routing and tenancy, indexing and retention, duplicate and loss handling, operational visibility, and migration judgment. It also tests whether the candidate knows how to prove that ingestion is complete and timely instead of assuming that a healthy Elasticsearch cluster means every source is being collected correctly.
Common interview mistakes
Common mistakes include sending every source directly to Elasticsearch with no backpressure plan; using different schemas for each team; omitting service, environment, host, tenant, or correlation metadata; allowing high-cardinality fields to grow without control; storing credentials inside agent configuration; sending sensitive payloads without redaction; assuming at-least-once delivery means exactly-once delivery; silently dropping malformed records; creating too many small indices or shards; choosing retention without compliance and cost inputs; monitoring only Elasticsearch while missing upstream collection gaps; treating one healthy metric as proof of complete ingestion; ignoring clock skew when measuring freshness; and retiring the legacy pipeline before dual-run validation and rollback are complete.
Interview tip
Explain the architecture in the same order as the diagram: sources → collection → parsing and normalization → enrichment → buffering and backpressure → routing and tenancy → Elasticsearch → Kibana and alerts. Then cover security, retention, duplicates and loss, ingestion-health signals, and migration. State that Kafka retention and hot/warm/cold periods are examples, not universal defaults, and finish by explaining exactly how you would prove completeness and freshness.
Interviewer may ask next
How would you prevent data loss if Elasticsearch becomes slow or unavailable?
I would decouple producers from Elasticsearch with a durable queue such as Kafka when the reliability requirement justifies it. Collectors can use bounded local disk spooling for shorter interruptions. Consumers commit offsets only after successfully handling records and retry with exponential backoff rather than overwhelming Elasticsearch. Permanently failed records can move to a dead-letter path for inspection and reprocessing. After recovery, consumers replay from committed offsets. I would monitor queue depth, consumer lag, oldest-event age, local spool usage, indexing rate, delivery failures, and drop counters. Because retries can duplicate events, I would also use stable event IDs or fingerprints and idempotent indexing where practical.
How would you prove that the new ELK pipeline is complete and timely during migration?
I would dual-run the legacy pipeline and ELK and compare source counts, queue counts, indexed document counts, and representative samples for important services and tenants. I would measure freshness from event timestamp to searchable time, consumer lag, delivery success, drop/error rate, ingest-pipeline failures, queue depth, Elasticsearch document rate, and expected-source coverage. I would send known test events to validate dashboards and alerts. Any unexplained mismatch is investigated before cutover. Once parity meets the agreed completeness and freshness objectives, I would switch consumers and dashboards while keeping rollback available, continue monitoring the same indicators, and decommission the old pipeline only after the new path remains stable for the required validation period.
Disclaimer: This interview guide is for educational and informational purposes only. It is designed to help readers prepare, but it does not guarantee any interview result, hiring decision, offer, or outcome. Interview questions, hiring criteria, and preferred answers can vary by employer, interviewer, industry, location, and time. All answers, examples, and explanations in this guide are suggested examples for interview preparation, not definitive answers or instructions for professional practice. They are based on research and judgment, are provided without warranties of any kind, and should be adapted to the question, role, and applicable laws and professional requirements. Diagrams are simplified illustrations intended to highlight the main concepts and their relationships; actual situations, systems, and practices may be more complex. Alternative approaches may be equally valid or better suited to a particular question, context, or interviewer. To the fullest extent permitted by applicable law, the contributors and publisher are not liable for decisions made, actions taken, or losses incurred based on this guide.
State Laws and Professional Responsibilities: Laws and requirements governing an occupation vary by state and jurisdiction. You are responsible for checking the current laws, licensing requirements, and scope-of-practice rules that apply to your location and role, and for ensuring that your answers and actions comply with them. Adapt examples in this guide to those requirements. This guide is not legal advice.
Company Notice: This guide is an independent educational resource and is not affiliated with, endorsed by, sponsored by, or approved by the company named in this guide. Company names identify reported interview experiences or the employer context of clearly labeled original practice exercises. Interview practices can change without notice, and inclusion of company-specific content does not mean these questions are official, complete, or guaranteed to be asked. To the fullest extent permitted by law, the author, contributors, and publisher are not responsible for outcomes related to use of this material.
Content Accuracy and Verification: To the fullest extent permitted by applicable law, we do not represent or warrant that interview guides, questions, answers, examples, or diagrams are accurate, complete, current, error-free, or suitable for any particular purpose. You are responsible for independently reviewing and verifying the information before relying on it.