1. What metrics would you track for a new streaming-media feature used across multiple device types?
Define the intended outcome, eligibility, exposure, user or household unit, and observation window. Select one primary metric plus supporting measures for discovery, starts, completion, repeat use, retention, playback quality, latency, crashes, and complaints. Explain how device mix, account sharing, autoplay, background activity, and instrumentation gaps affect denominators, and specify device-level and cross-device slices and guardrails.
I would use completed view rate among exposed users as the primary metric, then track discovery, starts, repeat use, retention, quality, latency, crashes, and complaints. I would define exposure and the user or household unit carefully, use metric-specific denominators, segment by device, and monitor guardrails.
I would start by defining what success means before calculating any metric. For this feature, a reasonable goal is more meaningful watching of the new feature, such as completed views and repeat use, without harming playback quality. I would define which users are eligible, what event counts as feature exposure, whether one user or one household is the analysis unit, and a fixed observation window such as 7 or 28 days. Then I would select one primary metric and supporting metrics, use the right denominator for each, and inspect device-specific and cross-device results.
- What user behavior is the feature intended to improve: discovery, playback starts, completed viewing, repeat use, or something else?
- Which users or accounts are eligible to see the feature, and on which device types or app versions?
- What exactly counts as exposure: an impression, a visible feature placement, or another logged event?
- Should the analysis unit be an individual user, an account, or a household when several people may share an account?
- What observation window should we use after exposure, such as 7 days, 28 days, or the full release period?
- Are exposure and playback events implemented consistently across TV, web, mobile, and tablet?
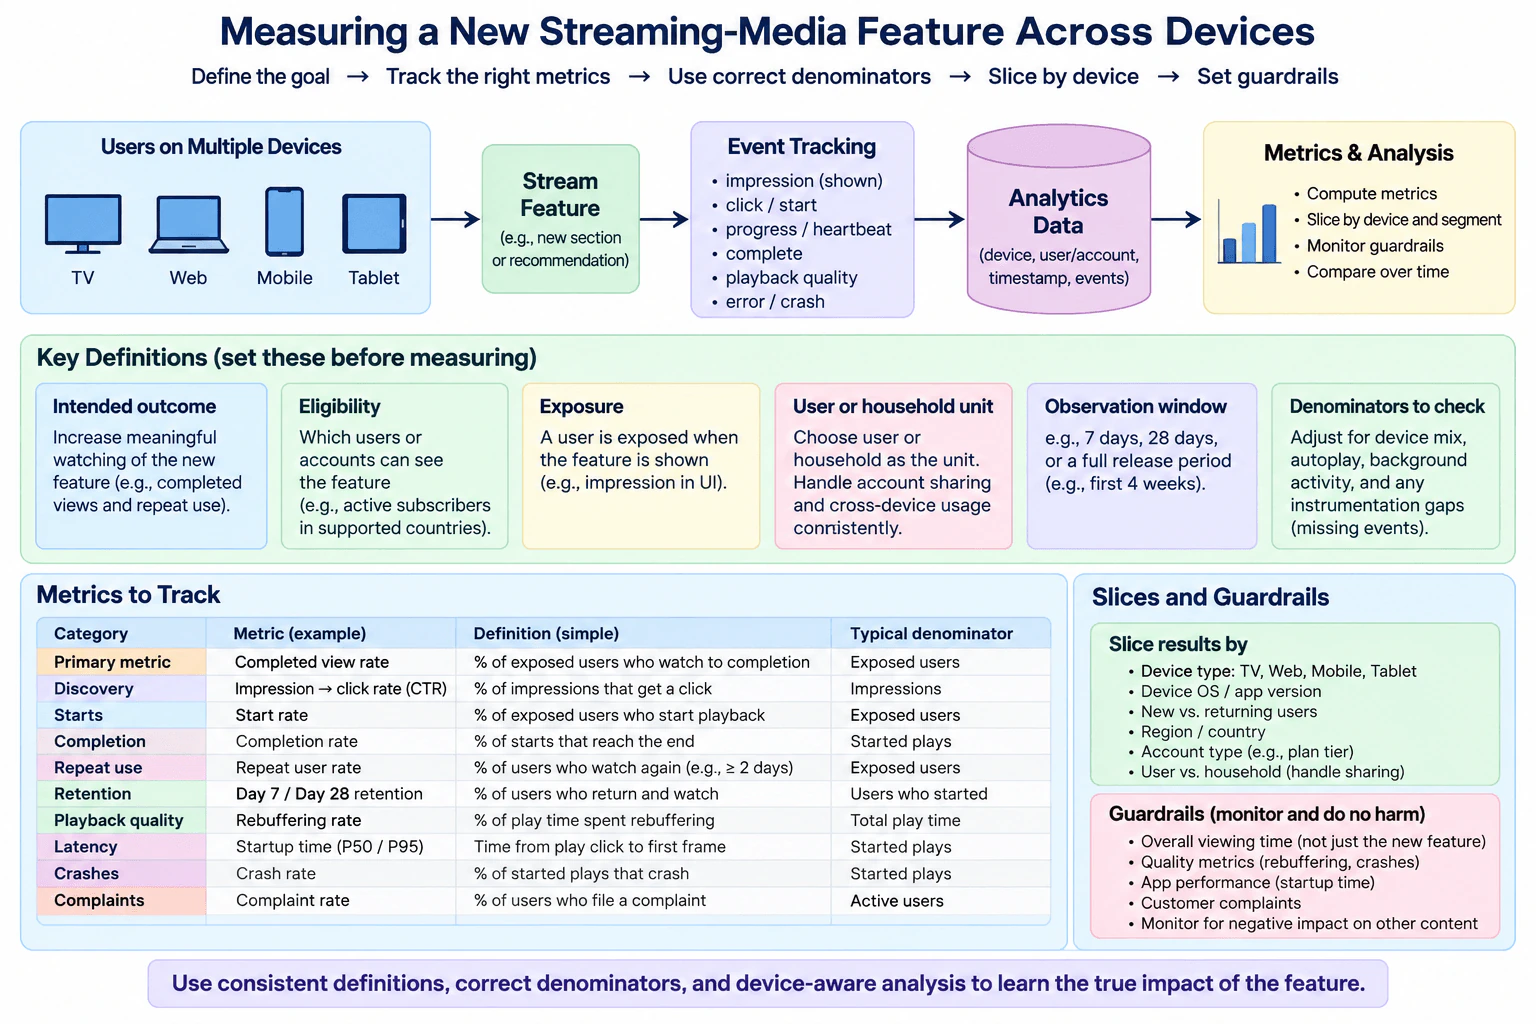
I would organize the evaluation from definitions to metrics, then slices and guardrails.
First, I would define the intended outcome. The feature should increase meaningful engagement with the content it helps users discover or play, not simply create more UI interactions. I would therefore choose completed view rate among exposed users as the primary metric. The numerator is exposed users who complete a view, and the denominator is exposed users. This connects feature exposure to meaningful watching.
Next, I would define eligibility and exposure. Eligibility means the users or accounts that could actually receive the feature, such as users on supported devices or app versions. Exposure means the feature was actually shown, for example through a logged impression. I would not mix eligible but unexposed users into an exposure-based denominator unless the evaluation design specifically calls for that population.
I would also decide the analysis unit before aggregating. A user-level metric is useful when users are reliably identified across devices. A household or account-level view may be more appropriate when account sharing makes individual identity unreliable. I would use the chosen unit consistently across the analysis so the same activity is not treated as several independent users simply because it happened on several devices.
I would set a fixed observation window, such as 7 or 28 days after exposure, depending on the expected usage cycle. Compared users should receive the same opportunity to generate the measured outcome.
For supporting metrics, I would track the full path from discovery through experience quality. Discovery can use impression-to-click rate, with impressions as the denominator. Start rate can use exposed users as the denominator. Completion rate can use started plays because it asks what fraction of starts reach the end. Repeat-use rate can measure the fraction of exposed users who return and watch again, for example on at least two days. Retention can measure the fraction of users who started and are still returning and watching at a later point such as day 7 or day 28.
I would then add technical quality metrics. Rebuffering rate can be measured as the fraction of total play time spent rebuffering. Startup latency can measure time from the play action to the first rendered frame and can be summarized with percentiles such as P50 and P95 instead of only an average. Crash rate can use started plays as the denominator. Complaint rate can use active users as the denominator. The exact denominator should be written next to every metric because changing it changes the metric's meaning.
Several streaming behaviors can distort those denominators. Device mix matters because sessions and viewing patterns can differ across TV, web, mobile, and tablet. Account sharing means one account may represent several viewers. Autoplay can inflate starts that do not reflect deliberate user intent. Background playback or background app activity can create apparent engagement when the user is not actively watching. Instrumentation gaps can make one device look better or worse simply because events are missing. I would therefore validate event completeness, deduplicate where needed, and compare equivalent event definitions before trusting cross-device differences.
I would slice results by device type: TV, web, mobile, and tablet. I would also inspect device operating system or app version, new versus returning users, region or country, account type, and user versus household aggregation when those dimensions are available. For cross-device analysis, I would compare single-device and multi-device users and examine whether account sharing changes the interpretation.
Finally, I would use guardrails. I would monitor overall viewing behavior, not only activity inside the new feature. I would check rebuffering, crashes, startup latency, customer complaints, and negative effects on other content. A rise in the primary metric would not be a convincing success if it came with materially worse playback quality or reliability.
The main limitation is that descriptive metrics alone do not prove that the feature caused the observed change. Device populations can differ in behavior and usage context. If causal impact is required, I would use an appropriate controlled experiment or another defensible causal design while keeping the same metric definitions, device slices, cross-device slices, and guardrails.
- Define the intended outcome in user terms, such as meaningful completed viewing and repeat use.
- Define the eligible population and the exact exposure event.
- Choose one consistent analysis unit: user, account, or household.
- Fix an observation window after exposure.
- Use completed view rate among exposed users as the primary metric.
- Add discovery, start, completion, repeat-use, retention, playback-quality, latency, crash, and complaint metrics.
- Write the numerator and denominator for every metric before calculating it.
- Check whether device mix, account sharing, autoplay, background activity, duplicate events, or missing instrumentation bias those denominators.
- Slice results by device and relevant cross-device cohorts.
- Review guardrails such as overall viewing, rebuffering, startup latency, crashes, complaints, and impact on other content before deciding whether the feature is successful.
The calculations themselves are usually simple aggregations, but trustworthy measurement can be harder. More device and cohort slices increase data volume and analysis work. Cross-device identity can require extra joining and deduplication. Household-level analysis reduces some account-sharing problems but loses individual-level detail. Longer observation windows capture retention better but delay decisions. Very fine slices can also become noisy because each group has fewer observations. Instrumentation checks add engineering cost, but without them a missing event on one device can be mistaken for a real product difference.
This question tests whether I can turn a broad product goal into a trustworthy measurement plan. The interviewer wants to see whether I choose a meaningful primary metric, use correct denominators, distinguish engagement from technical quality, define the analysis unit and observation window, handle cross-device behavior and instrumentation problems, and use guardrails so an apparent product win does not hide a worse overall user experience.
Common mistakes are choosing clicks or starts as the only success metric, using one denominator for every metric, counting eligible users as exposed users, mixing user-level and household-level aggregation, treating autoplay starts as deliberate engagement, counting background activity as active watching, comparing devices without checking event coverage, relying only on averages for latency, ignoring account sharing, and declaring success from engagement while crashes, rebuffering, complaints, or overall viewing become worse. Another mistake is treating descriptive cross-device differences as causal evidence without an appropriate evaluation design.
Start with the measurement contract: outcome, eligibility, exposure, analysis unit, and observation window. Then name one primary metric and walk through supporting metrics with their denominators. Finish with device and cross-device slices, denominator risks, and guardrails. This shows that you are measuring user value rather than simply listing metrics.