This interview guide is for educational and informational purposes only. It is designed to help readers prepare, but it does not guarantee any interview result, hiring decision, offer, or outcome. Interview questions, hiring criteria, and preferred answers can vary by employer, interviewer, industry, location, and time. All answers, examples, and explanations in this guide are suggested examples for interview preparation, not definitive answers or instructions for professional practice. They are based on research and judgment, are provided without warranties of any kind, and should be adapted to the question, role, and applicable laws and professional requirements. Diagrams are simplified illustrations intended to highlight the main concepts and their relationships; actual situations, systems, and practices may be more complex. Alternative approaches may be equally valid or better suited to a particular question, context, or interviewer. To the fullest extent permitted by applicable law, the contributors and publisher are not liable for decisions made, actions taken, or losses incurred based on this guide.
State Laws and Professional Responsibilities
Laws and requirements governing an occupation vary by state and jurisdiction. You are responsible for checking the current laws, licensing requirements, and scope-of-practice rules that apply to your location and role, and for ensuring that your answers and actions comply with them. Adapt examples in this guide to those requirements. This guide is not legal advice.
Identity, Image, and Privacy Notice
To respect individual privacy, some names, profile photographs, avatars, biographical details, and other identifying information displayed in this guide may be replaced with pseudonyms, licensed stock images, illustrative avatars, composite images, or representative descriptions. Unless a person is expressly identified as an actual contributor, a displayed name, image, or profile should not be understood as depicting or identifying a specific candidate, interviewer, employee, or other real individual. These representations are provided for editorial and illustrative purposes only and do not imply endorsement, employment, participation, or affiliation with this guide or any company mentioned in it. Any resemblance to an actual person is coincidental.
Company Notice
This guide is an independent educational resource and is not affiliated with, endorsed by, sponsored by, or approved by the company named in this guide. Company names identify reported interview experiences or the employer context of clearly labeled original practice exercises. Interview practices can change without notice, and inclusion of company-specific content does not mean these questions are official, complete, or guaranteed to be asked. To the fullest extent permitted by law, the author, contributors, and publisher are not responsible for outcomes related to use of this material.
Content Accuracy and Verification
To the fullest extent permitted by applicable law, we do not represent or warrant that interview guides, questions, answers, examples, or diagrams are accurate, complete, current, error-free, or suitable for any particular purpose. You are responsible for independently reviewing and verifying the information before relying on it.
Questions or comments?
Contact us for general questions, or share feedback, technical corrections, and comments with the community.
61. Implement a function that reports how many arguments it received.CodingEasy
i Question Details
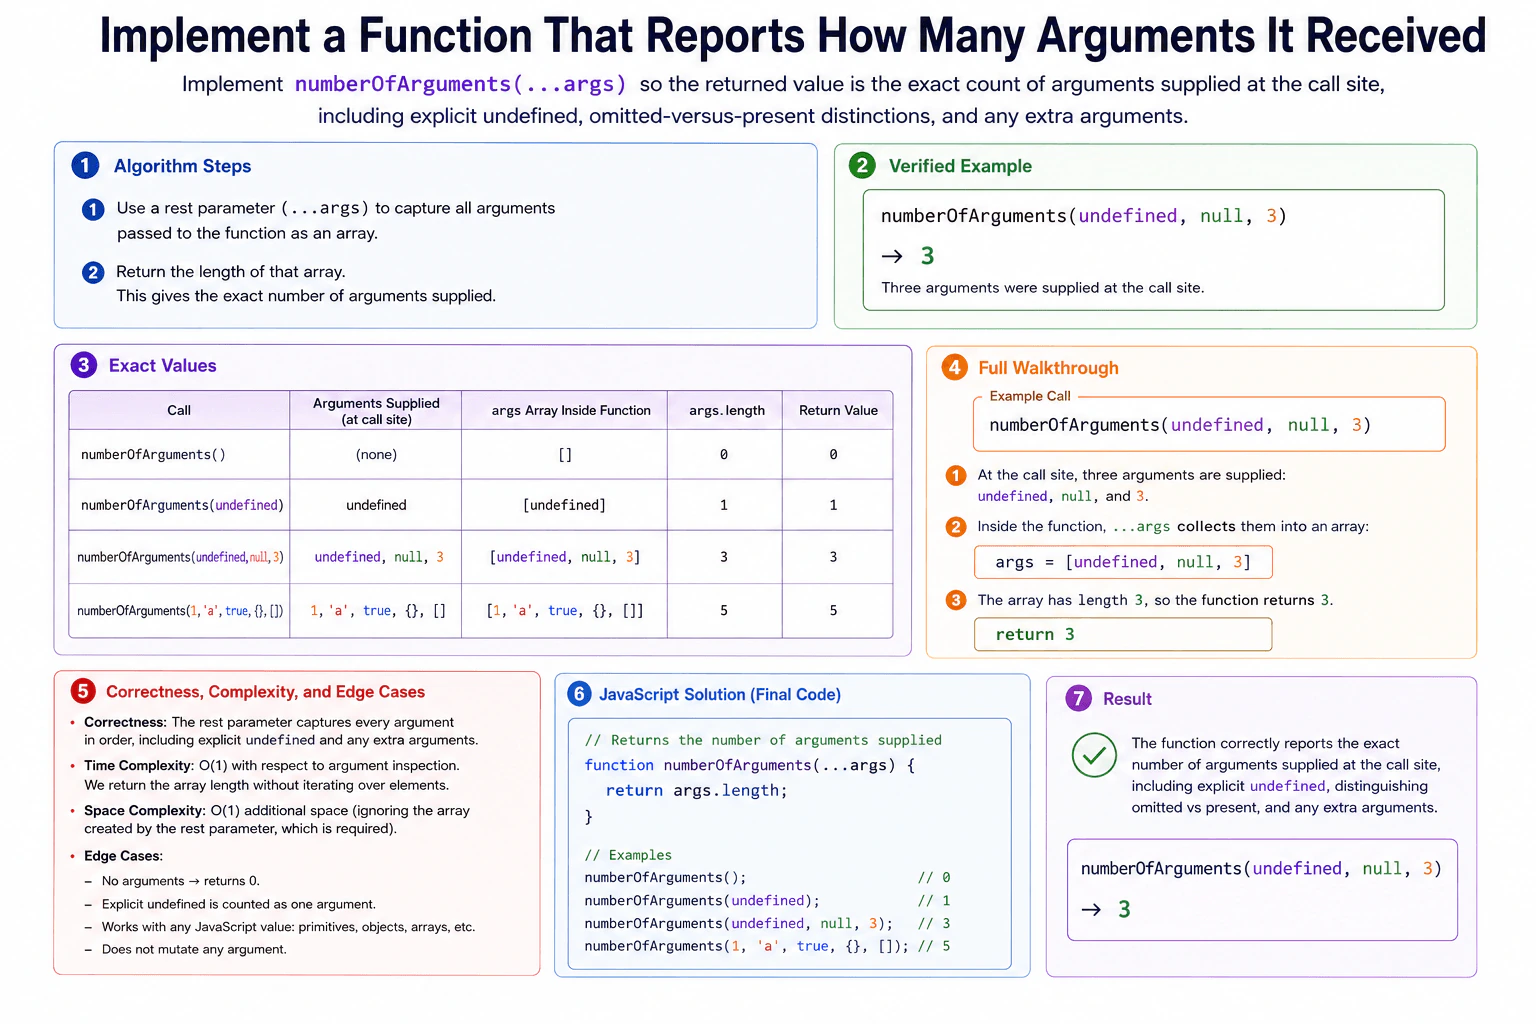
Implement numberOfArguments(...args) so the returned value is the exact count of arguments supplied at the call site, including explicit undefined, omitted-versus-present distinctions, and any extra arguments. The function accepts arbitrary JavaScript values and must not inspect parameter names, function .length, or the caller. Use no external helpers. Examples: numberOfArguments() returns 0; numberOfArguments(undefined, null, 3) returns 3. The operation should run in O(1) time with respect to argument inspection and must not mutate any argument.
Short Interview Answer (30-60 seconds)
I would use a rest parameter so the function receives every supplied argument in one array called args. JavaScript keeps explicit undefined values in that array, so the exact number of supplied arguments is args.length. I do not need to inspect the values, parameter names, function .length, or the caller. I simply return args.length. Reading the count takes O(1) time with respect to argument inspection and O(1) additional space beyond the required rest-parameter array.
The function needs to report how many values were actually supplied when it was called. A value still counts when that value is undefined or null. Extra arguments also count. The simple idea is to collect every supplied argument into one array and return that array's length. JavaScript rest parameters do exactly this. For numberOfArguments(undefined, null, 3), the collected array is [undefined, null, 3], so its length and the returned result are both 3.
Useful Questions to Ask the Interviewer
Should an explicit undefined value count as an argument? Yes, the question says it should.
Should the function accept any number and type of JavaScript values? Yes, including extra arguments.
How to Explain It in an Interview
1. Understand the input and required output
The input is any number of JavaScript values supplied at the call site. The output is one number: the exact count of those supplied arguments. Calling the function with no arguments returns 0. Passing undefined still adds one argument because that value was explicitly supplied.
2. Choose the JavaScript feature
Use a rest parameter written as ...args. JavaScript collects all supplied arguments into the args array. This keeps the important difference between an omitted argument and an explicit undefined argument. The central rule is simple: every supplied argument becomes one element in args.
3. Walk through the verified example
Call numberOfArguments(undefined, null, 3). Three arguments are supplied at the call site. Inside the function, ...args creates [undefined, null, 3]. The array has length 3. The function reads args.length and returns 3. No argument value is inspected or changed.
4. Explain why the result is correct
The rest parameter creates one array element for every argument supplied at the call site. Therefore, args.length is exactly the number of supplied arguments. Explicit undefined is still one array element. A completely omitted argument creates no element. Any extra arguments are also collected and counted.
5. Explain the JavaScript implementation
The function declaration uses ...args to collect all supplied values. There is no loop and no condition because the actual values do not matter. The function reads the length property of the collected array and immediately returns it. It does not inspect parameter names, function .length, the caller, or the contents of the arguments.
6. Explain complexity and edge cases
Reading args.length is O(1) with respect to argument inspection because the function does not scan the argument values. The diagram describes O(1) additional space beyond the rest-parameter array created by JavaScript. Important cases are zero arguments, explicit undefined, arbitrary JavaScript values, extra arguments, and not mutating any supplied argument.
Key Insight / Why This Solution Works
The key insight is that a JavaScript rest parameter already records exactly which arguments were supplied. The function declares ...args, so each supplied argument becomes one element of the args array. The invariant is that args.length equals the number of arguments supplied at the call site. Because the answer is already available as the array length, there is no need to inspect values or loop through them. Returning args.length directly gives the required count.
Code
functionnumberOfArguments(...args) {
// The rest parameter collects every argument supplied at the call site.// Explicit undefined values are included because they were actually supplied.// The array length is the exact number of received arguments.// Reading length does not inspect or mutate any argument value.return args.length;
}
// Run the same verified example shown in the diagram.const result = numberOfArguments(undefined, null, 3);
// The call supplied three arguments, so this prints 3.console.log(result);
Time & Space Complexity
Time is O(1) with respect to argument inspection. The function only reads the array's length property and does not loop through the argument values. The diagram describes O(1) additional space beyond the args array created by the required rest parameter. The function itself creates no other data structure that grows with the number of arguments.
Where it is used
This pattern is useful in JavaScript functions that accept a variable number of inputs. Examples include utility functions, logging helpers, wrappers, adapters, and APIs that need to know how many values were supplied. A rest parameter is useful when the function needs access to the actual supplied arguments or their exact count.
Why Interviewers Ask This
The interviewer is checking whether the candidate understands JavaScript rest parameters and the difference between declared parameters and arguments actually supplied at runtime. The question also tests whether the candidate notices that explicit undefined still counts as a supplied argument. A strong answer avoids unnecessary loops, does not misuse function .length, does not inspect the caller, preserves arbitrary values, and explains the O(1) argument-inspection cost accurately.
Common interview mistakes
A common mistake is using the function's .length property. That reports the number of declared parameters, not the number supplied at a particular call site. Another mistake is treating explicit undefined as if the argument were omitted. It must still count. Candidates may also loop through args even though only args.length is needed. Another mistake is inspecting the caller or parameter names, which the question forbids. The function also must not mutate any supplied argument.
Interview tip
State the key distinction early: omitted and explicit undefined are different at the call site. Then show that ...args preserves this distinction automatically, so returning args.length is enough.
Interviewer may ask next
What changes if the function must also return the received arguments?
The same rest parameter can be used. Instead of returning only args.length, the function could return an object such as { count: args.length, args }. The argument-count calculation is still O(1) with respect to inspection because no values need to be scanned. The main tradeoff is that the result now exposes the collected arguments instead of only the count.
Why not use numberOfArguments.length to get the argument count?
Function .length describes the function's declared parameter structure, not how many arguments a specific call supplied. For a function declared with only a rest parameter, numberOfArguments.length is 0 even when the caller supplies several values. The rest array reflects the actual call, so args.length correctly distinguishes zero supplied arguments from explicit undefined and from any number of extra arguments.
62. Implement an awaitable sleep utility.CodingEasy
i Question Details
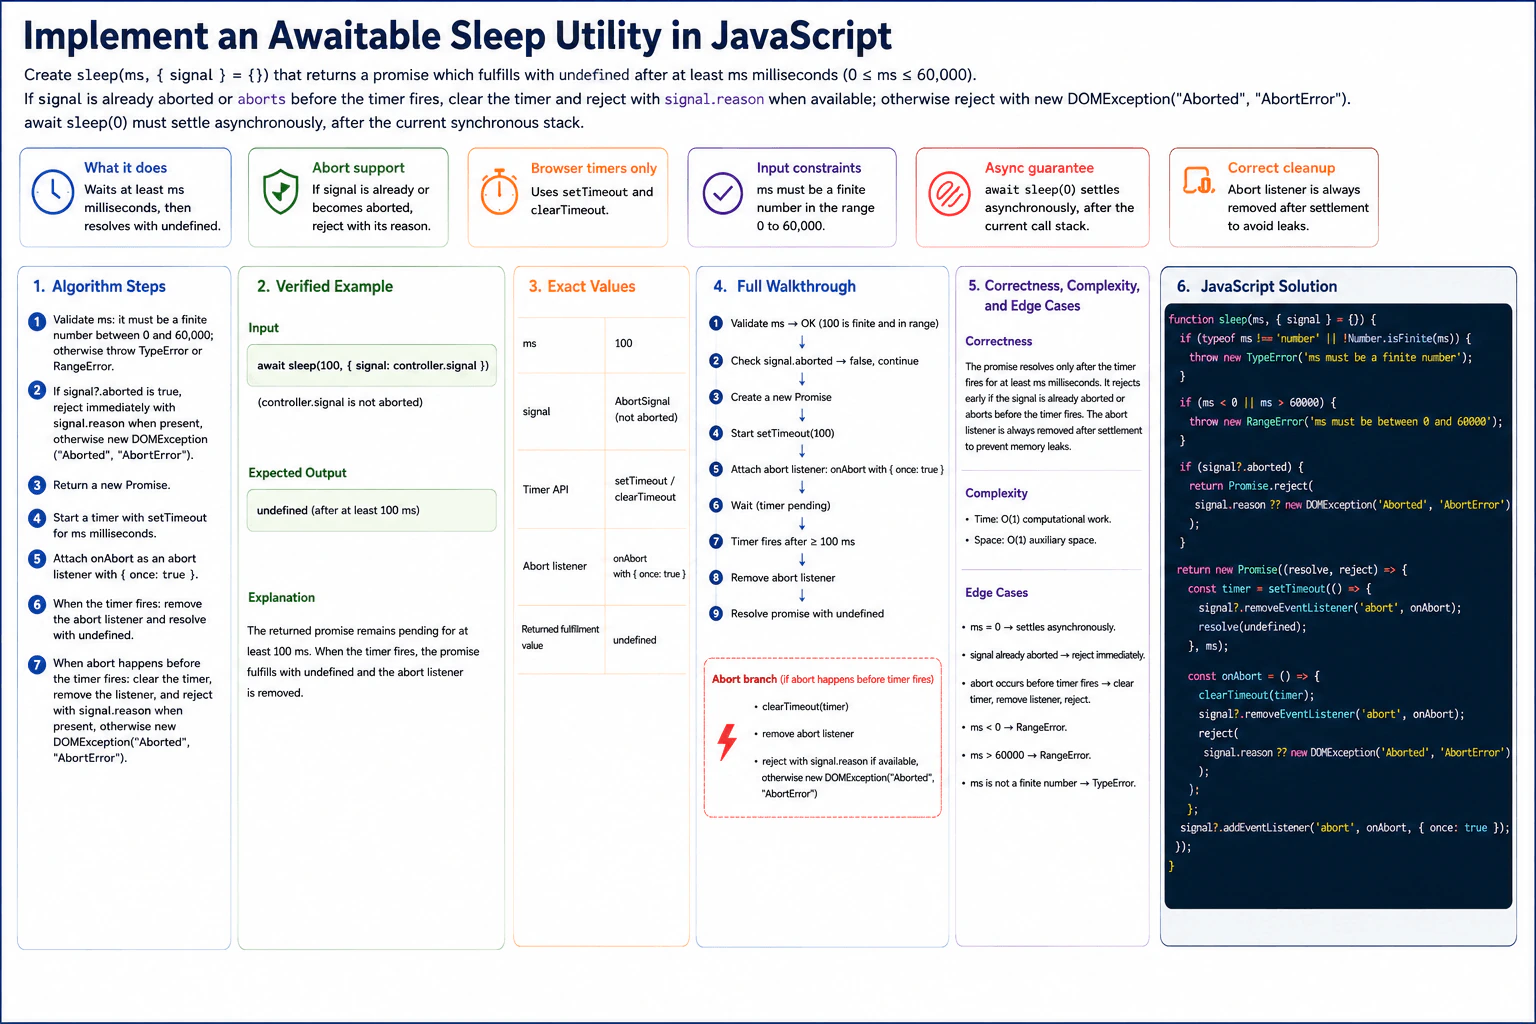
Create sleep(ms, { signal } = {}) that returns a promise fulfilling with undefined after at least ms milliseconds. ms must be a finite number from 0 through 60,000. Use browser timers only. If signal is already aborted or becomes aborted before the timer fires, clear the timer and reject with the signal's reason when available; remove any abort listener after settlement. Reject invalid delays with TypeError or RangeError. Example: await sleep(0) must settle asynchronously, after the current synchronous stack. No global state or third-party package is allowed.
Short Interview Answer (30-60 seconds)
I would validate the delay first, then check whether the optional signal is already aborted. If it is valid, I return a Promise, start a browser setTimeout, and attach one abort listener. If the timer fires first, I remove the listener and resolve with undefined. If abort happens first, I clear the timer, remove the listener, and reject with the abort reason. The computational work is O(1), and the auxiliary space is O(1).
The goal is to create a small sleep function for browser JavaScript. It waits for a requested delay and then finishes with undefined. The delay must be a finite number from 0 through 60,000. The caller may also provide a cancellation signal. If cancellation has already happened, or happens before the wait finishes, the function rejects instead. This approach fits because a browser timer handles the delay, while one cancellation listener handles the optional early stop.
Useful Questions to Ask the Interviewer
Should values such as strings, NaN, Infinity, negative numbers, and values above 60,000 be rejected? Yes. The contract requires that behavior.
If the AbortSignal has a reason, should that exact reason be used for rejection? Yes. Otherwise, the diagram uses new DOMException("Aborted", "AbortError").
How to Explain It in an Interview
1. Validate the input
First, I check ms. It must be a JavaScript number and it must be finite. If either check fails, I throw TypeError. Then I check the allowed range. A value below 0 or above 60,000 throws RangeError. A delay of 0 is valid.
2. Handle an already-aborted signal
Before creating the timer, I check signal?.aborted. If it is already true, I return a rejected Promise immediately. I reject with signal.reason when it is available. Otherwise, I use new DOMException("Aborted", "AbortError").
3. Create the promise and start the timer
The diagram uses await sleep(100, { signal: controller.signal }), where controller.signal is not aborted. I create a new Promise and start setTimeout for 100 milliseconds. The Promise remains pending while the timer is waiting.
4. Attach the abort listener
After starting the timer, I define onAbort and attach it with { once: true }. If abort happens before the timer fires, onAbort clears the timer, removes the abort listener, and rejects with signal.reason or the AbortError fallback.
5. Finish the verified example
In the diagram example, no abort happens. After at least 100 milliseconds, the timer callback runs. It removes the abort listener and resolves the Promise with undefined. Therefore, the exact result is undefined after at least 100 milliseconds.
6. Explain why it is correct
While the Promise is pending, this call has one timer and at most one abort listener. The timer path resolves the Promise only after the requested delay. The abort path cancels the pending timer and rejects instead. Each path removes the listener as part of cleanup. A Promise can settle only once, so only one final result is observed.
7. Explain complexity and edge cases
The function does a fixed amount of computational work, so its computational complexity is O(1). Its auxiliary space is O(1). sleep(0) is valid and still settles asynchronously because setTimeout runs its callback after the current synchronous stack. Other important cases are an already-aborted signal, an abort before the timer fires, a negative delay, a delay above 60,000, and a non-finite delay.
Key Insight / Why This Solution Works
The key idea is to let one browser timer and one optional AbortSignal control the same Promise. First, validate ms and handle an already-aborted signal. Then create the Promise, start setTimeout, and attach one abort listener. The central invariant is that while the Promise is pending, the call owns at most one active timer and one abort listener. If the timer wins, remove the listener and resolve with undefined. If abort wins, clear the timer, remove the listener, and reject. Promise settlement guarantees that only one outcome becomes the result.
Code
functionsleep(ms, { signal } = {}) {
// Reject values that are not finite JavaScript numbers.if (typeof ms !== 'number' || !Number.isFinite(ms)) {
thrownewTypeError('ms must be a finite number');
}
// Accept only the required inclusive range: 0 through 60,000 ms.if (ms < 0 || ms > 60000) {
thrownewRangeError('ms must be between 0 and 60000');
}
// If cancellation already happened, do not create a timer.if (signal?.aborted) {
returnPromise.reject(signal.reason ?? newDOMException('Aborted', 'AbortError'));
}
returnnewPromise((resolve, reject) => {
// Start one browser timer. Even a delay of 0 settles asynchronously.const timer = setTimeout(() => {
// The timer won, so the abort listener is no longer needed.
signal?.removeEventListener('abort', onAbort);
resolve(undefined);
}, ms);
// If abort wins before the timer fires, cancel the timer and reject.constonAbort = () => {
clearTimeout(timer);
// Remove the listener as part of settlement cleanup.
signal?.removeEventListener('abort', onAbort);
// Prefer the signal's reason and use the diagram's fallback if needed.reject(signal.reason ?? newDOMException('Aborted', 'AbortError'));
};
// Attach at most one abort listener for this sleep call.
signal?.addEventListener('abort', onAbort, { once: true });
});
}
// Verified diagram example: the signal is not aborted.asyncfunctiondemo() {
const controller = newAbortController();
const result = awaitsleep(100, {
signal: controller.signal,
});
console.log(result); // undefined, after at least 100 ms
}
demo();
Time & Space Complexity
The computational work is O(1). The function performs a fixed number of checks, starts one timer, and optionally attaches one event listener. The real-world waiting time is at least ms milliseconds, but that waiting does not mean the JavaScript function is doing O(ms) computational work. The auxiliary space is O(1) because each call keeps only a fixed amount of extra state: one Promise, one timer handle, and at most one abort handler.
Where it is used
This pattern is useful when browser code needs an awaitable delay, such as spacing retry attempts, pacing animation steps, delaying UI work, or waiting between asynchronous operations. AbortSignal support is useful when the larger operation can be cancelled, for example when a user leaves a page, cancels an action, or stops a request that is still waiting.
Why Interviewers Ask This
This problem checks whether you understand Promises, browser timers, asynchronous scheduling, AbortSignal cancellation, input validation, and cleanup. It tests whether you know that setTimeout(0) is still asynchronous and whether you can handle an already-aborted signal correctly. It also shows whether you prevent unnecessary timer work after cancellation, remove event listeners after settlement, and describe the O(1) computational work and O(1) auxiliary space accurately.
Common interview mistakes
Common mistakes are checking only typeof ms === "number" and accidentally accepting NaN or Infinity, forgetting the inclusive 0 through 60,000 range, failing to check an already-aborted signal, rejecting on abort without clearing the pending timer, or forgetting to remove the abort listener during cleanup. Another mistake is resolving with some timer value instead of undefined. Candidates may also incorrectly make sleep(0) synchronous or omit the AbortError fallback used by the approved solution.
Interview tip
Describe the implementation as two competing settlement paths. The timer path removes the listener and resolves with undefined. The abort path clears the timer, removes the listener, and rejects. Explaining those two paths makes the cleanup and correctness easy to verify.
Interviewer may ask next
What changes if I call sleep(0)?
The algorithm does not change. Zero is inside the valid range, so the function creates the Promise, starts setTimeout with 0, and attaches the optional abort listener. The timer callback still cannot run during the current synchronous stack. When it later runs, it removes the listener and resolves with undefined. The computational work remains O(1), and the auxiliary space remains O(1).
What happens if the signal aborts before the timer fires?
The abort handler runs first. It calls clearTimeout(timer), removes the abort listener, and rejects the Promise with signal.reason when available. Otherwise, it uses new DOMException("Aborted", "AbortError"). The timer path does not become the observed result because the abort path has already settled the Promise. The computational work and auxiliary space both remain O(1).
63. Implement a cancellable timeout.CodingEasy
i Question Details
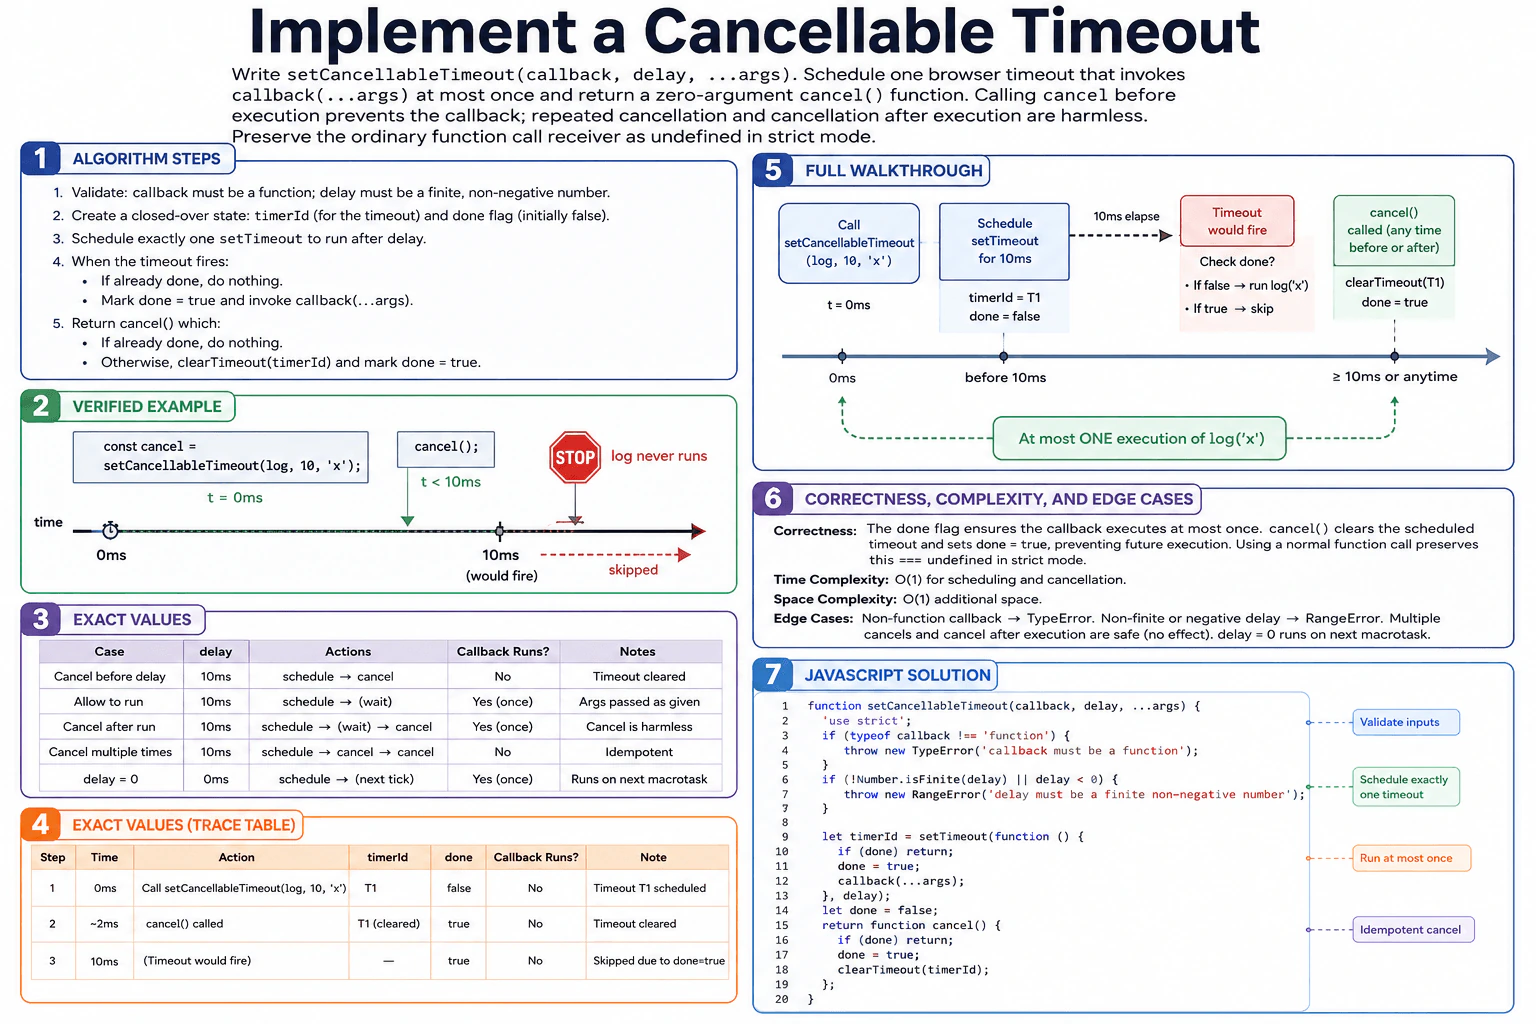
Write setCancellableTimeout(callback, delay, ...args). callback must be a function and delay a finite non-negative number. Schedule one browser timeout that invokes callback(...args) at most once, and return a zero-argument cancel() function. Calling cancel before execution prevents the callback; repeated cancellation and cancellation after execution are harmless. Preserve the ordinary function call receiver as undefined in strict mode. Example: after const cancel = setCancellableTimeout(log, 10, 'x'); cancel();, log must never run. Use only setTimeout and clearTimeout; do not mutate arguments.
Short Interview Answer (30-60 seconds)
I would validate the callback and delay first. Then I would schedule exactly one browser timeout and keep its handle plus a done flag in the closure. When the timeout fires, I check done, mark it true, and call callback(...args). The returned cancel function also checks done. If it is still false, it clears the timeout and marks the operation finished. This makes cancellation idempotent and keeps the callback at most once. Scheduling, cancellation, and wrapper execution are O(1) time with O(1) auxiliary space.
This function schedules one callback to run later. It receives the callback, a delay, and any extra values to pass to the callback. It must also return a cancel function. If cancel is called before the scheduled callback runs, the callback must never run. Calling cancel again must be harmless. Calling cancel after the callback already ran must also be harmless. The solution stores the timeout handle and a done flag so both the timeout path and cancel path know whether the operation is already finished.
Useful Questions to Ask the Interviewer
Should an invalid callback throw a TypeError and an invalid delay throw a RangeError?
Should a delay of 0 still use the normal asynchronous setTimeout behavior?
How to Explain It in an Interview
1. Validate the inputs
The callback must be a function. If it is not, throw a TypeError. The delay must be a finite number that is zero or greater. If it is not, throw a RangeError.
2. Schedule one timeout and create shared state
Call setTimeout exactly once and save its handle as timerId. The timeout is scheduled for the requested delay. Keep a Boolean flag named done. It starts as false. A false value means the operation has not finished or been cancelled yet.
3. Handle timeout execution
When the timeout callback gets its turn, first check done. If done is already true, return without invoking the user's callback. Otherwise set done to true and call callback(...args). The call uses the ordinary function-call form. In strict-mode receiver semantics, that means no custom receiver is supplied.
4. Return an idempotent cancel function
The function returns a zero-argument cancel function. cancel first checks done. If done is already true, it returns immediately. Otherwise it calls clearTimeout(timerId) and marks done as true. This prevents the pending timeout from invoking the callback. Repeated cancellation and cancellation after execution therefore have no additional effect.
5. Walk through the verified example
The diagram uses const cancel = setCancellableTimeout(log, 10, 'x'); cancel();. At 0 ms, timeout T1 is scheduled for 10 ms and done is false. In the execution trace, cancel is called at about 2 ms, before T1 fires. cancel clears T1 and changes done to true. At 10 ms, T1 would have fired, but it was cancelled. The callback does not run, so log('x') never executes.
6. Explain why the solution is correct
The central invariant is that done tells both paths whether this timeout operation is already finished. Only a path that sees done as false can take the finishing action. The timeout path marks done before calling user code. The cancel path clears the pending timeout and marks done. Therefore the callback is invoked at most once, and cancellation is harmless when repeated or performed after execution.
7. Explain complexity and edge cases
Scheduling is O(1). Cancellation is O(1). The wrapper work when the timeout fires is O(1), excluding work performed inside the user's callback. The closure keeps only the timeout handle and one Boolean flag, so auxiliary space is O(1). Relevant edge cases are delay 0, repeated cancellation, cancellation after execution, a non-function callback, and a non-finite or negative delay.
Key Insight / Why This Solution Works
The key idea is to share one closed-over state flag between the scheduled timeout and the returned cancel function. The invariant is: when done is false, the operation is still pending and the callback may run; when done is true, the operation is finished and this timeout must not start the callback. A single timerId identifies the one scheduled timeout. The timeout path checks done, marks it true, then invokes callback(...args). The cancel path checks the same flag, clears timerId, and marks done true. Because both paths use the same finished state, cancellation is idempotent and callback execution is limited to at most once.
Code
functionsetCancellableTimeout(callback, delay, ...args) {
// The callback must be callable.if (typeof callback !== 'function') {
thrownewTypeError('callback must be a function');
}
// The delay must be a finite number that is zero or greater.if (!Number.isFinite(delay) || delay < 0) {
thrownewRangeError('delay must be a finite non-negative number');
}
// Schedule exactly one browser timeout and keep its handle for cancel().let timerId = setTimeout(function () {
// A finished or cancelled operation must not invoke the callback.if (done) return;
// Mark the operation finished before running user code.
done = true;
// Use an ordinary function call and pass the original extra arguments.callback(...args);
}, delay);
// Shared state for the timeout path and the cancellation path.// Even delay = 0 runs in a later task, so this is initialized first// before the scheduled callback can execute.let done = false;
// Return the required zero-argument, idempotent cancellation function.returnfunctioncancel() {
// Repeated cancellation and cancellation after execution are harmless.if (done) return;
// Clear the one pending timeout before it can invoke the callback.clearTimeout(timerId);
// Record that this timeout operation is finished.
done = true;
};
}
// Verified example from the diagram.functionlog(value) {
'use strict';
console.log(value);
}
const cancel = setCancellableTimeout(log, 10, 'x');
// Cancel before the 10 ms timeout executes, so log('x') never runs.cancel();
Time & Space Complexity
Creating the timeout takes O(1) time. Calling cancel takes O(1) time. When the timeout fires, the wrapper itself also performs O(1) work before calling the user's callback. Work done inside the user's callback is separate. The function keeps only one timeout handle and one Boolean flag in its closure, so auxiliary space is O(1).
Where it is used
This pattern is useful when work should happen later but may become unnecessary before its scheduled time. Examples include delayed UI updates, debounced cleanup steps, scheduled notifications, pending retries, and timers that should be cancelled when a view or component no longer needs them.
Why Interviewers Ask This
This problem checks whether you understand browser timers, closures, input validation, and small state transitions in JavaScript. It also tests whether you can make an operation safely cancellable and idempotent. The interviewer wants to see that you schedule only one timeout, reason about the timeout and cancel paths consistently, preserve ordinary callback invocation semantics, pass extra arguments correctly, and explain why the callback can run at most once with accurate O(1) time and space costs.
Common interview mistakes
A common mistake is returning the timeout handle instead of the required zero-argument cancel function. Another is scheduling more than one timeout. Candidates may forget to make repeated cancel calls harmless or forget that cancel after execution must also be harmless. Input validation is another common source of errors, especially accepting Infinity, NaN, or a negative delay. It is also important to mark done before invoking user code and to call callback(...args) normally rather than supplying a custom receiver.
Interview tip
Explain the done flag as the shared invariant first. Say that the timeout path and cancel path both consult the same finished state. Then walk through T1: schedule it for 10 ms, cancel it before 10 ms, clear T1, set done to true, and show that log('x') never runs.
Interviewer may ask next
What happens if cancel() is called after the callback has already executed?
The timeout path sets done to true before invoking the callback. A later cancel call checks done, sees true, and returns immediately. It does not invoke the callback again and does not need to clear the already-finished timer. The operation remains harmless and idempotent. Time is O(1), and auxiliary space remains O(1).
Why keep the done flag if clearTimeout can cancel a pending timeout?
clearTimeout handles the pending timer, but done gives both paths one shared finished state. It lets repeated cancel calls return safely and lets cancel after successful execution do nothing. It also makes the at-most-once rule explicit because the timeout checks the same flag before invoking the callback. The extra cost is one Boolean value, so time remains O(1) and auxiliary space remains O(1).
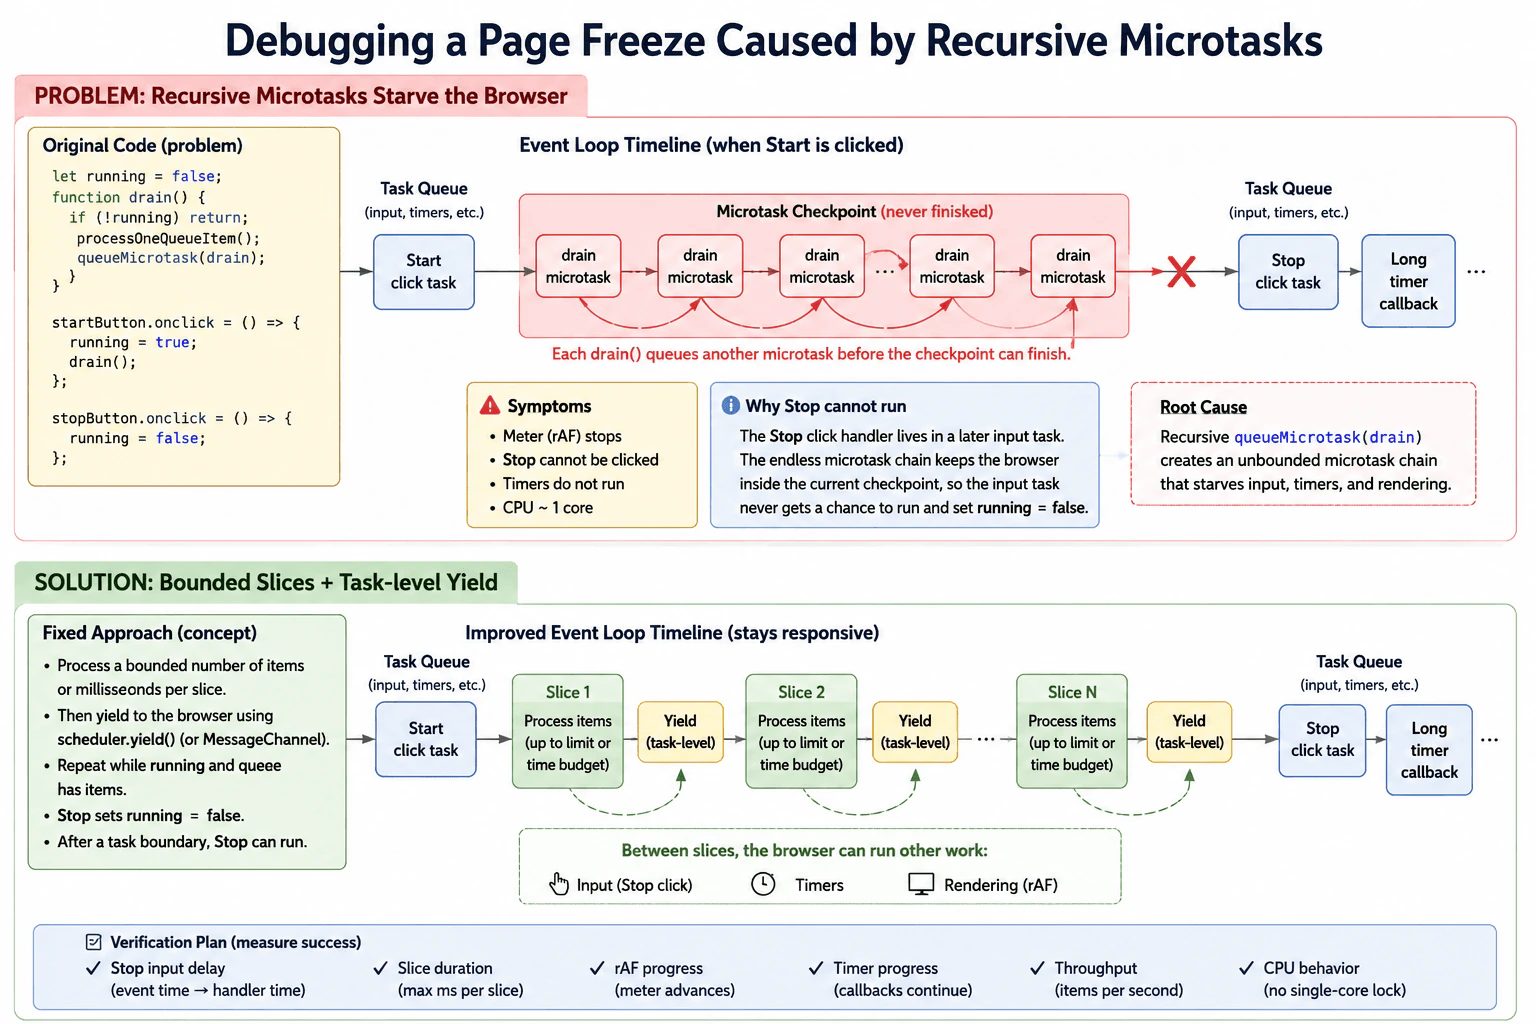
64. What is frontend debugging?DebuggingEasy
i Question Details
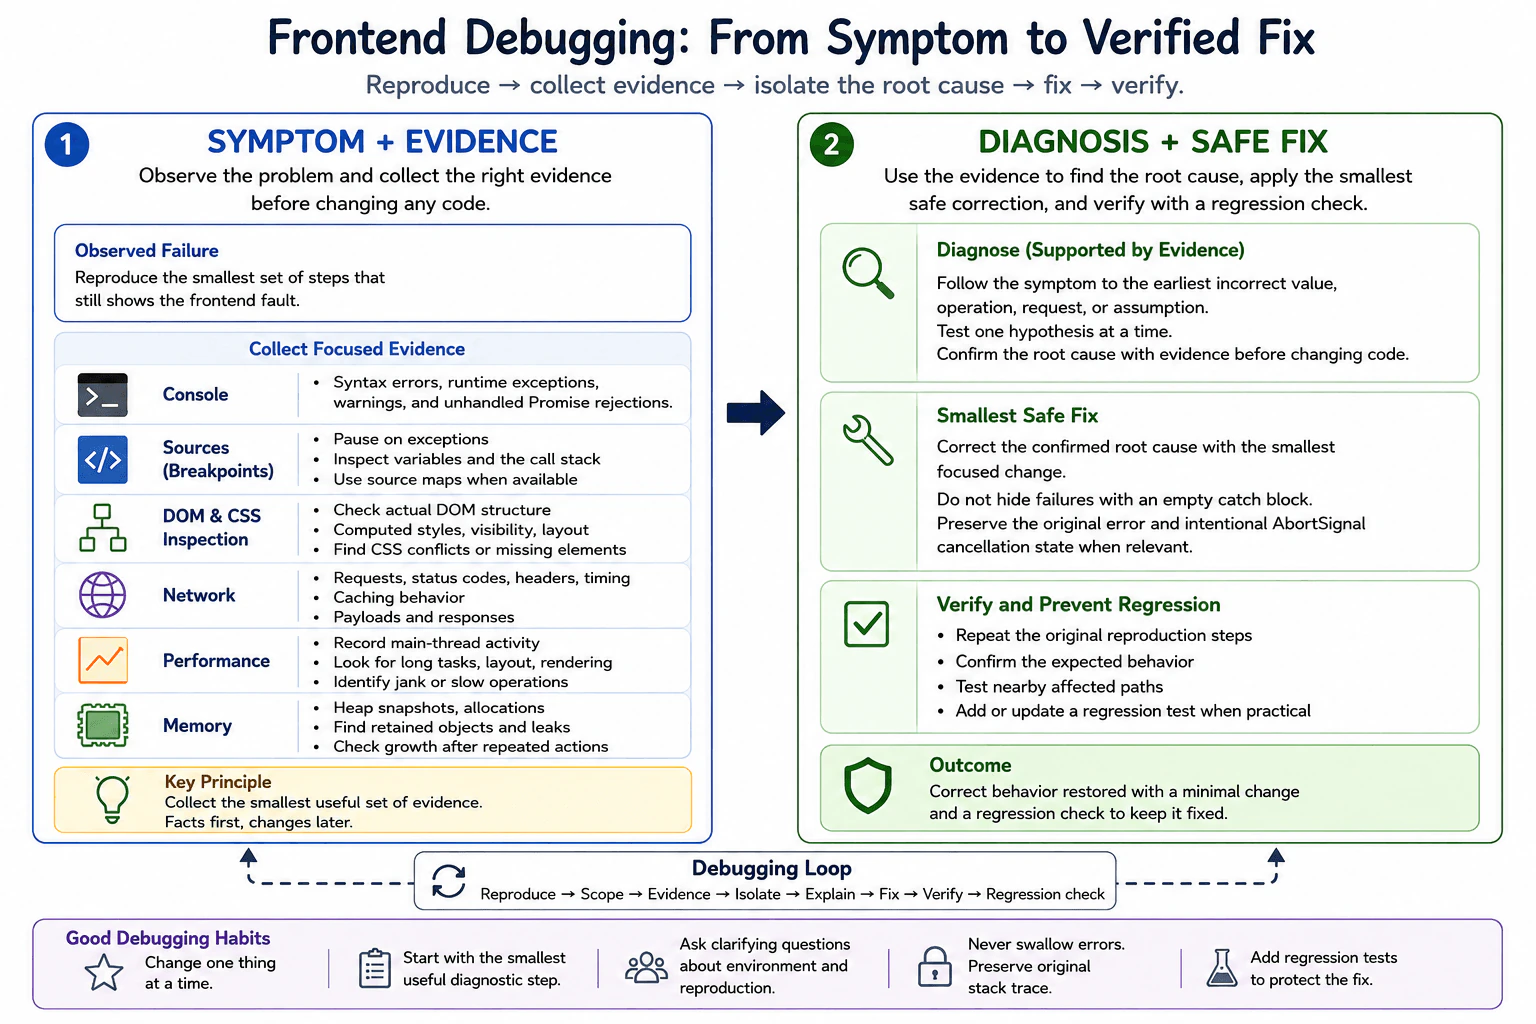
Define frontend debugging as the evidence-based process of reproducing, isolating, explaining, and correcting a fault in browser behavior or the frontend build. Explain a basic loop using a minimal reproduction, console evidence, DOM and CSS inspection, breakpoints, network records, stack traces, performance evidence, a focused fix, and a regression check.
Short Interview Answer (30-60 seconds)
Frontend debugging means reproducing a browser or build problem, collecting evidence, isolating its root cause, fixing that cause, and verifying the result. I start with the smallest reproduction, use the browser tools that match the failure, make a focused correction, and finish with a regression check.
Detailed Explanation
Frontend debugging is a careful way to find why something on a website is not working as expected. First, I make the problem happen again so I know exactly what is wrong. Then I check how much of the page is affected and collect facts instead of guessing. I reduce the problem to the smallest example that still fails. Next, I compare what should happen with what actually happens. After I understand the real reason, I make the smallest safe correction. Finally, I repeat the original steps and check nearby behavior so the problem does not return.
Useful Questions to Ask the Interviewer
Does the problem happen during the frontend build, when the page loads, or only after the user performs an action?
Can the problem be reproduced consistently, and does it affect every browser or only a specific browser or environment?
Is there already a minimal reproduction, error message, stack trace, failed request, or performance recording available?
How to Explain It in an Interview
Frontend debugging is an evidence-based process for finding and correcting the real cause of a frontend fault. I use a simple loop: reproduce, scope, collect evidence, isolate, explain, fix, verify, and prevent regression.
First, I reproduce the problem with the smallest useful set of steps. A minimal reproduction removes unrelated code or actions while keeping the failure. This makes the investigation faster and reduces false assumptions.
Next, I define the scope. I determine whether the problem happens during parsing or building, while resolving or loading a module, during JavaScript execution, during asynchronous work, while rendering the page, during a network request, after state changes, after extended use, or only in a particular browser or environment.
Then I collect evidence from the browser tool that matches the failure. The Console shows syntax errors reported by the browser, runtime exceptions, warnings, and unhandled Promise rejections. The Sources panel lets me inspect loaded source code, use source maps when available, set breakpoints, pause execution, inspect variables, and follow the call stack. DOM and CSS inspection shows the actual document structure, computed styles, layout, visibility, and applied CSS rules. The Network panel shows requests, status codes, headers, timing, caching behavior, request data, and responses. The Performance panel records main-thread activity such as scripting, rendering, layout, painting, and long tasks. The Memory panel helps investigate retained objects, heap growth, and references that keep objects alive.
I handle different failure classes differently. A syntax or build error can prevent code from being produced or executed correctly. A module-loading failure can come from an incorrect import path, failed module resolution, a missing dependency, bundling behavior, or an environment difference. A runtime exception requires examining the stack trace and the values near the failing operation. An unhandled Promise rejection requires tracing the rejected asynchronous operation back to its original cause. A DOM or rendering failure requires checking the actual DOM, CSS cascade, layout, and application state used to produce the view. A network failure requires inspecting the actual request and response instead of assuming the JavaScript logic is wrong. Stale state requires tracing where a value was created, updated, cached, or captured. Memory retention requires identifying which references keep objects reachable after those objects should no longer be needed. Browser-specific behavior requires comparing feature support, standards behavior, configuration, and environment differences.
I isolate one hypothesis at a time. For example, if clicking a button appears to do nothing, I first confirm whether its event handler runs. If it runs, I inspect the next important value or operation. If a request should be sent, I check whether the Network panel records it. This creates a chain of evidence from the visible symptom toward the earliest incorrect value, operation, request, or assumption.
When I find the cause, I separate containment from the root-cause fix. Containment reduces immediate user impact, for example by temporarily disabling a broken action or showing a safe fallback. The root-cause fix corrects the faulty assumption, state transition, request handling, rendering condition, module reference, or other source of the problem. I do not hide failures with empty catch blocks because that removes useful evidence while leaving the defect unresolved.
For asynchronous work, I preserve the original error when adding diagnostic context so its underlying cause and stack information remain available. If an operation accepts an AbortSignal, I also preserve its cancellation state and distinguish an intentional abort from an unrelated failure instead of reporting both as the same error.
I also avoid exposing sensitive production details while debugging. Logs and diagnostics should contain enough information to identify the failure without leaking secrets, authentication data, private user information, or unnecessary response contents.
Finally, I verify the exact reproduction steps after the fix. I test nearby paths that could be affected and, when practical, add or update a regression test. A regression test proves that the specific failure remains fixed after future code changes.
The main tradeoff is investigation depth versus speed. For a simple visible defect, a small reproduction and direct inspection may be enough. For an intermittent performance or memory problem, deeper recordings and repeated measurements may be necessary. I start with the smallest useful diagnostic step and increase the investigation only when the evidence requires it.
Technical Approach
Reproduce the failure reliably with the smallest useful set of steps.
Define the scope: build, module loading, runtime exception, Promise rejection, DOM or rendering, network, state, memory, browser, or environment.
Record the expected behavior and the actual behavior.
Collect the smallest useful evidence from the browser tool that matches the symptom.
Follow the evidence from the visible symptom toward the earliest incorrect value, operation, request, or assumption.
Test one focused hypothesis at a time using breakpoints, inspection, network records, traces, or a smaller reproduction.
Identify and explain the root cause before changing the code.
Separate temporary containment from the permanent root-cause correction.
Apply the smallest focused fix that corrects the cause without swallowing errors or exposing sensitive information.
Repeat the original reproduction steps, test nearby behavior, and add a regression test when practical.
Practical Insights
Frontend debugging usually does not have a useful Big-O time or memory complexity because it is an investigation process rather than an algorithm. The main cost is engineering time and the amount of diagnostic data collected. A small, repeatable problem can often be isolated quickly, while an intermittent browser, performance, or memory problem may require repeated measurements. Performance recordings and heap snapshots can collect significant data, so they should focus on the failing period. Maintenance cost is lower when the final correction is small, the cause is understood clearly, and a regression test protects the behavior.
Why Interviewers Ask This
Interviewers want to see whether the candidate can investigate frontend failures methodically instead of guessing. This question evaluates whether the candidate can reproduce a fault, collect the right browser evidence, distinguish different failure types, isolate the root cause, make a focused correction, and verify that the same problem does not return.
Common interview mistakes
Common mistakes are changing several things before reproducing the problem, guessing instead of collecting evidence, treating every Console message as the root cause, and using the wrong browser panel for the symptom. Other mistakes include debugging transformed bundle code without using available source maps, ignoring the first relevant stack-trace frame, assuming every failed request is caused by frontend logic, confusing stale state with a rendering problem, and starting with expensive Performance or Memory analysis before checking simpler evidence. Swallowing exceptions with empty catch blocks is also wrong because it hides evidence without fixing the cause. For asynchronous work, losing the original error or treating an intentional AbortSignal cancellation as an ordinary failure can produce misleading diagnostics. Finally, failing to reproduce the original problem after the fix or skipping a regression check can allow the defect to return.
Interview tip
Present debugging as a disciplined evidence loop, not random trial and error. Start with reproduction and scope, name the browser tool that gives the needed evidence, explain how you isolate the root cause, distinguish containment from the real fix, and finish with verification and a regression check.
Interviewer may ask next
How do you choose which browser DevTools panel to use first?
I choose the panel based on the symptom. I start with the Console for reported syntax errors, runtime exceptions, warnings, or unhandled Promise rejections. I use Sources when I need breakpoints, variable inspection, source maps, or the call stack. I inspect the DOM and CSS for rendering or layout problems. I use Network for request, response, caching, or timing problems. I use Performance for slow scripting or rendering and Memory for retained objects or suspicious heap growth. I start with the smallest useful source of evidence instead of using every tool at once.
What is the difference between containing a frontend failure and fixing its root cause?
Containment reduces the immediate impact without necessarily removing the underlying defect. For example, a team might temporarily disable a broken action or show a safe fallback. A root-cause fix corrects the faulty code, state transition, request handling, rendering condition, module reference, or assumption that created the problem. Containment can be useful when immediate protection is needed, but it should not replace the permanent correction. After the root-cause fix, I repeat the original reproduction, test related paths, and add a regression test when practical.
65. What is a breakpoint in browser debugging?DebuggingEasy
i Question Details
Define a breakpoint as a rule that pauses JavaScript execution at a chosen source location or condition so the current program state can be inspected. Explain line, conditional, DOM, event-listener, and exception breakpoints; stepping; call stacks; scope and variable inspection; and why a breakpoint should help test a specific cause rather than invite random changes.
Short Interview Answer (30-60 seconds)
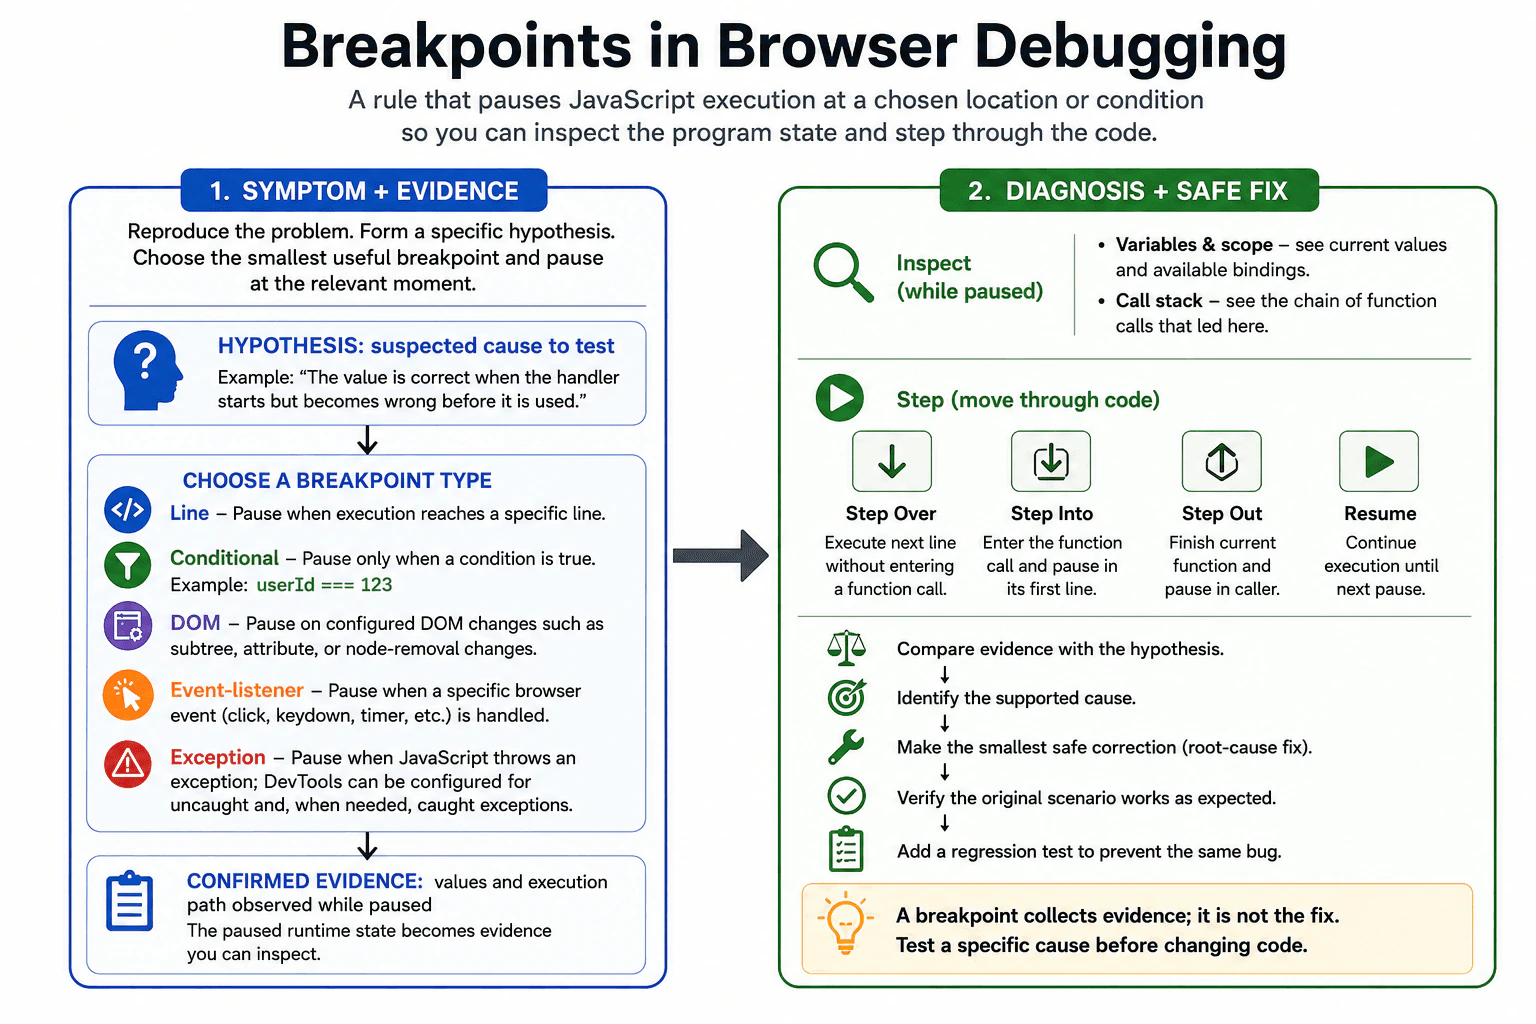
A breakpoint is a rule that pauses JavaScript at a chosen line or condition. While paused, I inspect variables, scope, the call stack, and page state, then step through execution. I use it to test a specific suspected cause before changing the code.
Detailed Explanation
A breakpoint is like putting a temporary stop sign inside a running program. When the program reaches that stop sign, it pauses instead of continuing immediately. This gives you time to look at what the program knows at that moment, see how it arrived there, and check whether something has the value or state you expected. Different kinds of stop signs can pause for different reasons, such as reaching a place, meeting a condition, changing part of the page, responding to an action, or encountering a problem. The goal is to collect evidence before changing anything.
Useful Questions to Ask the Interviewer
Would you like me to explain the main breakpoint types available in browser developer tools?
Should I also describe how stepping, the call stack, and variable inspection are used after execution pauses?
How to Explain It in an Interview
A breakpoint is a rule in browser developer tools that pauses JavaScript execution at a chosen source location or when a chosen condition is satisfied. The browser keeps the current runtime state available so I can inspect it before the next statement executes.
I begin by reproducing the problem, narrowing its scope, collecting evidence, and forming a specific hypothesis. I then choose the smallest useful breakpoint that can test that hypothesis. For example, if a click produces the wrong value, I can pause inside the relevant handler and inspect the data rather than changing several lines at random.
A line breakpoint pauses whenever execution reaches a selected source line. It is useful when I already know which part of the code is suspicious.
A conditional breakpoint pauses at a source location only when its condition evaluates to true. For example, I might pause only when a particular identifier is missing. This is useful when the same line executes many times but the failure happens only for one state. The limitation is that repeatedly evaluating a breakpoint condition can make debugging slower, especially in frequently executed code.
A DOM breakpoint pauses when a selected DOM node is changed in a configured way, such as subtree modification, attribute modification, or node removal. It is useful when the page changes unexpectedly and I need to discover which JavaScript caused that DOM mutation.
An event-listener breakpoint pauses when JavaScript handles a selected category of browser event, such as a mouse, keyboard, timer, or other supported event. It is useful when I know what event triggers the problem but do not yet know which listener or execution path is responsible.
An exception breakpoint pauses when JavaScript throws an exception. Browser developer tools can normally be configured to pause on uncaught exceptions and, when needed, caught exceptions too. This lets me inspect the state and call stack at or near the point where the error originated instead of relying only on later error handling.
Once execution pauses, I inspect variables and scope. Scope means the bindings that are visible at the current execution point, including local variables and values from surrounding lexical scopes. I compare the observed values with what my hypothesis predicted.
I also inspect the call stack. The call stack is the active chain of function calls that led to the current paused location. It helps me understand not only where execution stopped but also how the program reached that location.
Then I use stepping controls. Step over executes the current statement without entering a function call made by that statement. Step into enters an eligible function call so I can inspect its execution. Step out continues until the current function returns and then pauses in its caller. Resume continues normal execution until another breakpoint, exception pause, or other configured pause condition is reached.
The important debugging principle is that a breakpoint should test a specific suspected cause. For example, my hypothesis might be that a value is correct when an event handler starts but becomes incorrect before a rendering function uses it. I place a breakpoint around the relevant state transition, reproduce the problem, inspect the values and call stack, and step through the smallest relevant path. The evidence should either support or reject the hypothesis.
I also choose the browser panel according to the evidence I need. Syntax, parsing, bundling, or module-loading failures may prevent normal execution and should first be investigated from the error messages and loading evidence. Runtime exceptions and JavaScript logic are commonly investigated with the Console and Sources panels. Network failures belong in the Network panel. DOM changes can be investigated with DOM inspection and DOM breakpoints. Performance problems require timing evidence from the Performance panel, while suspected memory retention requires the Memory panel. A breakpoint should not replace the tool that provides the relevant evidence.
A breakpoint is a diagnostic tool, not the root-cause fix. If it reveals the cause, I separate temporary containment from the real correction. I fix the underlying problem instead of swallowing errors or hiding symptoms. Then I reproduce the original scenario, verify the expected behavior without depending on the breakpoint, and add an appropriate regression test so the same failure is caught automatically in the future.
Technical Approach
Reproduce the problem consistently and define its scope.
Collect initial evidence from the appropriate browser tool.
Form one specific hypothesis about where or why the incorrect behavior begins.
Choose the smallest useful breakpoint type: line, conditional, DOM, event-listener, or exception.
Reproduce the problem and let execution pause.
Inspect variables, scope, page state, and the call stack.
Use step over, step into, step out, or resume to follow only the relevant execution path.
Compare the observed evidence with the hypothesis and reject or refine the hypothesis when needed.
Correct the root cause rather than hiding the symptom.
Reproduce the scenario again, verify the fix, and add a regression test.
Practical Insights
Breakpoints are development-time debugging tools, so they do not change the normal production algorithm's time or memory complexity when they are not active. During debugging, pausing execution, inspecting large values, or evaluating conditional breakpoints on frequently executed code can make the page run much more slowly. Breakpoints also have a maintenance and attention cost: too many active breakpoints can create irrelevant pauses and make investigation harder. The practical approach is to use a small number of targeted breakpoints that test the current hypothesis.
Why Interviewers Ask This
This question checks whether the candidate understands how browser breakpoints pause JavaScript so runtime state can be inspected. It evaluates knowledge of line, conditional, DOM, event-listener, and exception breakpoints; stepping controls; call stacks; scopes; and variable inspection. It also tests whether the candidate uses breakpoints to gather evidence for a specific debugging hypothesis instead of making random code changes.
Common interview mistakes
Common mistakes include placing breakpoints everywhere without a hypothesis, changing code before inspecting the paused state, looking only at the current line and ignoring the call stack, confusing step over with step into, and using a normal line breakpoint when a conditional breakpoint would isolate a rare failure more efficiently. Another mistake is assuming that the line where a bad value is observed is necessarily where that value first became wrong. Developers should also avoid using source breakpoints for problems whose evidence belongs in the Network, Performance, or Memory panel, and they should not swallow exceptions merely to make debugging output disappear.
Interview tip
Start with the definition, then briefly name the main breakpoint types. Explain that after execution pauses, you inspect variables, scope, and the call stack and use stepping controls. Finish by saying that a breakpoint should test a specific hypothesis and provide evidence before you change the code.
Interviewer may ask next
What is the difference between a line breakpoint and a conditional breakpoint?
A line breakpoint pauses whenever execution reaches the selected source location. A conditional breakpoint pauses at that location only when its condition evaluates to true. I use a line breakpoint when every execution is relevant and a conditional breakpoint when the code runs many times but only a particular value or state reproduces the bug.
What should you inspect after a breakpoint pauses JavaScript execution?
I first inspect the current variables and scope to see whether the runtime state matches my hypothesis. Then I inspect the call stack to understand how execution reached that point. I use step over, step into, step out, or resume to follow the relevant path. I compare the evidence with the expected behavior before deciding what code should be changed.
66. What is a JavaScript stack trace?DebuggingEasy
i Question Details
Define a stack trace as a record of active function calls associated with an error or a captured execution point. Explain frames, function names, files, line and column numbers, synchronous and asynchronous boundaries, source maps, minified production code, and a method for finding the first relevant application frame without assuming the top frame is always the root cause.
Short Interview Answer (30-60 seconds)
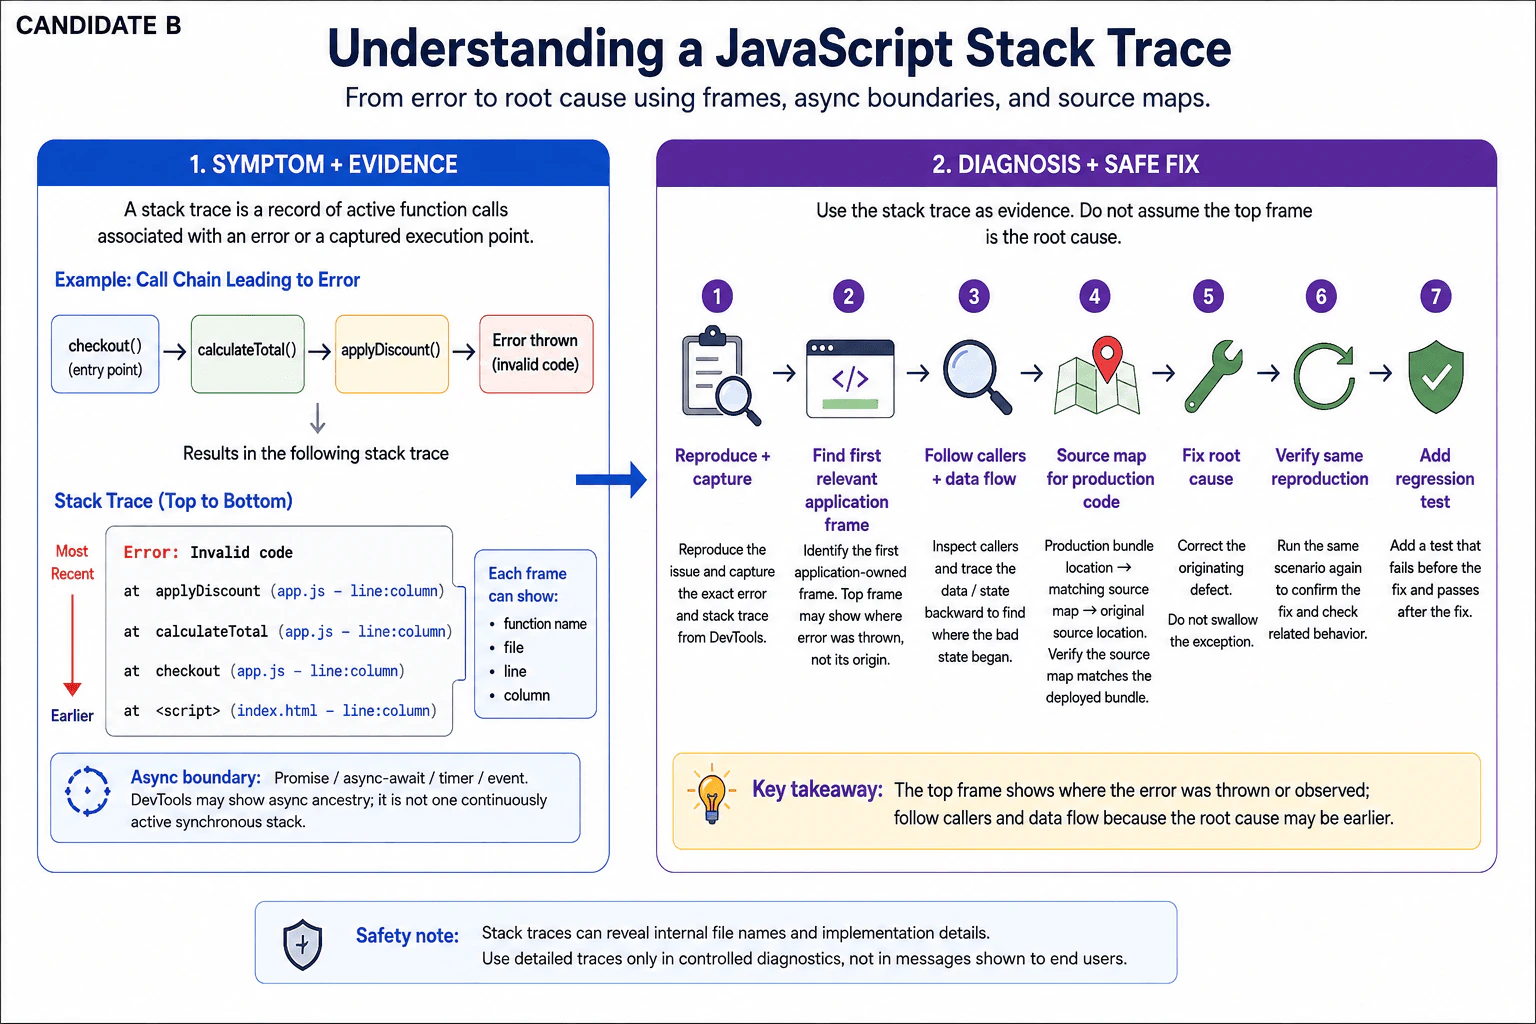
A JavaScript stack trace shows the chain of function calls related to an error or captured execution point. Each frame can show a function, file, line, and column. I inspect the relevant application frames and follow the call and data flow instead of assuming the top frame caused the bug.
Detailed Explanation
When a program stops working, we need clues showing how it reached the place where the problem appeared. A stack trace gives those clues as an ordered list of steps. Each step can tell us which part of the program was running and where it came from. This helps us move from the visible failure toward the part that matters. The first item is useful, but it is not always where the real problem began. Good debugging means checking the path, separating our own work from outside code, and confirming the evidence before changing anything.
Useful Questions to Ask the Interviewer
Should I explain both synchronous and asynchronous stack traces?
Should I include how source maps help with minified production code?
Do you want the answer focused on browser DevTools, or mainly on the stack-trace concept?
How to Explain It in an Interview
A JavaScript stack trace is a record of function calls associated with an error or with a deliberately captured execution point. It helps answer the practical question: "How did execution get here?"
A stack trace contains frames. A frame represents one function call in the recorded call chain. A typical frame may contain a function name, source file, line number, and column number. Some names or locations can be missing depending on how the code was generated and how the runtime reports the trace.
For example, if checkout() calls calculateTotal(), and calculateTotal() calls code that throws an exception, the trace can contain frames for those calls. The frame nearest the error normally identifies where the exception was thrown or observed. That location is important evidence, but it does not prove that the same line created the original bad state.
My debugging process starts with reproduction and scope. I first reproduce the failure and classify what kind of problem I am seeing. A stack trace is most directly useful for JavaScript runtime exceptions, unhandled Promise rejections, and deliberately captured execution points. Syntax or build errors, module-loading failures, DOM or rendering problems, network failures, stale state, memory retention, and browser-specific behavior may require different evidence in addition to, or instead of, a runtime stack trace.
For a runtime exception, I collect the exact error message and trace from the Console. I use the Sources panel when I need to inspect the referenced code, set breakpoints, or step through execution. I do not use unrelated DevTools panels unless the evidence requires them. For example, the Network panel is for request and response evidence, while Performance and Memory are for timing and memory-retention investigations rather than ordinary stack-trace reading.
For synchronous JavaScript, the frames normally describe the nested call chain that led to the captured point. I scan the trace for application-owned code and distinguish it from browser internals, framework internals, third-party libraries, and generated bundle helpers. I usually inspect the first relevant application frame first, but I do not automatically call it the root cause.
A value may become invalid earlier and fail only when another function later tries to use it. If the first relevant frame only exposes the symptom, I inspect its callers and trace the important data backward until I find where the incorrect value, state, or assumption originated. That is the root-cause investigation.
Asynchronous JavaScript needs extra care. Work can cross boundaries created by Promises, async functions, timers, events, and other queued tasks. The original synchronous call stack ends when control returns to the event loop. Browser DevTools may preserve or reconstruct useful asynchronous ancestry so a developer can see how later work was scheduled. Those displayed async relationships are debugging evidence, but they should not be interpreted as one continuous set of function calls that were all active at the same time.
Production traces can also point into bundled or minified JavaScript. Minification can shorten names and compress large amounts of source into generated locations such as app.min.js:1:48392. That location may be accurate for the generated file but difficult for a developer to understand directly.
Source maps connect generated code locations back to corresponding original source locations. With the correct source map, DevTools or an error-monitoring system can translate a generated file, line, and column into a much more useful original file, line, and column. I verify that the map belongs to the exact deployed bundle or build version before trusting the mapped result. A stale or mismatched source map can point to the wrong source code.
The practical method is therefore: reproduce the problem, define its scope, capture the exact error and trace, identify relevant application frames, inspect the first useful application frame, follow callers and data flow when the bad state originated earlier, account for asynchronous boundaries, and use verified source maps when production code is transformed.
Containment and correction are different. A temporary containment step might prevent a broken feature from affecting more users, but simply catching or swallowing the exception does not repair its cause. The root-cause fix corrects the invalid state, input, assumption, or behavior that produced the failure while preserving the original error cause when errors are wrapped or rethrown.
After the fix, I repeat the exact reproduction and confirm the expected behavior. I also check that related behavior still works. Then I add a regression test at the smallest useful level so the original failing condition is detected automatically in the future.
In production, detailed traces should go to controlled diagnostic systems rather than being exposed directly to users. Stack traces can reveal internal source names, paths, dependency details, or other implementation information. They are valuable debugging evidence, but access and retention should follow the application's security and privacy rules.
Key Insight / Why This Solution Works
Reproduce the failure consistently and define its scope.
Classify the failure before relying on the trace: runtime exception, unhandled Promise rejection, syntax or build error, module-loading problem, DOM or rendering problem, network failure, stale state, memory issue, or browser-specific behavior.
For a JavaScript execution failure, capture the exact error message and stack trace from the Console.
Read each available frame as evidence: function name, file, line, and column.
Separate application-owned frames from browser, framework, library, and generated bundle frames.
Inspect the first relevant application frame, but do not assume it created the bad state.
Follow caller frames and important data flow when the failure was caused earlier.
When asynchronous work is involved, account for Promise, async, timer, event, or other task boundaries instead of treating the displayed trace as one continuously active synchronous stack.
When production code is bundled or minified, verify the matching source map before mapping generated locations back to original source.
Separate temporary containment from the root-cause correction, and do not swallow the error merely to hide the symptom.
Repeat the original reproduction to verify the fix and check related behavior.
Add a regression test for the condition that originally caused the failure.
Why Interviewers Ask This
Interviewers want to know whether the candidate can use stack-trace evidence correctly instead of guessing from an error message. A strong answer shows understanding of call frames, source locations, synchronous and asynchronous execution, source maps, minified production bundles, and how to identify the first relevant application frame without automatically assuming the top frame contains the root cause.
Common interview mistakes
A common mistake is assuming the top frame is automatically the root cause. It normally shows where an error was thrown or observed, while the invalid state may have originated earlier. Another mistake is treating browser, framework, library, and generated bundle frames as if they were all application code. Developers may also ignore asynchronous boundaries, interpret an async trace as one continuously active call stack, trust a source map that does not match the deployed bundle, or debug a minified generated location without mapping it to original source. Other mistakes include swallowing exceptions to hide symptoms, changing code before reproducing the problem, using unrelated DevTools panels without a diagnostic reason, exposing sensitive production traces to users, and failing to add a regression test after the root cause is corrected.
Interview tip
Start with the practical purpose: a stack trace helps explain how execution reached an error or captured point. Define a frame and its function, file, line, and column information. Then mention async boundaries and source maps. Finish by explaining that you inspect the first relevant application frame but follow callers and data flow because the top frame is not always the root cause.
Interviewer may ask next
Why should you not assume the top stack-trace frame is the root cause?
The top frame normally shows where the error was thrown or observed, not necessarily where the bad state was created. For example, one function may receive an invalid value created several calls earlier and fail only when it tries to use that value. I inspect the top relevant frame first, then follow callers and important data flow until I identify where the incorrect condition originated.
How do source maps help when a production stack trace points to minified JavaScript?
Minified and bundled JavaScript can compress code into generated locations that are difficult to understand, such as a large column number on one generated line. A source map relates that generated file, line, and column to the corresponding original source location. I verify that the source map belongs to the exact deployed bundle or build version before trusting it, because a stale or mismatched map can point to the wrong source code.
67. Debug a credentialed cross-origin request that works outside the browser but fails in the page.DebuggingMedium
The browser console reports: Access to fetch ... has been blocked by CORS policy: Response to preflight request doesn't pass access control check. The OPTIONS response is status 204 with:
Access-Control-Allow-Origin: *
Access-Control-Allow-Headers: Content-Type
Access-Control-Allow-Methods: GET
Access-Control-Allow-Credentials: true
The session cookie is Secure; HttpOnly; SameSite=None. Diagnose every header mismatch visible in the evidence, explain why a command-line client succeeds, and define the frontend and API corrections plus the Network-panel checks that verify the fix. Do not describe CORS as authentication.
Short Interview Answer (30-60 seconds)
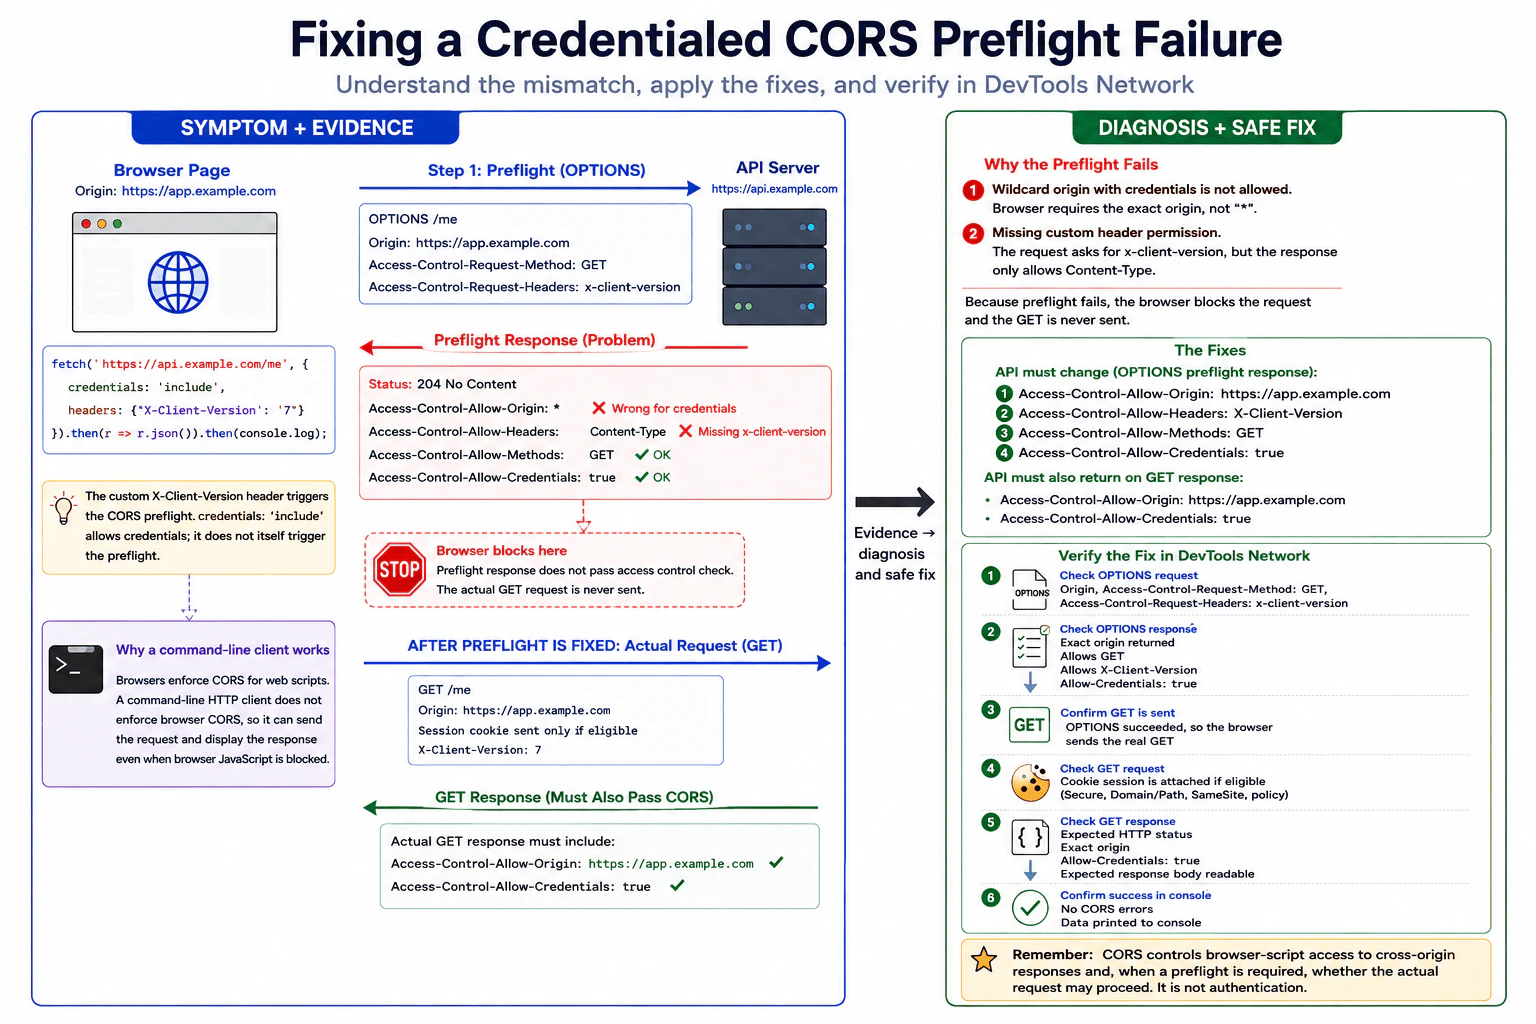
The preflight shows two mismatches: credentialed CORS cannot use Access-Control-Allow-Origin: *, and X-Client-Version is missing from Access-Control-Allow-Headers. Return the exact app origin, permit that header and GET, keep credentials enabled, then verify both OPTIONS and GET in Network.
The page is asking a different web address for the signed-in user's information, but the browser blocks the exchange because the two sides do not agree on the browser's sharing rules. The evidence shows two disagreements: the server says every website is allowed even though private sign-in information is involved, and it does not approve one extra piece of information the page wants to send. A command-line program can still work because it does not apply these browser-only safety rules. The fix is to make the permissions match exactly and then confirm the real request runs.
Useful Questions to Ask the Interviewer
Is https://app.example.com the only frontend origin that should be allowed, or are there other trusted origins?
Is X-Client-Version required by the API, or can the frontend remove it?
Do the actual GET /me responses already return the required CORS headers, or is only the OPTIONS response configured?
How to Explain It in an Interview
I would reproduce the failure in the browser and start with DevTools Network because the console already says the preflight failed. A preflight is an automatic OPTIONS request the browser sends before certain cross-origin requests to ask whether the real request is permitted.
The page is loaded from https://app.example.com and calls https://api.example.com/me. These URLs are different origins because their hosts differ, even though they are subdomains of the same registrable site. The fetch also sends the non-safelisted custom header X-Client-Version, so the browser performs a CORS preflight before the GET. credentials: 'include' tells fetch to allow credentials such as cookies on the cross-origin request; it is not, by itself, what causes this preflight.
In Network, I would open the OPTIONS request first. Its request headers should show Origin: https://app.example.com, Access-Control-Request-Method: GET, and Access-Control-Request-Headers containing x-client-version.
The supplied OPTIONS response has two visible mismatches.
First, Access-Control-Allow-Origin: * does not work for a credentialed CORS fetch. When the browser is making a request whose credentials mode is include, the response must name an allowed origin explicitly. For this frontend, the API should return Access-Control-Allow-Origin: https://app.example.com rather than *.
Second, the browser asks permission to send X-Client-Version, but the API returns Access-Control-Allow-Headers: Content-Type. That does not grant permission for X-Client-Version. The API must include X-Client-Version in Access-Control-Allow-Headers if the frontend needs to send it. HTTP header names are case-insensitive, so x-client-version and X-Client-Version refer to the same header name.
The other visible preflight values are not mismatches. Access-Control-Allow-Methods: GET permits the requested method. A 204 status is a valid successful preflight response. Access-Control-Allow-Credentials: true is the correct value when the API permits credentialed cross-origin requests, but it does not make the wildcard origin valid.
The session cookie is shown as Secure; HttpOnly; SameSite=None. Those attributes do not explain the CORS error in the evidence. Secure requires HTTPS, which both URLs use. HttpOnly prevents page JavaScript from reading the cookie but does not prevent the browser from attaching it to eligible HTTP requests. SameSite=None permits the cookie in cross-site contexts when its other scope rules also match. Here the two HTTPS subdomains are cross-origin but normally same-site under schemeful site rules, so SameSite=None is not needed merely because the hosts are different. Cookie Domain or host scope, Path, expiration, and browser privacy policy could still affect whether the cookie is sent, but the question provides no evidence of a mismatch there.
For the frontend correction, I would first ask whether X-Client-Version is necessary. If it is not required, remove it. That removes this custom-header reason for the preflight. The frontend should keep credentials: 'include' if the API relies on the session cookie. Removing the custom header does not remove the API's obligation to return valid credentialed CORS headers on the actual GET response.
If X-Client-Version is required, I would leave the frontend request as written and fix the API configuration. The preflight response for this request should allow the exact trusted origin, GET, the custom header, and credentials. Conceptually, the relevant response headers are Access-Control-Allow-Origin: https://app.example.com, Access-Control-Allow-Methods: GET, Access-Control-Allow-Headers: X-Client-Version, and Access-Control-Allow-Credentials: true.
If the API serves several trusted frontends, it should compare the incoming Origin with an allowlist and return that origin only when it is approved. It should not blindly reflect arbitrary origins. When the response varies according to the request Origin and can pass through shared caches, Vary: Origin should also be sent so a response authorized for one origin is not incorrectly reused for another.
The actual GET /me response must also pass CORS. For this credentialed fetch it should return Access-Control-Allow-Origin: https://app.example.com and Access-Control-Allow-Credentials: true. Access-Control-Allow-Methods and Access-Control-Allow-Headers are preflight-response permissions and do not need to be repeated on the GET merely for the GET response to pass CORS. Fixing only the OPTIONS response is therefore incomplete if the GET response still lacks the required origin or credentials headers.
A command-line HTTP client succeeds because CORS is enforced by web browsers for browser scripts. A command-line client can send the HTTP request and display the HTTP response without applying the browser's same-origin/CORS access checks. Its success shows that the API is reachable and may accept the request, but it does not prove that the API's browser-facing CORS policy is valid.
For verification, I would reload with Network recording enabled. If X-Client-Version remains, I would verify that the OPTIONS request contains the expected Origin, requested method, and requested header. I would then verify that the OPTIONS response names https://app.example.com, allows GET, allows X-Client-Version, and allows credentials. Most importantly, the browser should then proceed to send the real GET.
On the GET request, I would inspect the Cookies section or request headers to confirm whether the expected session cookie was actually attached. On the GET response, I would verify the exact Access-Control-Allow-Origin value and Access-Control-Allow-Credentials: true. I would confirm the expected HTTP status and JSON body and make sure the console no longer reports a CORS error.
If CORS is fixed and the server then returns 401, I would treat that as separate evidence. At that point the browser has passed the CORS layer and reached an authentication or session problem. I would then investigate cookie scope, session validity, expiration, server authorization logic, and browser cookie policy. CORS controls whether browser JavaScript is permitted to make or read a cross-origin response under the applicable rules; it is not authentication.
For a regression test, I would verify that the approved frontend origin receives the expected CORS headers and that a non-approved origin does not. I would also test that a request containing X-Client-Version gets a successful preflight and proceeds to the GET. That protects both the working case and the security boundary.
Key Insight / Why This Solution Works
Reproduce the browser failure and preserve Console and Network evidence.
Locate the OPTIONS preflight and inspect Origin, Access-Control-Request-Method, and Access-Control-Request-Headers.
Compare those requested permissions with the API's Access-Control-Allow-* response headers.
Identify the two visible mismatches: wildcard origin with credentialed CORS and missing permission for X-Client-Version.
Decide whether the frontend can remove the custom header; otherwise fix the API allowlist and allowed headers.
Verify that the actual GET also returns the exact allowed origin and credentials header.
Reload and confirm OPTIONS succeeds, GET is sent, the expected cookie is attached if eligible, the response is readable, and the console has no CORS error.
Add regression tests for an approved origin, the custom-header preflight, and a rejected origin.
Code
// Frontend option only when X-Client-Version is not required by the API.// Removing the non-safelisted custom header removes this header as the reason for a preflight.asyncfunctionloadCurrentUser() {
// Keep credentials enabled because the endpoint relies on the browser-managed session cookie.const response = awaitfetch('https://api.example.com/me', {
credentials: 'include',
});
// Preserve an HTTP failure as distinct evidence after CORS has allowed access to the response.if (!response.ok) {
thrownewError(`GET /me failed with HTTP ${response.status}`);
}
// Parse the JSON only after the browser has exposed the successful response to JavaScript.return response.json();
}
// Surface either the user data or the original failure so it remains diagnosable.loadCurrentUser().then(console.log).catch(console.error);
Why Interviewers Ask This
This tests whether the candidate can use browser evidence instead of guessing, understand credentialed CORS and preflight behavior, identify exact request-versus-response header mismatches, distinguish CORS from authentication, choose the smallest safe correction, and verify both the preflight and the real request.
Common interview mistakes
Calling this an authentication failure before the browser has passed CORS; assuming a 204 preflight is automatically correct; overlooking that X-Client-Version is absent from Access-Control-Allow-Headers; using Access-Control-Allow-Origin: * with a credentialed request; claiming credentials: 'include' itself causes the preflight; adding or discussing Content-Type as though it were the requested custom header; fixing only OPTIONS and forgetting the required CORS headers on the actual GET; removing credentials even though the session cookie is needed; assuming a successful command-line request proves browser CORS is correct; trying to read an HttpOnly cookie from JavaScript; assuming two subdomains are necessarily cross-site rather than distinguishing origin from site; or blindly reflecting arbitrary Origin values instead of checking a trusted allowlist.
Interview tip
Present the evidence in browser order: requested preflight permissions, returned permissions, the two exact mismatches, the smallest frontend/API correction, and the Network checks proving the GET now runs. Explicitly distinguish cross-origin from cross-site and state that CORS is browser access control, not authentication.
Interviewer may ask next
What changes if X-Client-Version is required and cannot be removed?
Keep the frontend header. The API preflight must permit X-Client-Version in Access-Control-Allow-Headers, permit GET, return Access-Control-Allow-Origin: https://app.example.com instead of *, and return Access-Control-Allow-Credentials: true. The actual GET response must also return the exact allowed origin and credentials header. In Network, verify that the OPTIONS succeeds and that the browser then sends and exposes the GET response.
What if CORS is fixed but the GET now returns 401?
That is separate evidence and usually means the CORS layer is no longer the blocker. I would inspect the GET in Network to see whether the expected session cookie was attached. If it was missing, I would investigate cookie Domain or host scope, Path, expiration, Secure requirements, SameSite behavior where relevant, and browser cookie policy. If the cookie was sent, I would investigate server-side session validity and authorization. I would not weaken CORS to solve a 401 because CORS and authentication serve different purposes.
68. Debug why an object method loses its `this` value in a click handler.DebuggingEasy
i Question Details
The page runs as a browser ES module and contains:
Clicking the button throws TypeError: Cannot read properties of undefined (reading 'name'), and data-last-panel is never set. Diagnose the root cause from the complete snippet, show how you would prove the callback receiver in DevTools, and propose a correction that still allows the listener to be removed during teardown. Do not replace the object with a global variable.
Short Interview Answer (30-60 seconds)
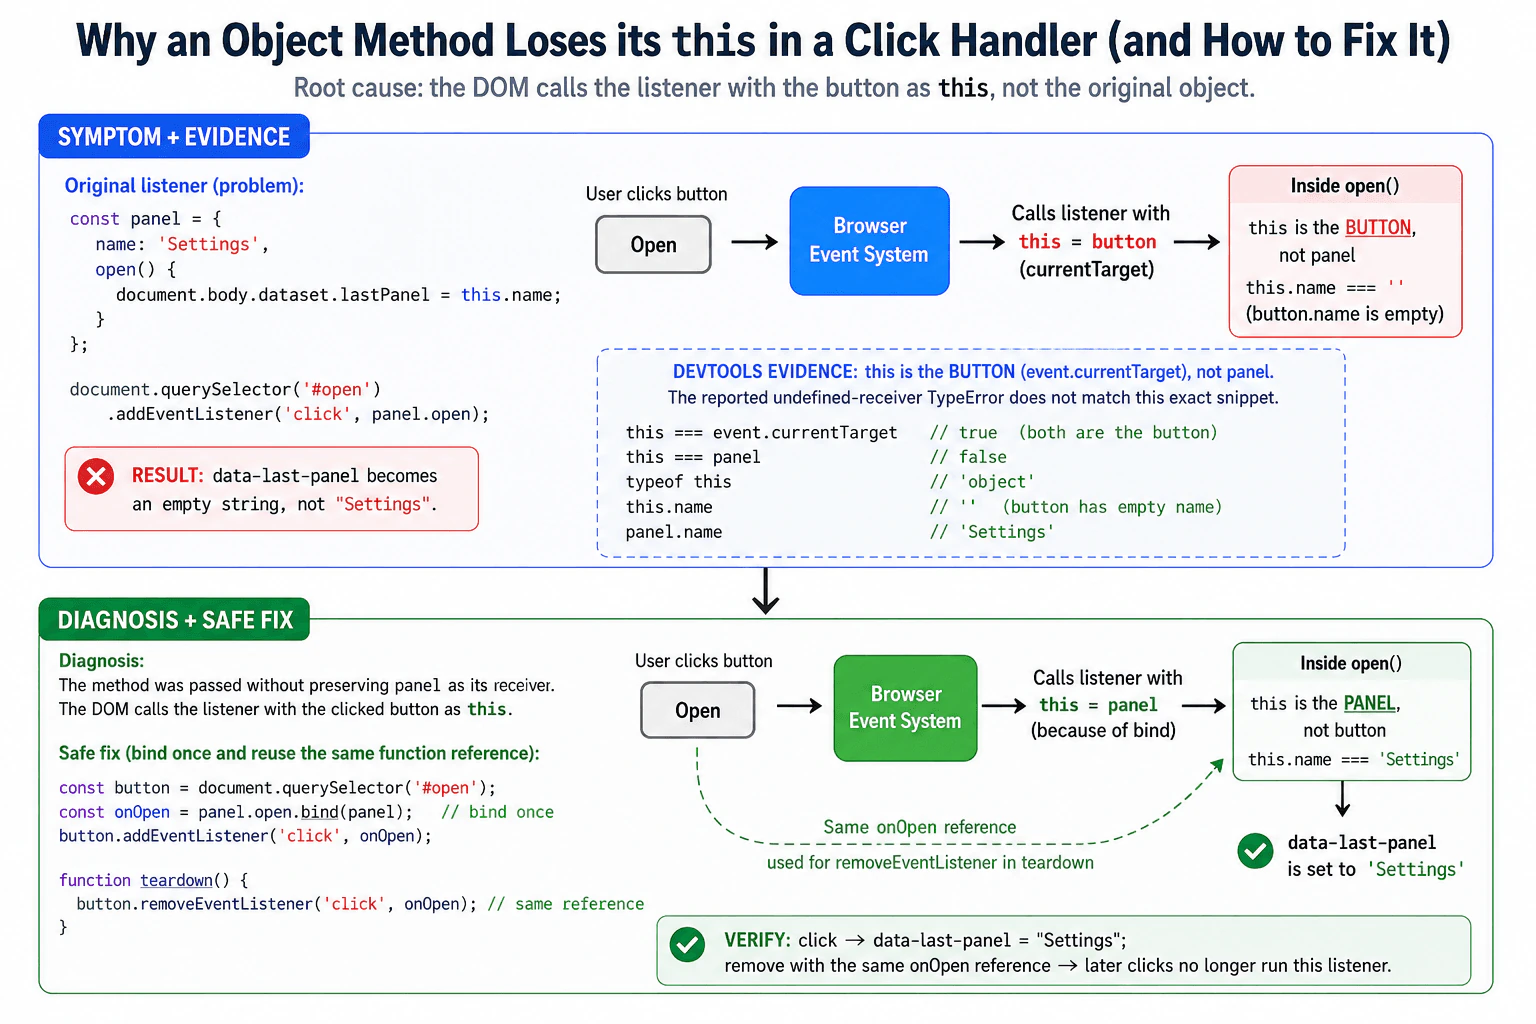
Passing panel.open does not preserve panel as this. The DOM calls the listener with the button as this, so this.name is not panel.name. I would prove that in DevTools, then store one panel.open.bind(panel) callback and reuse it for removal.
The button is given a function that normally belongs to the panel object. When the browser later runs that function after a click, it does not automatically remember the original object. The function therefore looks for name on the button instead of on panel. The first useful step is to stop the program while the function is running and inspect what object it is using. The reported error also does not match this complete example exactly, so I would check the real browser evidence before accepting the error description. The repair must also keep one function reference so cleanup can remove it later.
Useful Questions to Ask the Interviewer
Should I treat the supplied browser ES-module snippet as the complete reproduction, with no framework or wrapper changing how the callback is invoked?
Should teardown explicitly use removeEventListener with the original registered callback reference?
How to Explain It in an Interview
I would reproduce the click first and classify the problem. The code parses, the module can load, there is no network request, and no Promise is involved. This is a browser runtime callback-context problem.
The important difference is between calling panel.open() and passing panel.open as a value. With panel.open(), JavaScript evaluates a method call whose receiver is panel, so inside the method this === panel.
With addEventListener('click', panel.open), the code only gives the browser the function object. It does not give the browser a permanent association saying that the function must later run with panel as this.
For a normal function registered as a DOM event listener, the browser invokes the callback with the event's currentTarget as its this value. In this example, currentTarget is the button element. Therefore, while paused inside open, I expect this === event.currentTarget to be true and this === panel to be false.
This also exposes an important mismatch in the stated symptom. The exact supplied code should not normally throw TypeError: Cannot read properties of undefined (reading 'name') in a current evergreen browser. The DOM supplies the button as the listener receiver. An HTMLButtonElement also has a name property, whose default value is normally an empty string. Therefore this exact code is expected to assign an empty string to document.body.dataset.lastPanel, producing an empty data-last-panel attribute rather than the intended value Settings.
I would prove that instead of guessing. In DevTools Sources, I would put a breakpoint on the first line of open, click the button, and inspect this, event.currentTarget, and panel. While execution is paused, the Console can evaluate this === event.currentTarget, this === panel, this.name, and panel.name. The expected evidence is that the receiver is the button, this.name is an empty string unless the button has a name, and panel.name is Settings.
If DevTools really showed this === undefined or the stated TypeError, that would be evidence that the executed code differs from the complete reproduction, for example because another wrapper or direct detached call is involved. I would then use the stack trace and Sources panel to locate the actual invocation rather than changing the supplied snippet based on an inconsistent symptom.
The root-cause correction is to bind the method to panel. bind creates a new function whose this value is fixed to the supplied object. Because every call to bind creates a different function object, I would create the bound callback once and store it.
I would pass that stored callback to addEventListener, then use the exact same function reference with removeEventListener during teardown. This fixes the receiver and preserves reliable cleanup.
A stored arrow wrapper such as const onOpen = event => panel.open(event) is also valid. It works because the wrapper explicitly performs the method call panel.open(...). Binding is slightly more direct for this question because the main problem is preserving the object's method receiver.
For verification, I would click the button and confirm that document.body.dataset.lastPanel === 'Settings'. Then I would run teardown, change the dataset to a known marker, click the button again, and confirm that the marker does not change. A regression test should cover both the correct receiver and successful listener removal.
Key Insight / Why This Solution Works
Run the exact supplied ES-module page and reproduce the click.
Classify it as browser runtime callback behavior, not a syntax, build, module-loading, network, rendering, or Promise failure.
Put a breakpoint inside panel.open in the DevTools Sources panel.
Click the button and inspect this, event.currentTarget, this.name, and panel.name.
Confirm that this === event.currentTarget is true and this === panel is false for the original listener.
Compare the observed evidence with the reported TypeError. If this is the button, state that the supplied reproduction does not produce the reported undefined-receiver failure.
Create exactly one bound callback with panel.open.bind(panel) and store it.
Register that stored callback with addEventListener.
Click and verify that document.body.dataset.lastPanel becomes Settings.
Remove the listener using the exact same stored callback reference.
Click again after teardown and verify that no handler-side state change occurs.
Code
const panel = {
name: 'Settings',
open(event) {
// Diagnostic evidence: the corrected callback must run with panel as its receiver.console.assert(this === panel, 'Expected panel to be the callback receiver');
// Diagnostic evidence: binding this does not change which DOM element received the event.console.assert(
event.currentTarget === document.querySelector('#open'),
'Expected the button to remain event.currentTarget'
);
// Root-cause correction verification: this.name must now resolve to panel.name.document.body.dataset.lastPanel = this.name;
},
};
const button = document.querySelector('#open');
// Root-cause fix: create the bound callback once so this is always panel.const onOpen = panel.open.bind(panel);
// Register the stable callback reference that will also be used during teardown.
button.addEventListener('click', onOpen);
functionverifyOpen() {
// Verification: after a click, the intended panel name must be stored on the body.console.assert(
document.body.dataset.lastPanel === 'Settings',
'Expected data-last-panel to equal Settings'
);
}
functionteardown() {
// Teardown must use the exact function object originally passed to addEventListener.
button.removeEventListener('click', onOpen);
}
functionverifyTeardown() {
// Set a marker so a later accidental handler execution would be easy to detect.document.body.dataset.lastPanel = 'teardown-marker';
// Trigger a click after removal to verify that the removed listener no longer runs.
button.click();
// Regression evidence: the marker stays unchanged only if teardown succeeded.console.assert(
document.body.dataset.lastPanel === 'teardown-marker',
'Expected the removed listener not to run'
);
}
// Manual DevTools verification with the supplied HTML:// 1. Click the Open button, then run verifyOpen().// 2. Run teardown().// 3. Run verifyTeardown().
Why Interviewers Ask This
This question tests whether the candidate understands that extracting a JavaScript method does not permanently preserve its original object as this. It also tests knowledge of the DOM event-listener calling convention, evidence-driven debugging in DevTools, the ability to notice when a reported symptom does not match the supplied reproduction, and callback identity requirements for reliable removeEventListener teardown.
Common interview mistakes
One mistake is saying that ES modules make this inside this DOM listener undefined. Module code is strict, but the DOM event system supplies currentTarget as the receiver when it invokes a normal listener function. Another mistake is assuming that extracting panel.open permanently preserves panel as its object. A third mistake is calling bind once when adding and again when removing; the two calls create different function objects, so removal fails. Another mistake is claiming that the exact supplied snippet must throw the stated TypeError without reproducing it. In this snippet the original receiver is the button, whose name property normally exists and defaults to an empty string.
Interview tip
Start by reproducing and checking the receiver in DevTools. Explicitly point out that the stated TypeError does not match the complete snippet. Then explain panel.open() versus a detached panel.open callback, and finish with one stored bound function reused for both registration and teardown.
Interviewer may ask next
Why does button.removeEventListener('click', panel.open.bind(panel)) fail to remove a listener registered with an earlier panel.open.bind(panel) call?
Each call to bind() creates a new function object. removeEventListener matches the callback by function identity, so a newly bound function is not the same listener that was registered earlier. Create the bound callback once, store it in a variable such as onOpen, and pass that same reference to both addEventListener and removeEventListener.
Can a stored arrow-function wrapper replace bind, and what tradeoff does it have?
Yes. const onOpen = event => panel.open(event) works because the wrapper explicitly calls panel.open(...), which makes panel the receiver of that method call. The wrapper must still be stored and reused for removal. bind directly expresses the intent to preserve the method receiver, while a wrapper is useful when the callback also needs argument adaptation or extra behavior.
69. Debug a page freeze caused by recursive microtasks.DebuggingHard
Once Start is clicked with a non-empty queue, the meter stops animating, Stop cannot be clicked, CPU usage reaches one core, and no long timer callbacks run. A performance trace shows one task followed by an unbounded sequence of microtasks with no rendering opportunity. Identify the scheduling defect, explain why the stop handler cannot execute, and redesign queue draining to preserve throughput while yielding predictably to input and rendering. Include a measurable verification plan.
Short Interview Answer (30-60 seconds)
This is microtask starvation. drain keeps adding another microtask before the checkpoint can finish, so Stop, timers, and rendering cannot run. Process a bounded number of items or milliseconds, then explicitly yield to task scheduling before continuing, and verify both responsiveness and queue throughput.
The page becomes unresponsive because, after Start is pressed, it keeps doing more work immediately and never gives the page a normal chance to handle anything else. The work keeps adding another piece of work before the screen can update or another button press can be handled. That is why the meter stops moving, Stop does nothing, delayed actions do not run, and one processor stays busy. The fix is to do only a limited amount at once, regularly give control back, and then continue until the work is finished or Stop is pressed.
Useful Questions to Ask the Interviewer
Does processOneQueueItem() remove exactly one item, and can producers add new items while draining?
What responsiveness target should we meet for Stop or other user input?
Is scheduler.yield() allowed for supported browsers if we provide a task-based fallback?
Should the drainer stop when the queue becomes empty, or remain active waiting for later items?
How to Explain It in an Interview
I would first reproduce the freeze with the Performance panel recording. The important evidence is already described in the question: one task is followed by an unbounded sequence of microtasks, with no rendering opportunity. That immediately points to scheduling starvation rather than a syntax error, module-loading problem, runtime exception, network failure, stale DOM state, or memory-retention problem.
A microtask is follow-up JavaScript work that the browser drains at a microtask checkpoint before moving on to later tasks and rendering opportunities. queueMicrotask(drain) therefore does not behave like a normal task-level yield.
The Start click runs as a task. It sets running to true and calls drain(). drain processes one item and queues another drain microtask. When the Start task finishes, the browser starts its microtask checkpoint. The queued drain runs, processes an item, and queues another microtask. That next drain does the same thing. As long as running stays true and processing continues, the microtask queue keeps replenishing itself and the checkpoint never completes.
That explains every symptom. Stop cannot execute because its click handler would run from a later input task, and the browser never reaches that task. The running check does not help: running cannot become false until the Stop handler gets a chance to execute. Timer callbacks are also delivered through later tasks, so they are starved. requestAnimationFrame callbacks run around rendering opportunities, but the browser never escapes the endless microtask checkpoint to reach one. CPU use approaches one core because JavaScript keeps running continuously on the main thread.
Containment is to bound the amount of work performed before yielding. The root-cause fix is to remove the recursive microtask scheduling and use cooperative queue draining: process only a limited number of items or a short time budget, then explicitly yield through task scheduling before starting the next slice.
Using both an item limit and a time limit is useful. An item limit protects against accidentally processing an enormous number of cheap items in one slice. A time limit protects responsiveness when individual items have different execution costs. The slice ends when either limit is reached.
When available, scheduler.yield() provides an explicit cooperative yield and resumes the continuation later rather than extending the current microtask checkpoint indefinitely. Because support can differ between browsers, a task-based fallback such as MessageChannel can schedule the continuation as a later task without the timer-delay behavior associated with setTimeout. Either approach breaks the self-perpetuating microtask chain and creates opportunities for other browser work between slices.
The drainer should check running before each slice and inside the slice. Once a task boundary exists, the Stop input can be dispatched, its handler can set running to false, and the next drain iteration will stop. Checking during a slice also prevents unnecessary extra work after state changes that happen between slices.
There is an important limitation: yielding creates opportunities for input and rendering; it does not promise that every yield produces a painted frame. Rendering still depends on the browser's rendering schedule and display timing. A small bounded slice makes those opportunities frequent enough for responsive behavior. If the application specifically requires one batch per visual frame, requestAnimationFrame can be used deliberately, but that couples processing throughput to frame cadence and is not necessary for a general queue drainer.
The main tradeoff is slice size. Larger slices reduce scheduling overhead and can improve raw throughput, but they increase worst-case input and rendering delay. Very small slices improve responsiveness but create more scheduling overhead. I would choose initial limits such as 100 items or about 5 milliseconds, then tune them from measurements rather than treating those numbers as universal constants.
For verification, I would record another Performance trace while keeping the queue continuously non-empty. The new trace should show bounded processing slices separated by task boundaries instead of one endless microtask sequence. Input tasks and timer callbacks should execute, and rendering opportunities should return. I would measure the delay from the Stop event timestamp until its handler runs, longest processing-slice duration, animation-frame progress, processed items per second, and whether scheduled timers continue firing.
I would define measurable acceptance criteria before tuning. For example, if the interviewer agrees, require every processing slice to remain near the chosen 5 millisecond budget, require Stop input delay to stay below an agreed threshold under the test workload, require the meter to keep advancing, and compare items processed per second against the original implementation. The exact latency and throughput thresholds should come from product requirements rather than be invented as universal browser guarantees.
The regression test should keep supplying enough work that the queue does not naturally empty. It should then prove that a timer executes, animation frames continue, and a Stop interaction can terminate draining within the agreed bound. This specifically tests the failure mode that caused the freeze instead of merely checking that a finite queue eventually completes.
Key Insight / Why This Solution Works
Reproduce the freeze with a continuously non-empty queue and record a Performance trace.
Confirm that the Start task is followed by a self-replenishing microtask sequence with no later input, timer, or rendering progress.
Identify recursive queueMicrotask(drain) scheduling as the root cause.
Bound each processing slice by both item count and elapsed time.
Replace recursive microtask scheduling with an explicit task-level yield between slices.
Prefer scheduler.yield() where supported and use a MessageChannel task as the fallback.
Check running before and during every slice.
Stop cleanly when requested or when the queue becomes empty.
Re-record the trace under a continuously replenished workload.
Measure slice duration, Stop input delay, animation progress, timer progress, CPU behavior, and processed items per second.
Add a regression test that proves continuous queue work cannot monopolize the event loop.
Code
const startButton = document.createElement('button');
startButton.textContent = 'Start';
startButton.id = 'startButton';
const stopButton = document.createElement('button');
stopButton.textContent = 'Stop';
stopButton.id = 'stopButton';
const meter = document.createElement('progress');
meter.max = 100;
meter.value = 0;
const stats = document.createElement('pre');
document.body.append(startButton, stopButton, meter, stats);
let running = false;
let drainPromise = null;
// Use a head index instead of Array.shift() so taking one item stays O(1).const queue = [];
let queueHead = 0;
// These are starting points for measurement, not universal performance guarantees.constMAX_ITEMS_PER_SLICE = 100;
constMAX_SLICE_MS = 5;
let processedItems = 0;
let completedSlices = 0;
let longestSliceMs = 0;
let frameCount = 0;
let timerCount = 0;
let lastStopInputDelayMs = null;
functionenqueue(item) {
// Producers append work normally; the head index tracks the next unprocessed item.
queue.push(item);
}
functionhasQueueItem() {
// Comparing the head with length avoids mutating the array just to inspect it.return queueHead < queue.length;
}
functionprocessOneQueueItem() {
// Read and clear one slot so completed object values are not retained unnecessarily.const item = queue[queueHead];
queue[queueHead] = undefined;
queueHead++;
// Stand-in CPU work for the real queue-item processor.Math.sqrt(item);
processedItems++;
// Reset indices after the current queue is fully consumed.if (queueHead === queue.length) {
queue.length = 0;
queueHead = 0;
}
}
functionmessageChannelYield() {
// MessageChannel posts a later task, breaking the recursive-microtask starvation cycle.returnnewPromise((resolve) => {
const channel = newMessageChannel();
channel.port1.onmessage = () => {
channel.port1.close();
channel.port2.close();
resolve();
};
channel.port2.postMessage(null);
});
}
asyncfunctionyieldToBrowser() {
// Prefer the browser's cooperative scheduling primitive when it is available.if (typeof globalThis.scheduler?.yield === 'function') {
await globalThis.scheduler.yield();
return;
}
// Fall back to a later task rather than scheduling another microtask.awaitmessageChannelYield();
}
asyncfunctiondrain() {
while (running) {
const sliceStartedAt = performance.now();
let itemsThisSlice = 0;
// Bound both item count and elapsed time to protect main-thread responsiveness.while (
running &&
hasQueueItem() &&
itemsThisSlice < MAX_ITEMS_PER_SLICE &&
performance.now() - sliceStartedAt < MAX_SLICE_MS
) {
processOneQueueItem();
itemsThisSlice++;
}
const sliceMs = performance.now() - sliceStartedAt;
longestSliceMs = Math.max(longestSliceMs, sliceMs);
completedSlices++;
// A currently empty queue has no useful work to drain in this standalone example.if (!hasQueueItem()) {
running = false;
break;
}
// This task-level yield is the root-cause correction: it lets the browser leave// the current JavaScript work and gives input, timers, and rendering opportunities.awaityieldToBrowser();
}
}
startButton.addEventListener('click', () => {
// Prevent multiple concurrent drain loops from processing the same queue.if (running) return;
running = true;
drainPromise = drain().catch((error) => {
// Preserve diagnostic visibility instead of swallowing unexpected failures.
running = false;
console.error('Queue draining failed:', error);
throw error;
});
});
stopButton.addEventListener('click', (event) => {
// Event.timeStamp lets the test estimate how long this input waited before handling.
lastStopInputDelayMs = Math.max(0, performance.now() - event.timeStamp);
running = false;
});
functionframe() {
// Continued frame progress is visible evidence that rendering is no longer starved.
meter.value = (meter.value + 1) % (meter.max + 1);
frameCount++;
requestAnimationFrame(frame);
}
requestAnimationFrame(frame);
setInterval(() => {
// A progressing timer count verifies that later timer tasks receive execution time.
timerCount++;
stats.textContent = JSON.stringify(
{
running,
processedItems,
completedSlices,
longestSliceMs: Number(longestSliceMs.toFixed(2)),
frameCount,
timerCount,
lastStopInputDelayMs:
lastStopInputDelayMs === null ? null : Number(lastStopInputDelayMs.toFixed(2)),
remainingItems: queue.length - queueHead,
},
null,
2
);
}, 250);
// Supply enough work to observe sustained draining and measure responsiveness.for (let i = 0; i < 100000; i++) {
enqueue(i);
}
Why Interviewers Ask This
This question tests whether the candidate understands browser event-loop scheduling, especially the difference between tasks and microtasks, why an endlessly replenished microtask queue can starve input, timers, and rendering, how to prove that diagnosis with Performance evidence, and how to redesign CPU-heavy main-thread work so responsiveness improves without unnecessarily destroying throughput.
Common interview mistakes
A common mistake is treating queueMicrotask as a cheap version of setTimeout. It is not a task-level yield. Another mistake is adding more running checks while keeping the recursive microtask chain; Stop still cannot change running because its handler remains starved. Using Array.shift() in a large array queue can add avoidable reindexing cost and invalidate a claimed O(n) processing bound. Another mistake is using an extremely large batch that technically yields but still causes noticeable input delay. Yielding after every item can hurt throughput unnecessarily. It is also incorrect to claim that a paint is guaranteed after every yield; a yield creates an opportunity for browser work, while actual rendering follows the browser's rendering schedule. Finally, testing only a finite queue can hide the original defect because starvation may disappear when the queue naturally empties.
Interview tip
Start with the exact diagnosis: an unbounded recursive microtask chain starves later work. Use the trace to prove it, explain why Stop cannot change running until its task executes, then propose bounded slices plus a task-level yield. Finish with measurable input-latency, rendering, timer, and throughput verification.
Interviewer may ask next
Why does checking running inside drain not make the Stop button work in the original version?
Because the Stop click handler must execute before it can set running to false. That handler belongs to later input work, but the recursive queueMicrotask chain keeps replenishing the current microtask checkpoint. The browser never reaches the Stop handler, so every drain call continues seeing running as true. A state check helps only after the scheduler gives the input handler an execution opportunity.
Why use both a time budget and an item-count limit for each slice?
An item-count limit works well when items have similar costs, but one unusually expensive item or a set of expensive items can still make a slice too long. A time budget limits elapsed main-thread occupation when item costs vary. Using both provides two safeguards: stop after enough items or after enough time. The values should then be tuned from measured input latency and throughput rather than treated as universal constants.
70. What is frontend testing?TestingEasy
i Question Details
Define frontend testing as checking that browser-visible behavior and its supporting units work correctly under expected, boundary, failure, and accessibility conditions. Explain unit, component, integration, contract, visual, and end-to-end tests; arrange-act-assert; deterministic setup; user-observable assertions; test doubles; and the role of a balanced test strategy.
Short Interview Answer (30-60 seconds)
Frontend testing checks that browser visible behavior and the supporting frontend units work correctly. I use unit tests for small logic, component tests for user interface behavior, integration tests for parts that work together, contract tests for API shapes, visual and accessibility tests for the interface, and end to end tests for important browser journeys. I arrange a controlled state, perform an action, and assert what the user can observe. The tradeoff is that broader tests give more confidence about real user behavior, but they are slower and cost more to maintain.
Detailed Explanation
Frontend testing means checking that the parts of a web page work the way a user expects. We test small pieces, complete screen parts, connections between parts, and important journeys through the browser. We also check unusual input, errors, accessibility, and unwanted visual changes. Good tests start from a known state, perform an action, and check a visible result. Some outside parts can be replaced with controlled versions so the test stays stable. No single test can prove everything, so we combine different kinds of tests for useful confidence.
Useful Questions to Ask the Interviewer
Which frontend framework and test tools does the project already use?
Which user journeys are most important to protect?
Are accessibility and visual checks part of the normal test process?
How to Explain It in an Interview
The first goal is to define the behavior that should give us confidence. For frontend code, this usually means something the user can see, do, or experience in the browser, plus the smaller units that support that behavior.
A unit test checks a small function, utility, or state change in isolation when browser behavior is not required. It is usually fast and easy to debug.
A component test renders the real user interface component needed by the behavior. The test interacts with it through actions such as clicking, typing, or submitting. It then checks rendering, state, text, accessible roles, or other results the user can observe.
An integration test checks whether several frontend parts work together. This can include components, routing, state, storage, browser APIs, or a controlled network boundary. It gives more confidence about collaboration than a small isolated test, but it normally requires more setup and takes longer to run.
A contract test checks that frontend requests and response parsing match a documented remote API contract. It can verify supported request shapes, response shapes, fields, and status behavior without claiming that the real remote system is available or correct.
A visual test checks for unintended changes in the rendered interface. An accessibility test checks semantics, names, roles, focus, keyboard behavior, announcements, and automated accessibility rules. Automated accessibility checks are useful, but they do not replace manual testing with assistive technology.
An end to end test runs an important user journey in a real browser against a controlled deployed environment. It provides broad confidence that major frontend parts work together, but it is slower and more expensive than smaller tests.
A useful structure for each test is Arrange, Act, Assert. Arrange means creating a deterministic starting state and controlled inputs. Act means performing the behavior being tested. Assert means checking the result that the user or another public boundary can observe.
Test doubles are used only when a clear dependency boundary should be controlled. A stub returns controlled data. A spy records calls. A mock controls a dependency and sets an expected interaction. A fake provides a lightweight working implementation. For frontend network behavior, a controlled request handler can replace the remote boundary while the frontend request behavior remains realistic. A controlled test does not prove that the real network or remote service works.
Reliable tests avoid random shared state. Time, randomness, storage, network handlers, and other global changes should be controlled only when needed and restored after the test. Tests should not depend on test order. Async actions and results should be awaited instead of using fixed delays.
Assertions should focus on user observable behavior instead of private component methods or incidental implementation details. Tests should cover expected behavior, boundary values, failure behavior, and accessibility conditions when those cases matter.
A balanced strategy uses many fast unit and component tests, enough integration and contract tests to check important collaboration, and a smaller number of end to end tests for critical journeys. Visual and accessibility tests protect interface quality where needed. As tests cover more real user behavior, their runtime, setup cost, and maintenance cost usually increase while feedback becomes slower.
Frontend testing has a clear boundary. It can check what users see, user actions, frontend state and logic, controlled API requests and responses, and accessibility behavior. It does not by itself prove backend services, databases, authentication providers, external notification or payment systems, or large scale performance are correct. Those areas need their own testing.
The main limitation is that every test proves only what exists inside its boundary. An isolated component test cannot prove that the real backend works. A contract test cannot prove that a remote service is available. An end to end test gives broader confidence, but it still cannot cover every browser, device, data combination, or failure. That is why several test levels work together.
Technical Approach
Define the browser visible behavior that should be protected.
Choose the smallest test level that can prove that behavior with enough confidence.
Arrange deterministic data, state, and dependency boundaries.
Act through the public interface, preferably with realistic user actions when browser behavior matters.
Assert visible results, accessible state, and only important public interactions.
Add expected, boundary, failure, and accessibility cases when they matter.
Clean up rendered state, test doubles, handlers, timers, storage, and global changes.
Run every test independently in local development and continuous integration.
Keep a balanced mix of fast small tests and fewer broad browser tests.
Practical Insights
Traditional algorithmic complexity is not the main concern for this question. The practical cost comes from test runtime, setup, isolation, maintenance, and continuous integration time. Unit tests are usually fastest and cheapest. Component and integration tests require more rendering and dependency setup. Contract, visual, accessibility, and end to end tests may require network handlers, browser environments, snapshots, or deployed test environments. Broader tests cover more real user behavior, but they normally run more slowly and cost more to maintain. A balanced strategy keeps most feedback fast while using broader tests where their extra confidence is valuable.
Why Interviewers Ask This
Interviewers ask this to see whether you understand what frontend tests should prove, how to choose the right test boundary, and how to keep tests reliable. They also want to know whether you can separate user visible behavior from implementation details, choose when to replace dependencies, and balance fast isolated tests with broader browser tests.
Common interview mistakes
Common mistakes include testing implementation details instead of user observable behavior, replacing the wrong dependency boundary, using too many test doubles, confusing stubs, spies, mocks, and fakes, sharing mutable fixtures between tests, depending on test order, calling production remote services from automated frontend tests, leaving async work or timers running, using fixed sleep calls, writing weak assertions, ignoring boundary and failure cases, treating code coverage as proof of quality, and claiming that a controlled test proves the real browser, network, backend, or external service works.
Interview tip
Start with the browser visible behavior you want confidence in. Then explain the test level, what remains real, what is controlled, what you assert, and what that test cannot prove. Finish by explaining why a balanced mix of many fast tests and fewer broad browser tests gives useful confidence without making feedback too slow.
Interviewer may ask next
How would you handle a frontend test that becomes flaky because it depends on time or a network response?
I would keep the same frontend behavior boundary but control the unstable dependency. For time based behavior, I would use the test runner's controlled clock only when time is part of the behavior and restore the real clock afterward. For network behavior, I would use a controlled request handler with explicit responses instead of a live remote service. I would still interact with the frontend normally and assert user visible results. This matters because the test should fail when frontend behavior is wrong, not because time or the network changed. The tradeoff is that the controlled test does not prove the real remote integration works.
When should an important frontend behavior use an end to end test instead of only a component test?
I would add an end to end boundary when the behavior depends on a complete real browser journey that a component test cannot prove. Examples include full navigation, browser specific behavior, focus across screens, downloads, or a critical workflow across several application areas. The test should run in a real browser against a controlled deployed environment. This matters because it checks more of the real user journey. The tradeoff is that end to end tests are slower and more expensive to maintain, so I would keep detailed behavior in smaller tests and reserve broad tests for important journeys.
More questions load as you scroll
Disclaimer: This interview guide is for educational and informational purposes only. It is designed to help readers prepare, but it does not guarantee any interview result, hiring decision, offer, or outcome. Interview questions, hiring criteria, and preferred answers can vary by employer, interviewer, industry, location, and time. All answers, examples, and explanations in this guide are suggested examples for interview preparation, not definitive answers or instructions for professional practice. They are based on research and judgment, are provided without warranties of any kind, and should be adapted to the question, role, and applicable laws and professional requirements. Diagrams are simplified illustrations intended to highlight the main concepts and their relationships; actual situations, systems, and practices may be more complex. Alternative approaches may be equally valid or better suited to a particular question, context, or interviewer. To the fullest extent permitted by applicable law, the contributors and publisher are not liable for decisions made, actions taken, or losses incurred based on this guide.
State Laws and Professional Responsibilities: Laws and requirements governing an occupation vary by state and jurisdiction. You are responsible for checking the current laws, licensing requirements, and scope-of-practice rules that apply to your location and role, and for ensuring that your answers and actions comply with them. Adapt examples in this guide to those requirements. This guide is not legal advice.
Content Accuracy and Verification: To the fullest extent permitted by applicable law, we do not represent or warrant that interview guides, questions, answers, examples, or diagrams are accurate, complete, current, error-free, or suitable for any particular purpose. You are responsible for independently reviewing and verifying the information before relying on it.