277 JavaScript Frontend Developer Interview Questions & Answers

133 top • 30 Amazon • 15 Apple • 29 Google • 18 Meta • 21 Microsoft • 20 Netflix • 11 NVIDIA

JavaScript Frontend Developer icon

Questions with Detailed ExplanationsWith Detailed Explanations

(Last Updated: September 1, 2026)

81. How would you test a sortable, paginated data table?TestingMedium

Question Details

The table renders ten rows per page from a 27-record fixture, supports ascending and descending sort by name, exposes column headers and sort state accessibly, and fetches a new page on navigation. Define unit tests for pure ordering, DOM integration tests for header and pagination controls, delayed success and error fixtures, focus behavior, stable-row expectations for duplicate names, browser boundary, and mocked versus real network use. Include a test that a stale page response cannot replace the currently requested page.

Short Interview Answer (30-60 seconds)

I would split the tests by confidence boundary. I would unit test the pure name ordering in both directions, including stable ordering for duplicate names. I would render the real table for header sorting, pagination, accessible sort state, loading, errors, keyboard use, and focus. I would use Mock Service Worker for deterministic page responses, including delayed and failed responses. I would also prove that a slow page two response cannot overwrite page three. Finally, I would keep a smaller Playwright test with a real browser and controlled real network path because mocked component tests do not prove the complete browser flow.

Detailed Explanation

This table shows ten records at a time from twenty seven records. A person can sort names, move between pages, and see when new information is loading or when something goes wrong. The tests should check that names appear in the correct order, page controls show the correct records, repeated names keep their original order, and an old request cannot replace newer information. They should also check that a person using a keyboard can reach and use the controls, that focus behaves as expected, and that the current sort direction is communicated clearly.

Useful Questions to Ask the Interviewer
  1. Should the selected name sort apply across every requested page or only to rows already loaded in the browser?
  2. After a page change, which element should receive focus according to the product requirement?
  3. Is there already a controlled browser test environment that can use the real network path?
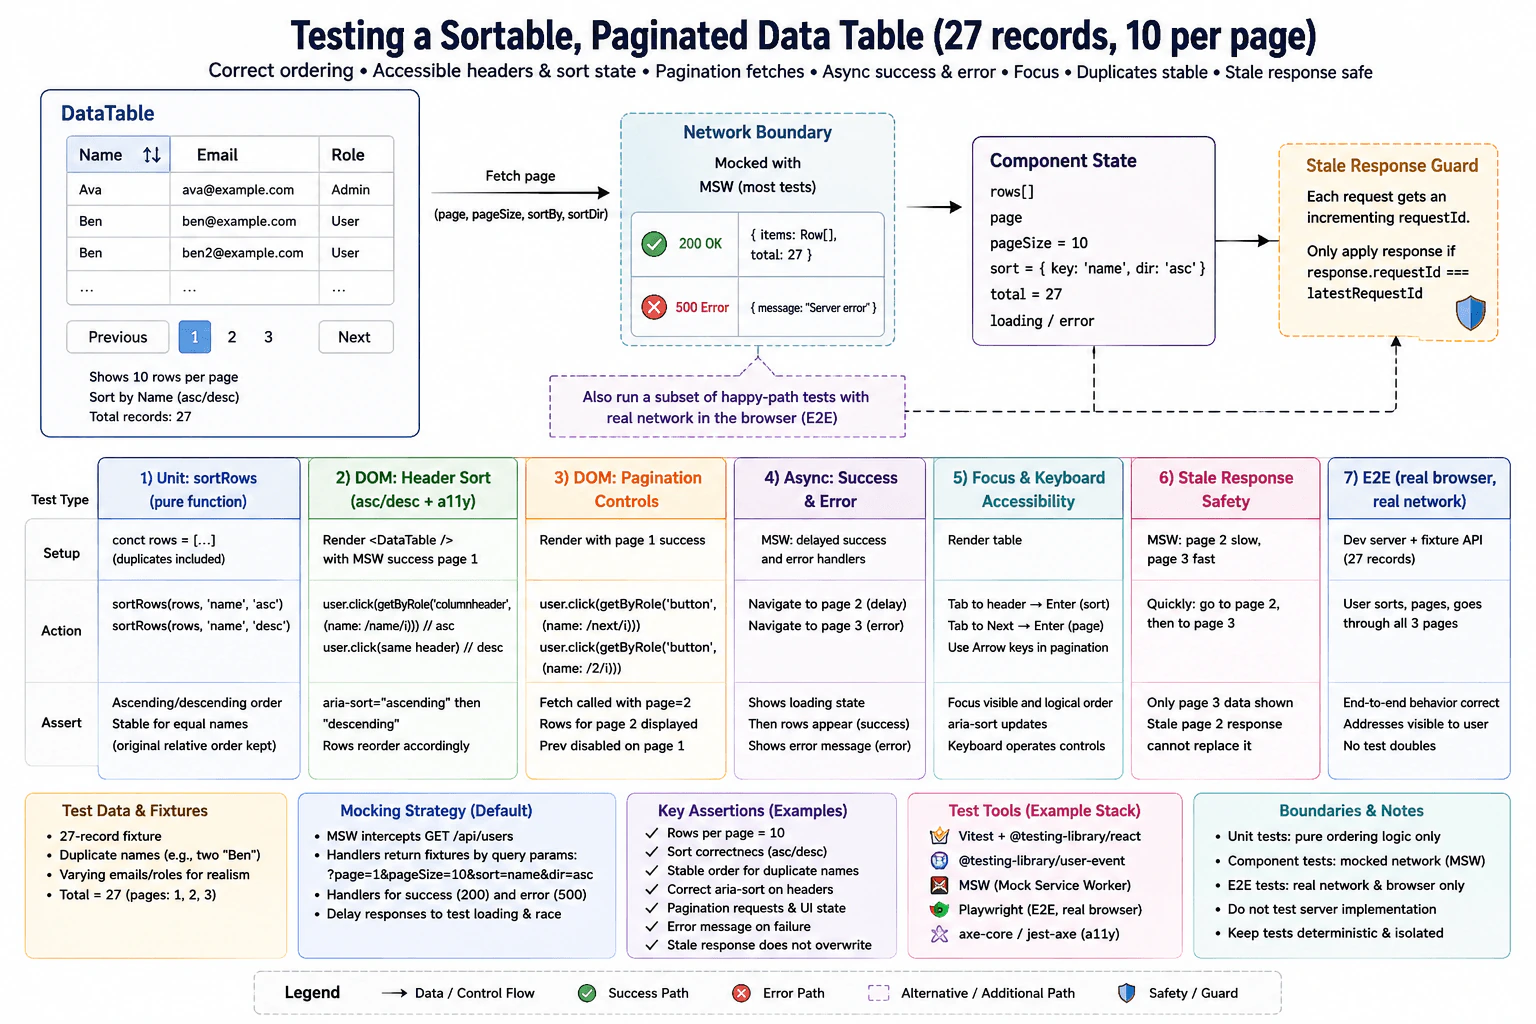
How would you test a sortable, paginated data table? diagram
How to Explain It in an Interview

I would start by separating the behavior into confidence boundaries.

First, I would unit test the pure sortRows logic. I would use explicit rows with different names and duplicate names. I would verify ascending order, descending order, and stability. Stability means that two rows with the same name keep their original relative order. This test does not need a DOM or network.

Next, I would render the real DataTable component for DOM integration tests. The fixture contains twenty seven records, and the table shows ten rows on each page. I would interact with the component through accessible roles and names rather than private state or component methods.

For header sorting, I would activate the Name column header once and verify ascending row order. I would activate the same header again and verify descending order. I would also assert that the column header exposes the correct accessible sort state after each action.

For pagination, I would begin on page one. I would verify that Previous is disabled there. I would activate Next or page two, verify that the component requests page two with the expected page, page size, sort key, and sort direction values, and then verify that the page two rows become visible. With twenty seven records and ten rows on each page, the interface has three pages.

For most component tests, I would keep the real component request code and replace only the network boundary with Mock Service Worker. The handlers would return the fixture data requested by the component. I would create normal success, delayed success, and error handlers. This keeps the tests deterministic while still exercising the component request flow.

For delayed success, I would verify that the loading state appears while the response is pending and that the expected rows appear when the response completes. For the error handler, I would verify that the visible error state appears. I would wait for observable conditions with Testing Library utilities instead of using a fixed sleep.

The most important asynchronous edge case is the stale response test. I would make page two respond slowly and page three respond faster. I would request page two and then quickly request page three. Each request would receive an increasing request identifier. Page three would finish first and become visible. I would then allow the old page two response to finish. The component must apply a response only when its request identifier equals the latest request identifier. The final assertion is that page three data remains visible and the late page two response does not replace it.

I would also test keyboard and focus behavior. A keyboard user should be able to reach the sortable header and pagination controls in a logical order. Activating the header with the keyboard should change the sort and accessible sort state. Activating a pagination control should update the page and move focus to the product defined target. The test should verify visible focus and the expected focus target rather than guessing from internal implementation.

The example test stack shown by this design uses Vitest with Testing Library and userEvent for component behavior, Mock Service Worker for the controlled request boundary, and Playwright for a smaller end to end browser test. An axe based accessibility check can catch common automated accessibility problems, but it does not replace the keyboard and focus assertions.

The Playwright test should use a real browser and a controlled test service. It should exercise a complete user flow such as sorting by name, moving through the pages, and checking the visible rows. This layer gives browser and real network confidence that the mocked component tests cannot provide. It should not depend on production systems or production user data.

After every component test, I would reset Mock Service Worker handlers, clear any mocks or timers that were changed, unmount the rendered component, and restore changed browser state. Each test should create independent fixture state so test order cannot affect the result.

This gives a useful balance. Unit tests make pure ordering failures easy to diagnose. DOM tests give strong coverage of visible sorting, pagination, accessibility, loading, errors, focus, and stale response protection. A small real browser layer then checks the complete flow without making every test slow or dependent on real network behavior.

Key Insight / Why This Solution Works
  1. Define the visible behavior. The table shows ten rows on each page from twenty seven records, sorts by name in both directions, exposes accessible sort state, changes pages, handles loading and errors, supports keyboard and focus behavior, keeps duplicate names stable, and blocks stale responses.
  1. Unit test sortRows with explicit records. Verify ascending order, descending order, and stable relative order when names are equal.
  1. Render the real DataTable for DOM integration tests. Find the Name header and pagination controls with accessible queries.
  1. Configure Mock Service Worker handlers that return the requested fixture page. Add success, delayed success, error, and controlled race behavior.
  1. Test sorting. Activate the Name header once and assert ascending order and accessible sort state. Activate it again and assert descending order and the updated accessible sort state.
  1. Test pagination. Verify Previous is disabled on page one. Request page two and assert the expected request parameters and visible page two rows.
  1. Test delayed success and error behavior. Assert loading while the delayed response is pending, rows after success, and a visible error after failure.
  1. Test the stale response guard. Give page two a slow response and page three a faster response. Request page two and then page three. Apply page three first, release page two later, and assert that page three remains visible because only the latest request identifier may update the table.
  1. Test keyboard and focus behavior. Reach the header and pagination controls with the keyboard, activate them, and assert the accessible state and product defined focus target.
  1. Run a smaller Playwright test in a real browser with a controlled test service. Cover a complete flow that sorts and moves through pages.
  1. Reset request handlers, mocks, timers, rendered DOM, and changed browser state so every test remains independent.
Why Interviewers Ask This

Interviewers ask this to see whether I can separate pure ordering logic from visible component behavior and real browser behavior. They also want to see whether I choose a useful network boundary, control asynchronous work reliably, test accessibility and focus, keep duplicate rows stable, and prevent an older page response from replacing the page the user most recently requested.

Common interview mistakes

Common mistakes include testing private component state instead of visible behavior, mocking the component request logic instead of the network boundary, using a live production service in normal component tests, using fixed sleep calls, forgetting stable ordering for duplicate names, checking only successful requests, ignoring keyboard and focus behavior, failing to reset Mock Service Worker handlers, sharing mutable fixtures between tests, and forgetting that a slow older page response can arrive after the newest response and incorrectly replace the current rows.

Interview tip

Explain the boundaries in order. Start with pure sorting, then the rendered table, then the controlled Mock Service Worker network boundary, and finally the smaller real browser test. Call out the stale response race because it shows production awareness. Also state clearly that mocked component tests give deterministic coverage but do not prove the complete real browser and network path.
Interviewer may ask next
How would you test the race condition when page two is slow and page three returns first?

I would test it at the rendered component and Mock Service Worker boundary. I would keep the page two response pending, request page three, and let page three finish first. Each request would have an increasing request identifier. After page three becomes visible, I would release the older page two response. The component must ignore it because its identifier is not the latest identifier. The final assertion is that page three remains visible. This matters because an older response must not overwrite the user's newest page choice. The extra controlled response setup is worthwhile because it makes this race deterministic.

Why not run every sorting and pagination test through Playwright with the real network?

I would keep most coverage at the unit and DOM component boundaries and use Playwright for a smaller complete browser flow. Unit and component tests run faster, isolate failures better, and let Mock Service Worker control delay, failure, and race cases precisely. Playwright is still needed because a real browser gives confidence in the complete visible flow and real network boundary. The tradeoff is runtime and maintenance cost, so CI should contain many deterministic lower level tests and a focused set of real browser tests.

82. How would you test a client-side file upload component?TestingMedium

Question Details

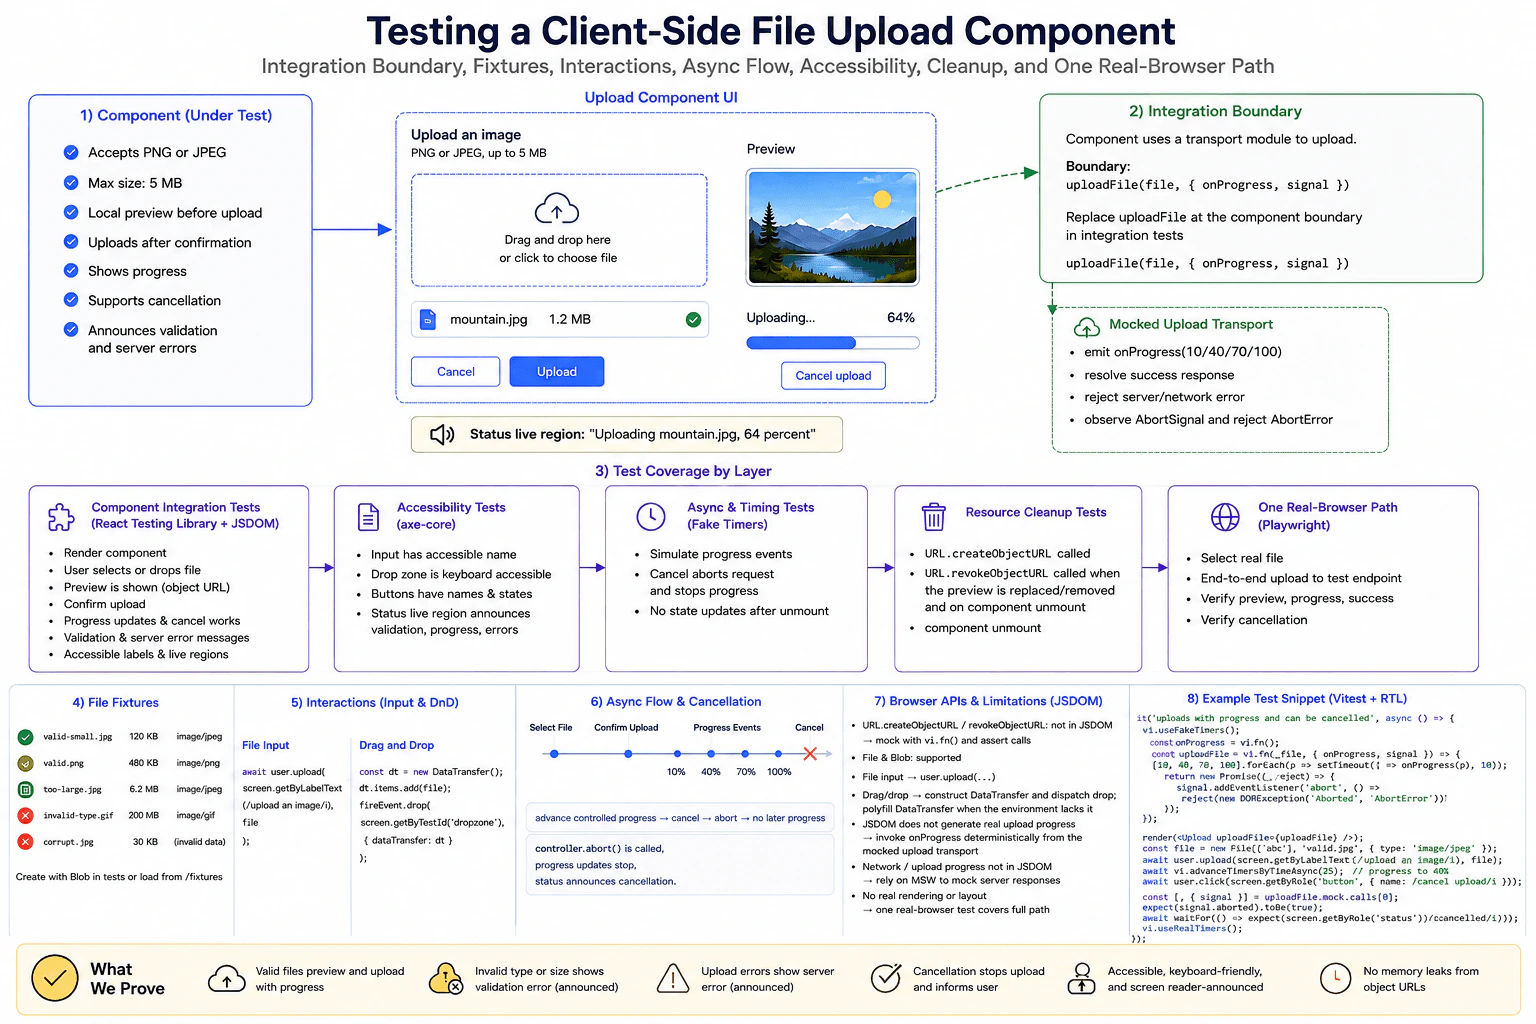
The component accepts one PNG or JPEG up to 5 MB, shows a local preview, uploads after confirmation, reports progress, supports cancellation, and announces validation or server errors. Define the component integration boundary, file fixtures including invalid type and size, input and drag-and-drop interactions, asynchronous progress and cancellation timing, accessible labels and status messages, object-URL cleanup, browser API limitations in the test environment, mocked transport, and one real-browser upload path.

Short Interview Answer (30-60 seconds)

I would use component integration tests as the main layer. I would render the real upload component, use small PNG and JPEG fixtures plus invalid type and size fixtures, and replace only the uploadFile transport boundary. I would test file input and drag and drop, preview creation, confirmation, controlled progress, cancellation through AbortSignal, validation and server messages, accessible announcements, and object URL cleanup. I would keep timing deterministic with fake timers instead of fixed sleeps. Then I would add one Playwright path with a real file because a simulated DOM cannot prove real browser file behavior.

Detailed Explanation

See the Code while reading this explanation.

I would test what a person can actually do with the upload control. A valid picture should show a preview before anything is sent. The person should confirm the upload, see progress, cancel it if needed, and receive a clear message when something goes wrong. I would also try a file with the wrong kind and one that is too large. Most checks can run in a fast test environment, but I would keep one real browser check because some file and browser behavior cannot be proven there.

Useful Questions to Ask the Interviewer
  1. Is uploadFile passed into the component or imported by it?
  2. Should the preview remain visible after a successful upload?
  3. What wording and live region behavior should the component use for errors and progress?
  4. Does the project use Vitest and React Testing Library for component tests and Playwright for browser tests?
How would you test a client-side file upload component? diagram
How to Explain It in an Interview

I would start with the confidence boundary. The real component stays in the test because I want confidence in what the user sees and does. I replace the uploadFile transport boundary so success, failure, progress, and cancellation are deterministic. The component still receives a file, creates a preview, waits for confirmation, updates visible progress, reacts to cancellation, and announces status changes.

For fixtures, I would use a small valid PNG, a small valid JPEG, a JPEG over 5 MB, a GIF with an invalid type, and invalid image data. Each test gets its own fixture so tests do not depend on shared mutable state.

For the file input, I would use Testing Library user events to choose a file through its accessible label. For drag and drop, I would create a DataTransfer object, add the file, and dispatch a drop event. If the simulated environment does not provide DataTransfer, I would provide a small test polyfill. I would assert visible behavior rather than private component state.

For preview behavior, I would replace URL.createObjectURL because a simulated DOM does not create the real browser object URL behavior needed by the component. A valid file should make the preview appear. I would also check URL.revokeObjectURL when the preview is replaced, removed, or when the component unmounts. I would not revoke the URL only because an upload completed if the same preview is still displayed.

For upload progress, the mocked uploadFile function receives onProgress and signal. The fake transport can call onProgress with controlled values such as 10, 40, 70, and 100. If those callbacks are scheduled with timers, I would use Vitest fake timers and await the timer advance operation. I would not use a fixed sleep. The test should check the visible progress value and the live status message.

For cancellation, I would make uploadFile observe the AbortSignal. When the user clicks the cancel button, the component should call AbortController.abort. The fake transport then rejects with an AbortError. I would assert that the captured signal is aborted, later scheduled progress is ignored, and the user receives an accessible cancellation message.

For validation, an invalid type or a file over 5 MB should show an announced validation message and should not call uploadFile. For a transport failure, the fake uploadFile can reject with an ordinary error. I would assert that the server or network error message becomes visible and is announced through the accessibility semantics used by the component.

Accessibility checks should use accessible labels and role based queries. I would confirm that the file input has a useful accessible name, buttons have clear names and states, the drop area supports the expected keyboard interaction, and progress, validation, cancellation, and server messages are exposed through a live region. Automated axe checks can catch common rule violations, but they do not replace manual assistive technology testing.

The simulated DOM gives fast and stable component coverage, but it cannot prove real browser file selection, rendering, object URL behavior, or complete browser upload behavior. I would therefore keep one Playwright path. It would use setInputFiles with a real PNG or JPEG fixture, confirm the upload, send it to a controlled test endpoint or a Playwright controlled route, and verify the real preview and visible status in a browser. This gives browser confidence without sending production data.

In CI, I would run the component tests frequently because they are fast and isolated. I would run the real browser path with the browser test suite. Each test should restore fake timers, global browser API replacements, mocks, and rendered components so no test depends on another one.

Technical Approach
  1. Define the visible behavior. A valid PNG or JPEG up to 5 MB can be selected or dropped, previewed, confirmed, uploaded with progress, cancelled, and reported through accessible messages.
  1. Choose the main test level. Render the real component in a component integration test and replace only the uploadFile transport boundary.
  1. Arrange fixtures. Create valid PNG and JPEG files, a file over 5 MB, an invalid GIF, and invalid image data. Keep each fixture independent.
  1. Replace browser APIs only where the simulated environment cannot provide the required behavior. Control URL.createObjectURL and URL.revokeObjectURL. Provide DataTransfer when needed.
  1. Test file input and drag and drop. Use user.upload for the file input. Use DataTransfer plus a drop event for the drop area.
  1. Assert preview and validation behavior. Valid files show a preview. Invalid type or size shows an accessible message and does not start an upload.
  1. Confirm the upload. Assert that uploadFile receives the selected file plus onProgress and signal.
  1. Drive progress deterministically. Call onProgress with controlled values. If timers schedule those calls, use fake timers and await the timer advance API.
  1. Test cancellation. Click the cancel button, assert that the captured AbortSignal is aborted, prevent later progress, reject with AbortError, and assert the cancellation announcement.
  1. Test transport failure. Reject uploadFile with an error and assert the visible announced error message.
  1. Test cleanup. Assert that object URLs are revoked when previews are replaced, removed, or when the component unmounts. Restore timers and global replacements.
  1. Add one Playwright path with a real file and a controlled test destination so real browser behavior is covered without using production systems.
Practical Insights

Algorithmic complexity is not important for this question. The practical cost is test runtime, setup, isolation, and maintenance. Component integration tests are relatively fast because the upload transport is controlled and no production service is required. File fixtures should stay small except for the deliberate file over 5 MB. Controlled progress and fake timers make asynchronous tests predictable and quick. A real browser test costs more because a browser process must start and more parts are involved, so I would keep only the small number needed for browser confidence. Maintenance cost stays lower when tests assert visible behavior instead of private component details.

Code
import '@testing-library/jest-dom/vitest';
import { cleanup, render, screen } from '@testing-library/react';
import userEvent from '@testing-library/user-event';
import { afterEach, expect, it, vi } from 'vitest';
import { FileUpload } from './FileUpload';

// Restore DOM state, fake timers, mocks, and replaced globals after every test.
afterEach(() => {
  cleanup();
  vi.useRealTimers();
  vi.restoreAllMocks();
  vi.unstubAllGlobals();
});

it('uploads with progress and can be cancelled', async () => {
  // Fake timers make scheduled progress deterministic and avoid real waiting.
  vi.useFakeTimers();

  // Create one valid JPEG fixture that matches the component rules.
  const file = new File(['abc'], 'mountain.jpg', { type: 'image/jpeg' });

  // JSDOM does not provide the object URL behavior needed by this component.
  const createObjectURL = vi.fn(() => 'blob:preview');
  const revokeObjectURL = vi.fn();
  const NativeURL = URL;

  // Keep URL usable as a constructor while adding controlled object URL methods.
  class TestURL extends NativeURL {}
  Object.assign(TestURL, { createObjectURL, revokeObjectURL });
  vi.stubGlobal('URL', TestURL);

  // The upload boundary emits controlled progress and rejects after cancellation.
  const uploadFile = vi.fn((selectedFile, { onProgress, signal }) => {
    expect(selectedFile).toBe(file);

    [10, 40, 70, 100].forEach((value, index) => {
      setTimeout(() => {
        // Ignore scheduled progress after the request has been aborted.
        if (!signal.aborted) {
          onProgress(value);
        }
      }, index * 10);
    });

    return new Promise((resolve, reject) => {
      // Model the transport boundary reacting to AbortController.abort().
      signal.addEventListener(
        'abort',
        () => {
          reject(new DOMException('Aborted', 'AbortError'));
        },
        { once: true }
      );
    });
  });

  // Render the real component while replacing only the upload transport.
  render(<FileUpload uploadFile={uploadFile} />);
  const user = userEvent.setup({ advanceTimers: vi.advanceTimersByTime });

  // Choose the file through the same accessible control used by a person.
  await user.upload(screen.getByLabelText(/upload an image/i), file);
  expect(screen.getByRole('img', { name: /preview/i })).toBeInTheDocument();
  expect(createObjectURL).toHaveBeenCalledWith(file);

  // Confirm the upload through the visible button.
  await user.click(screen.getByRole('button', { name: /^upload$/i }));
  expect(uploadFile).toHaveBeenCalledTimes(1);

  // Advance controlled progress to 40 percent without a fixed sleep.
  await vi.advanceTimersByTimeAsync(10);
  expect(screen.getByText(/40 percent/i)).toBeInTheDocument();

  // Cancel through the visible control and inspect the exact AbortSignal boundary.
  await user.click(screen.getByRole('button', { name: /cancel upload/i }));
  const [, { signal }] = uploadFile.mock.calls[0];
  expect(signal.aborted).toBe(true);

  // Switch back to real timers before waiting for the rendered cancellation result.
  vi.useRealTimers();
  expect(await screen.findByText(/cancelled/i)).toBeInTheDocument();
});
Why Interviewers Ask This

Interviewers ask this question to see whether I can test browser behavior through things the user can observe while keeping external work controlled. They want to see whether I choose the right component boundary, build useful file fixtures, control asynchronous progress and cancellation, check accessible labels and announcements, clean up browser resources, and understand the limits of a simulated DOM. They also want to see whether I know when a real browser test adds confidence that component tests cannot provide.

Common interview mistakes

A common mistake is testing private component state instead of what the user sees. Another is replacing the whole component, which removes the behavior that needs testing. It is also wrong to claim that Mock Service Worker creates real browser upload progress when the component transport already exposes an onProgress callback. Using user.upload on a drop area is another mistake because drag and drop should use a DataTransfer payload and a drop event. Fixed sleeps make progress tests flaky. Tests can also leak state when fake timers, object URL replacements, or rendered DOM are not restored. Another mistake is revoking a preview URL immediately after upload even when the preview is still visible. Finally, a simulated DOM test should not be described as proof that real browser file behavior works.

Interview tip

Explain the answer from the boundary outward. Start with the real component and the controlled uploadFile transport. Then walk through fixtures, file input and drag and drop, preview creation, controlled progress, cancellation, accessibility, and object URL cleanup. Finish with the limitation: the simulated DOM gives fast component confidence, while one Playwright path gives real browser confidence.

Interviewer may ask next
How would you test that cancelling an upload cannot produce a late progress update or success message?

I would keep the same uploadFile boundary and make its progress completely controllable. The fake transport would schedule progress callbacks and receive the component AbortSignal. I would advance progress to a known value, click the visible cancel button, and assert that the signal is aborted. Then I would advance the controlled timers again and assert that no later progress value or success message appears. This boundary matters because it lets the test control timing without a fixed sleep. The tradeoff is that it proves the component handles cancellation correctly, but it does not prove that a real browser or remote server stops sending bytes.

Why keep a Playwright upload test if the component integration tests already cover selection, preview, progress, and cancellation?

I would keep one Playwright path because the test boundary changes from a simulated DOM to a real browser. The component tests are faster and better for most states, but they replace browser APIs and the upload transport, so they cannot prove real file selection and real browser behavior. The Playwright test uses a real fixture and a controlled test destination or browser route to verify the complete user path. The tradeoff is higher runtime and maintenance cost, so I would keep broad coverage in component tests and only a small browser path for confidence that requires an actual browser.

83. How would you test an optimistic UI update and rollback?TestingMedium

Question Details

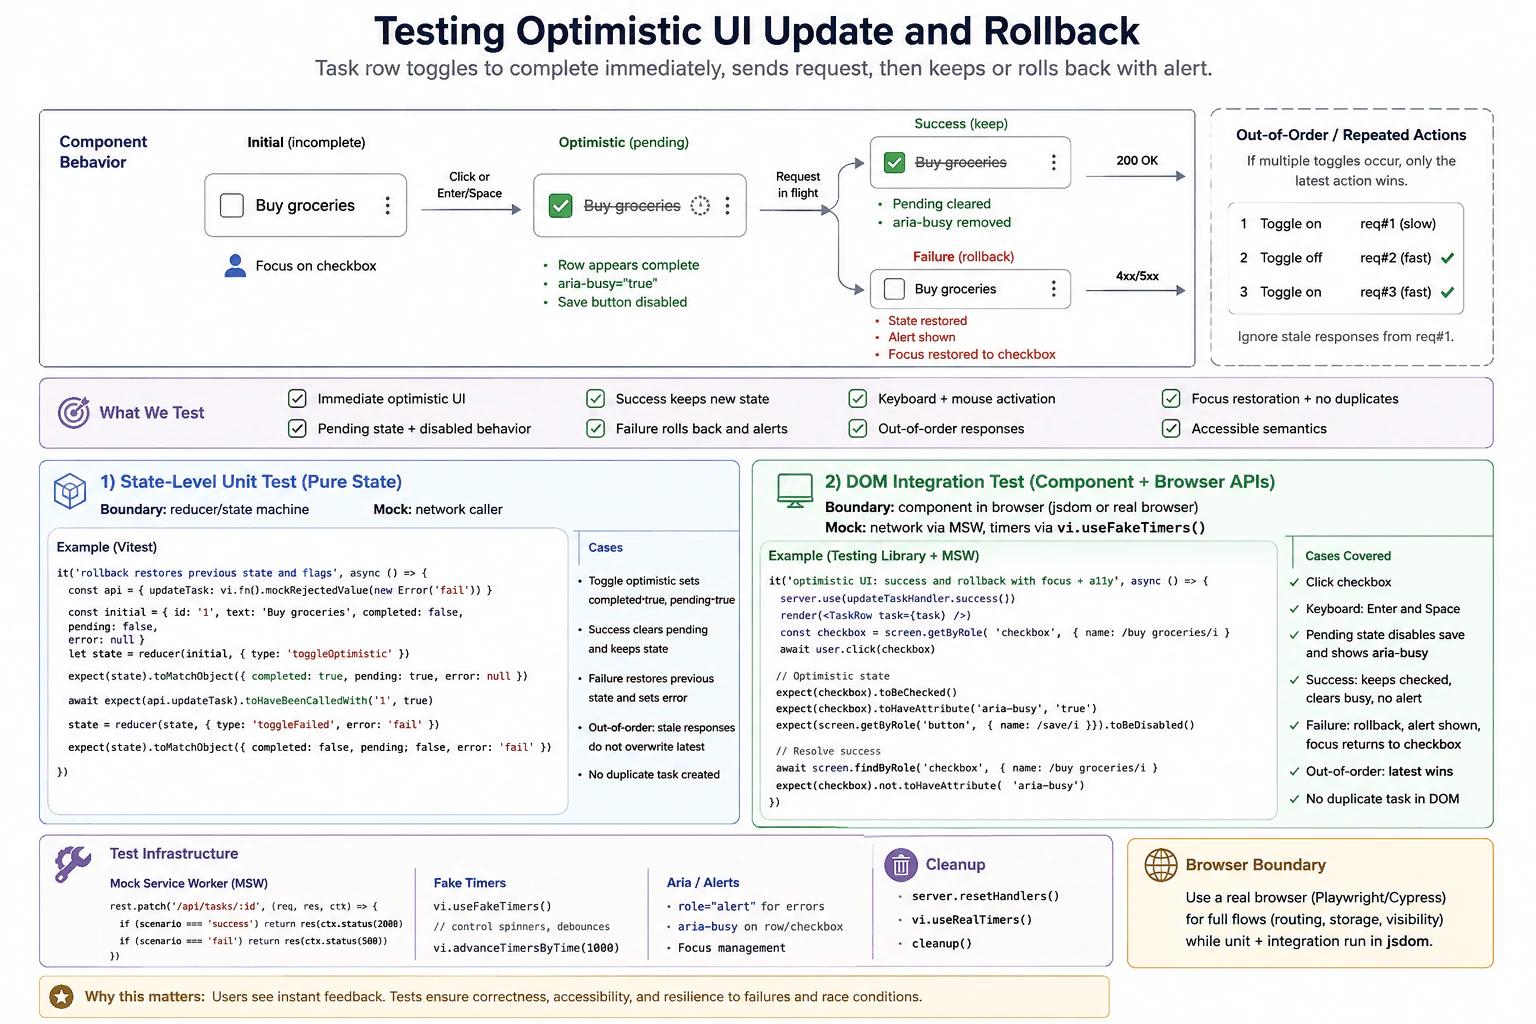
A task row toggles from incomplete to complete immediately, sends a request, and either keeps the new state or restores the old state with an alert. Define a state-level unit test and a DOM integration test for click and keyboard activation, pending disabled behavior, success and rejection fixtures, exact visible and accessible transitions, out-of-order repeated actions, browser boundary, mocked network, and cleanup. Include a test that rollback restores focus and does not duplicate the task.

Short Interview Answer (30-60 seconds)

I would use two test boundaries. First, a state level unit test proves the optimistic transition, success, rollback, and stale result protection. Second, a DOM integration test renders the real task row, uses Testing Library for click and keyboard activation, and uses Mock Service Worker for controlled success and rejection responses. While the request is pending, I would assert the immediate checked state, busy state, and disabled control. On success the new state stays. On rejection the old state returns, an alert appears, focus returns to the checkbox, and only one task remains. I would use a real browser only for behavior that the simulated DOM cannot prove.

Detailed Explanation

See the Code while reading this explanation.

The user marks a task complete and should see that change right away. The page then tries to save it. If saving works, the task stays complete. If saving fails, the task returns to incomplete and an error appears. The tests also need to check mouse and keyboard use, the disabled state while saving, old responses that finish late, focus after a rollback, and whether the same task appears only once. The goal is to prove both the fast feedback and the safe recovery.

Useful Questions to Ask the Interviewer
  1. Should the control remain disabled until the current request finishes?
  2. Does the current implementation already attach a request identifier to each optimistic action?
  3. Is the error exposed with alert semantics in the DOM?
  4. Which Vitest, Testing Library, and Mock Service Worker versions are pinned by the project?
How would you test an optimistic UI update and rollback? diagram
How to Explain It in an Interview

I would split the testing into a state level unit test and a DOM integration test because they give different confidence.

The state test checks the task transition rules without rendering the DOM. I start with one incomplete task. I dispatch an optimistic toggle and assert that the task becomes complete immediately, pending becomes true, and the previous value is retained for rollback. Then I test a matching success and confirm that complete stays true while pending becomes false. In a separate failure test, I confirm that the previous incomplete value is restored, pending becomes false, and an error value is recorded.

I would also test out of order results at the state boundary. I simulate request 1 and then request 2. Request 2 is the latest action. If request 1 finishes after request 2, the reducer must ignore request 1 because its identifier is stale. This is the right place to test overlapping requests even though the normal DOM path disables the control while one save is pending. The state test protects the data rule, while the DOM test proves the user cannot normally trigger another activation during that pending period.

For the DOM integration test, I render the real TaskRow. I keep the DOM, accessible roles, keyboard behavior, focus, and component state real. I replace only the network boundary with Mock Service Worker. One handler gives a successful response and another gives a rejection response. I use accessible queries such as getByRole and findByRole.

For the pending state, I hold the controlled request open. I click the checkbox and assert that it is checked immediately, has aria busy set to true, and is disabled before the response finishes. I run the same activation path with Space from keyboard focus so mouse and keyboard behavior are both covered.

For success, I release the success response and wait for observable UI changes. The checkbox stays checked, the control becomes enabled, aria busy becomes false, and no alert appears.

For rejection, I release the failure response and wait for rollback. The checkbox becomes unchecked, the control becomes enabled, aria busy becomes false, and a visible alert appears. I also assert that focus returns to the checkbox and that the text Buy groceries appears only once. That catches a bad rollback implementation that appends a second task instead of restoring the original row.

For cleanup, I reset Mock Service Worker handlers after each test, restore mocks and any global overrides, restore real timers if the production path required fake timers, and remove the rendered DOM. The tests must not depend on execution order or shared mutable state.

These tests do not prove the real remote service or every real browser behavior. If routing, storage, layout, visibility, browser compatibility, or a complete user journey matters, I would add a small Playwright or Cypress test in a real browser. I would still keep the unit and DOM tests because they are faster and give more focused failures.

Key Insight / Why This Solution Works
  1. Define the visible contract. The task changes immediately, shows a pending disabled state, then either keeps the new value or rolls back with an alert.
  1. Test the state boundary. Verify the optimistic transition, success, failure rollback, and stale request protection with explicit request identifiers.
  1. Render the real task row for the DOM test. Keep user events, DOM state, accessibility state, and focus real.
  1. Replace only the network with Mock Service Worker. Provide one controlled success fixture and one controlled rejection fixture.
  1. Hold the request open, activate the checkbox, and assert the immediate checked state, aria busy state, and disabled behavior.
  1. Resolve success and wait for the pending state to clear while the task remains complete and no alert appears.
  1. Resolve rejection and wait for rollback, the alert, restored focus, and exactly one task row.
  1. Repeat activation with keyboard input using Space and verify the same visible behavior.
  1. Reset handlers, mocks, timers if used, global overrides, and rendered DOM after each test.
  1. Add a real browser test only when the behavior depends on a browser feature that the simulated DOM cannot prove.
Code
import '@testing-library/jest-dom/vitest';
import { afterAll, afterEach, beforeAll, describe, expect, it, vi } from 'vitest';
import { cleanup, render, screen, waitFor } from '@testing-library/react';
import userEvent from '@testing-library/user-event';
import { rest } from 'msw';
import { setupServer } from 'msw/node';
import { TaskRow } from './TaskRow';
import { taskReducer } from './taskState';

// Use one explicit fixture so every test starts from the same task.
const task = {
  id: '1',
  text: 'Buy groceries',
  completed: false,
};

// Replace only the network boundary. The component and DOM remain real.
const server = setupServer();

// Build a controllable Promise so the test can inspect the pending UI.
function deferred() {
  let resolve;
  const promise = new Promise((done) => {
    resolve = done;
  });
  return { promise, resolve };
}

beforeAll(() => {
  // Fail fast if the component makes an unexpected request.
  server.listen({ onUnhandledRequest: 'error' });
});

afterEach(() => {
  // Remove test specific network behavior and global test state.
  server.resetHandlers();
  vi.restoreAllMocks();
  vi.useRealTimers();
  cleanup();
});

afterAll(() => {
  server.close();
});

describe('optimistic task state', () => {
  it('keeps the optimistic value after success', () => {
    // Arrange one incomplete task with no request in flight.
    const initialState = {
      task,
      pending: false,
      error: null,
      latestRequestId: null,
      previousCompleted: task.completed,
    };

    // Act with an optimistic toggle before the request finishes.
    const optimistic = taskReducer(initialState, {
      type: 'toggleOptimistic',
      requestId: 1,
    });

    // Assert the immediate optimistic state.
    expect(optimistic.task.completed).toBe(true);
    expect(optimistic.pending).toBe(true);
    expect(optimistic.error).toBe(null);

    // Apply the matching success result.
    const succeeded = taskReducer(optimistic, {
      type: 'toggleSucceeded',
      requestId: 1,
    });

    // Success keeps the new value and clears pending state.
    expect(succeeded.task.completed).toBe(true);
    expect(succeeded.pending).toBe(false);
    expect(succeeded.error).toBe(null);
  });

  it('restores the previous value after failure', () => {
    const initialState = {
      task,
      pending: false,
      error: null,
      latestRequestId: null,
      previousCompleted: task.completed,
    };

    // Start the optimistic transition.
    const optimistic = taskReducer(initialState, {
      type: 'toggleOptimistic',
      requestId: 1,
    });

    // Apply the matching failure result.
    const failed = taskReducer(optimistic, {
      type: 'toggleFailed',
      requestId: 1,
      error: 'Failed to update task',
    });

    // Rollback restores the old value and records the failure.
    expect(failed.task.completed).toBe(false);
    expect(failed.pending).toBe(false);
    expect(failed.error).toBe('Failed to update task');
  });

  it('ignores a stale result from an older request', () => {
    const initialState = {
      task,
      pending: false,
      error: null,
      latestRequestId: null,
      previousCompleted: task.completed,
    };

    // Model two overlapping optimistic actions directly at the state boundary.
    const requestOne = taskReducer(initialState, {
      type: 'toggleOptimistic',
      requestId: 1,
    });
    const requestTwo = taskReducer(requestOne, {
      type: 'toggleOptimistic',
      requestId: 2,
    });

    // Let the latest request finish first.
    const latestSuccess = taskReducer(requestTwo, {
      type: 'toggleSucceeded',
      requestId: 2,
    });

    // A late result for request 1 must not replace the latest state.
    const staleSuccess = taskReducer(latestSuccess, {
      type: 'toggleSucceeded',
      requestId: 1,
    });

    expect(staleSuccess).toEqual(latestSuccess);
    expect(staleSuccess.task.text).toBe('Buy groceries');
  });
});

describe('TaskRow optimistic DOM behavior', () => {
  it('shows pending state immediately and keeps the value after success', async () => {
    const user = userEvent.setup();
    const gate = deferred();

    // Hold the request open so pending behavior can be asserted.
    server.use(
      rest.patch('/api/tasks/:id', async (req, res, ctx) => {
        await gate.promise;
        return res(ctx.status(200), ctx.json({ ...task, completed: true }));
      })
    );

    render(<TaskRow task={task} />);

    const checkbox = screen.getByRole('checkbox', {
      name: /buy groceries/i,
    });

    // Activate the real control through a user click.
    await user.click(checkbox);

    // The optimistic UI is visible before the network result arrives.
    expect(checkbox).toBeChecked();
    expect(checkbox).toBeDisabled();
    expect(checkbox).toHaveAttribute('aria-busy', 'true');

    // Release the successful network fixture.
    gate.resolve();

    // Wait for observable final state instead of sleeping.
    await waitFor(() => {
      expect(checkbox).toBeEnabled();
      expect(checkbox).toHaveAttribute('aria-busy', 'false');
    });

    expect(checkbox).toBeChecked();
    expect(screen.queryByRole('alert')).not.toBeInTheDocument();
  });

  it('supports keyboard activation with Space', async () => {
    const user = userEvent.setup();

    // Return a successful response for the keyboard path.
    server.use(
      rest.patch('/api/tasks/:id', (req, res, ctx) =>
        res(ctx.status(200), ctx.json({ ...task, completed: true }))
      )
    );

    render(<TaskRow task={task} />);

    const checkbox = screen.getByRole('checkbox', {
      name: /buy groceries/i,
    });

    // Put focus on the control and activate it through the keyboard.
    checkbox.focus();
    await user.keyboard('[Space]');

    // The same user visible result should be reached.
    await waitFor(() => {
      expect(checkbox).toBeChecked();
      expect(checkbox).toBeEnabled();
    });
  });

  it('blocks a second activation while the first save is pending', async () => {
    const user = userEvent.setup();
    const gate = deferred();
    let requestCount = 0;

    // Count network calls so disabled behavior is observable.
    server.use(
      rest.patch('/api/tasks/:id', async (req, res, ctx) => {
        requestCount += 1;
        await gate.promise;
        return res(ctx.status(200), ctx.json({ ...task, completed: true }));
      })
    );

    render(<TaskRow task={task} />);

    const checkbox = screen.getByRole('checkbox', {
      name: /buy groceries/i,
    });

    await user.click(checkbox);

    // The disabled control prevents another normal user activation.
    expect(checkbox).toBeDisabled();
    await user.click(checkbox);
    expect(requestCount).toBe(1);

    gate.resolve();

    await waitFor(() => {
      expect(checkbox).toBeEnabled();
    });
  });

  it('rolls back, alerts, restores focus, and keeps one task after rejection', async () => {
    const user = userEvent.setup();
    const gate = deferred();

    // Hold the error response so the pending state is deterministic.
    server.use(
      rest.patch('/api/tasks/:id', async (req, res, ctx) => {
        await gate.promise;
        return res(ctx.status(500), ctx.json({ message: 'Failed to update task' }));
      })
    );

    render(<TaskRow task={task} />);

    const checkbox = screen.getByRole('checkbox', {
      name: /buy groceries/i,
    });

    // Start the optimistic action.
    await user.click(checkbox);

    expect(checkbox).toBeChecked();
    expect(checkbox).toBeDisabled();
    expect(checkbox).toHaveAttribute('aria-busy', 'true');

    // Release the rejection fixture and wait for rollback.
    gate.resolve();

    const alert = await screen.findByRole('alert');
    expect(alert).toHaveTextContent(/failed to update task/i);

    await waitFor(() => {
      expect(checkbox).not.toBeChecked();
      expect(checkbox).toBeEnabled();
      expect(checkbox).toHaveAttribute('aria-busy', 'false');
      expect(checkbox).toHaveFocus();
    });

    // Rollback must restore the same row instead of duplicating it.
    expect(screen.getAllByText('Buy groceries')).toHaveLength(1);
  });
});
Why Interviewers Ask This

Interviewers ask this to see whether I can choose the right test boundaries for optimistic behavior. They want evidence that I can separate pure state rules from real DOM behavior, control the network safely, test success and rollback, handle out of order results, verify accessibility and focus, and keep tests isolated and reliable.

Common interview mistakes

Common mistakes are checking private state instead of visible behavior, mocking the component instead of the network boundary, forgetting the rejection path, using fixed sleep calls, not awaiting user actions, leaving request handlers or timers active after a test, sharing mutable fixtures, and assuming a mocked DOM test proves the real server or browser works. Another mistake is ignoring stale request results. It is also easy to test only mouse clicks and miss keyboard activation, focus restoration, disabled pending behavior, or alert semantics.

Interview tip

Explain the two boundaries first. Say that the state test proves transition rules and stale result protection, while the DOM integration test proves what the user can see and do. Then walk through pending, success, rollback, focus, and cleanup in that order. Finish by stating that Mock Service Worker controls the frontend network boundary but does not prove the real remote service.

Interviewer may ask next
How would you test a stale response that arrives after a newer optimistic action?

I would test that at the state boundary with explicit request identifiers and controlled completion order. I would start request 1, then request 2, complete request 2 first, and finally deliver the result for request 1. The reducer should compare each result with the latest request identifier and ignore request 1. This matters because response order can differ from request order. The tradeoff is slightly more state logic, but it prevents an old result from replacing the latest user intent.

When would you add a real browser test instead of relying only on the DOM integration test?

I would add a real browser boundary when the risk depends on actual browser behavior such as layout, visibility, routing, storage, service workers, or browser compatibility. I would keep the state and DOM tests because they are faster and easier to debug, then add a small Playwright or Cypress test for the critical browser flow. The tradeoff is slower CI and more environment setup in exchange for confidence in behavior that a simulated DOM cannot prove.

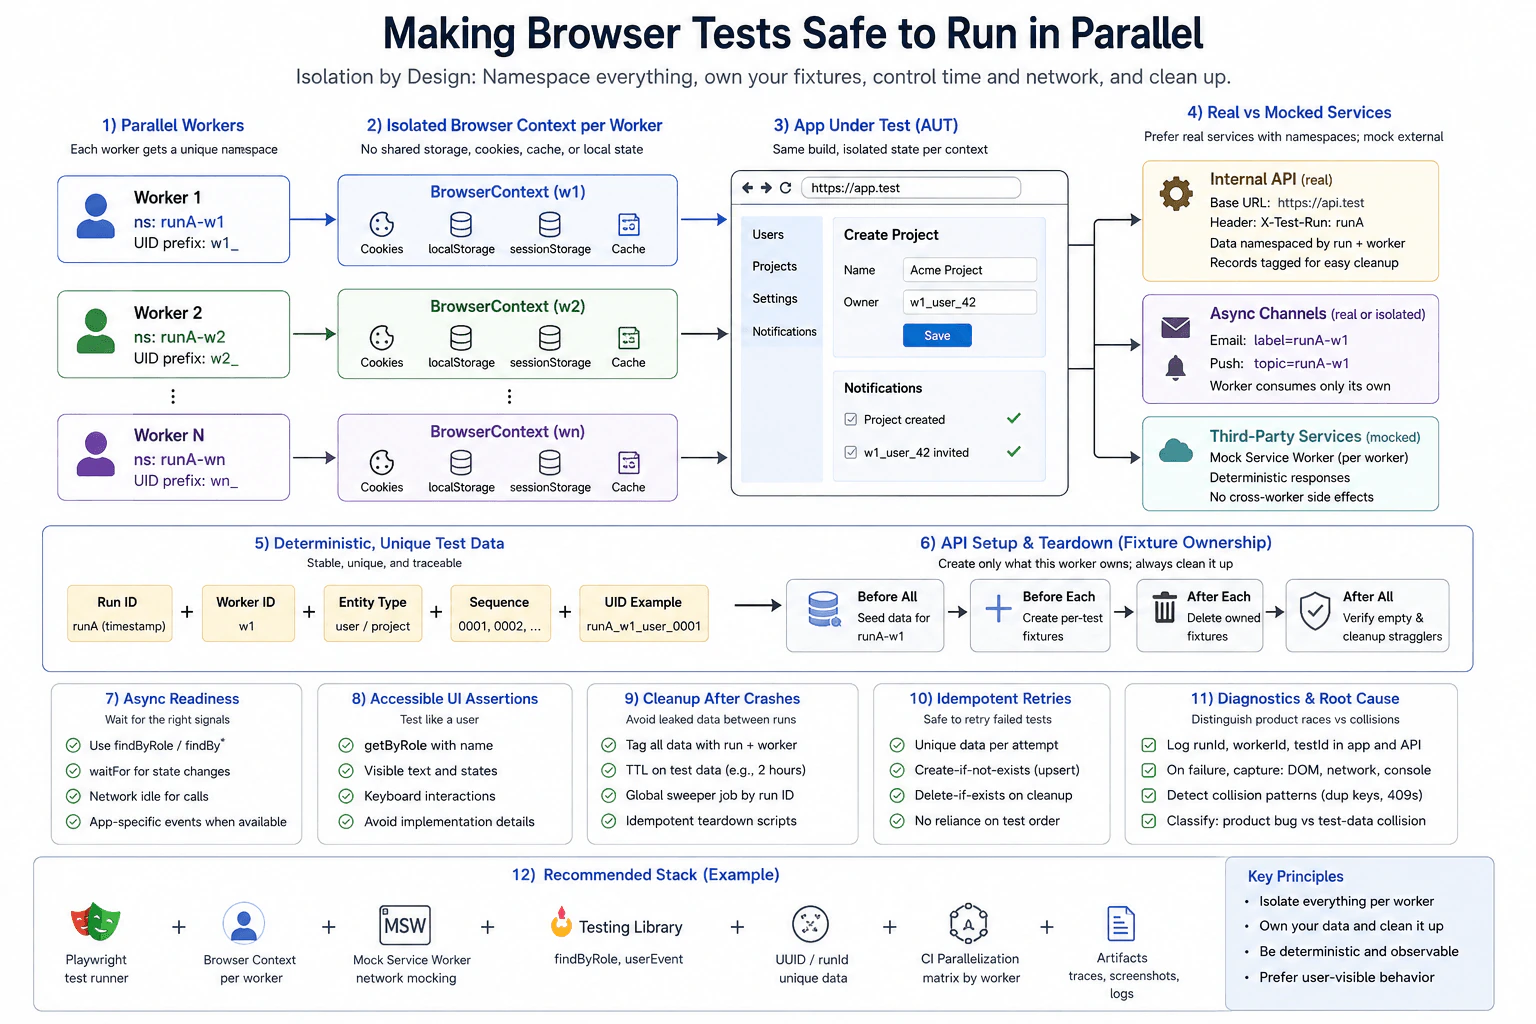
84. How would you make browser tests safe to run in parallel?TestingHard

Question Details

A test suite creates users and projects, changes account settings, and verifies notifications. Parallel workers currently collide on shared records and occasionally consume one another's messages. Design namespace and fixture ownership, deterministic unique data, isolated browser storage, API setup and teardown, asynchronous readiness checks, accessible UI assertions, browser contexts, and real versus mocked services. Define cleanup after crashes, idempotent retries, and diagnostics that distinguish product races from test-data collisions.

Short Interview Answer (30-60 seconds)

I would isolate everything by worker. Each worker gets its own namespace, browser context, deterministic fixture data, and notification channel. I would create fixtures through an API, tag every record with the run identity and worker identity, and let each worker delete only the data it owns. I would wait for observable readiness instead of sleeping and assert the UI through accessible roles, names, text, and states. I would keep the application and internal API real when they are part of the required confidence, control selected third party services with Mock Service Worker, and add crash cleanup, idempotent retries, and diagnostics that separate product races from test data collisions.

Detailed Explanation

The problem is that several tests run at the same time but touch the same things. One test may change a user that another test needs. Another test may read a notification meant for a different test. I would give every worker its own clearly named users, projects, settings, browser data, and message channel. Each worker creates only what it owns and removes that data afterward. I would also record the run, worker, test, and fixture identities so a failure can be traced back to either the application or two tests touching the same data.

Useful Questions to Ask the Interviewer
  1. Can every worker create test data through a safe setup API?
  2. Can users, projects, and notifications be tagged with a run identity and worker identity?
  3. Which services must stay real, and which external services can be controlled in the test environment?
  4. Does the browser test framework support a separate browser context for every worker?
  5. Is there already an expiry rule or cleanup job for data left behind after a crashed run?
How would you make browser tests safe to run in parallel? diagram
How to Explain It in an Interview

I would treat this as a browser level integration and end to end reliability problem. The browser journey should run in a real browser. The confidence boundary includes the browser context, the application, browser storage, routing, the internal API, and the notification flow when those parts are required by the journey. Selected external services can be controlled at the network boundary when using the real service would make the suite slow, costly, or difficult to isolate.

First, I would create one run identity for the whole execution and one worker identity for each parallel worker. I would combine those values into a namespace such as runA_w1. Every user, project, and other fixture created by that worker carries the same ownership information. A fixture identifier can use the run identity, worker identity, entity type, and a sequence such as runA_w1_user_0001. The sequence is predictable within the run, while the run identity prevents a new execution from colliding with an older execution.

Each worker also gets its own browser context. That separates cookies, localStorage, sessionStorage, cache, and other context scoped browser state. Workers must not reuse the same context because shared authentication or settings can allow one test to affect another test.

Fixture ownership follows the same namespace. A worker creates only the users, projects, settings, and other records it needs. Setup should normally happen through a test API because that is faster and more direct than creating all fixture state through the UI. Every created record is tagged with the owning run and worker. Teardown deletes only records carrying that ownership information.

The test still uses the real browser for the behavior that matters. For example, it can create a project through the visible UI, change account settings, and verify a notification. The browser action should behave like a user action rather than calling private component methods.

Notification channels need the same isolation. Email, push, WebSocket, or another asynchronous channel should use a worker specific label, topic, inbox, or equivalent routing value. A worker consumes only messages that belong to its own namespace. This prevents one worker from consuming another worker's notification.

For service boundaries, I would keep the internal application API real when that integration is part of the confidence required by the browser test. The shared test environment can remain safe because records are namespaced by run and worker. For third party services that are expensive, unreliable, slow, or difficult to isolate, I would control the network boundary with Mock Service Worker when the project supports it. The handler returns deterministic responses and can record requests. This proves how the frontend behaves against the controlled boundary, but it does not prove that the real third party service works.

Asynchronous checks should wait for observable conditions. In Testing Library tests I would use queries such as findByRole or findByText and use waitFor only around a condition that must eventually become true. In Playwright browser tests I would use locator assertions such as expect on page.getByRole. I would also wait for an application specific readiness signal when one exists. I would not use a fixed sleep because the correct delay changes with machine speed and network load.

UI assertions should describe what the user can observe. I would prefer roles with accessible names, visible text, visible state, keyboard behavior, and other public behavior. For example, after creating a project, the browser can assert that the expected project and notification are visible. That is more stable than checking private component state or incidental DOM structure.

Cleanup is based on ownership. Normal teardown deletes only fixtures tagged with the current run and worker. The browser context is closed, so its isolated storage disappears with the context. Controlled network handlers and any other global replacements are reset according to their lifetime. Cleanup operations should be idempotent. Running cleanup twice should leave the environment in the same clean state rather than causing a second failure.

Crashes need a second cleanup path because normal teardown may never execute. I would give test data an expiry time and run a global sweeper that removes stale records by run identity. The sweeper can safely find abandoned records because every test fixture carries explicit ownership information.

Retries must not depend on state from the previous attempt. A retry can create unique data for the new attempt or recreate the required state through idempotent setup operations. Setup can use create if missing or an equivalent safe operation when the test API supports it. Teardown can delete only if the owned record exists. The retry must never attach itself to an old project or consume an old notification simply because an earlier attempt stopped halfway through.

Diagnostics should make collisions visible. I would log the run identity, worker identity, test identity, generated fixture keys, and relevant request information. On failure I would capture the page state, browser trace, network activity, console output, and screenshots. Duplicate key errors, conflict responses, or one fixture identity appearing under two workers suggest a test data collision. If the data and message channels are correctly isolated but the product still behaves inconsistently, the evidence points more strongly toward a real product race.

The main tradeoff is realism versus control. Real services provide more integration confidence but can increase runtime, cost, and variability. Controlled services are faster and deterministic but cannot prove that the real remote service works. I would therefore keep the parts required for the browser journey real, isolate them with namespaces and browser contexts, and control only the external boundaries whose real behavior is not the purpose of the test.

Technical Approach
  1. Create one run identity for the complete test execution and one worker identity for each parallel worker.
  2. Build each fixture identifier from the run identity, worker identity, entity type, and deterministic sequence.
  3. Give every worker its own browser context so cookies, localStorage, sessionStorage, cache, and other context state are not shared.
  4. Create required users, projects, and settings through the setup API and tag every record with the owning run and worker.
  5. Route notifications through a worker specific inbox, label, topic, or equivalent channel so each worker can consume only its own messages.
  6. Keep the application and internal API real when they are part of the required confidence. Control selected third party network boundaries with deterministic Mock Service Worker handlers when appropriate.
  7. Drive the browser through realistic user actions.
  8. Wait for observable readiness with Testing Library asynchronous queries, waitFor, Playwright locator assertions, network readiness, or application specific signals as appropriate. Do not use fixed sleeps.
  9. Assert visible behavior with accessible roles, names, text, and states rather than private implementation details.
  10. Delete only fixtures owned by the current worker, reset controlled handlers, and close the worker browser context.
  11. Make setup and teardown idempotent so a retry remains safe after a partial earlier attempt.
  12. Use expiry rules and a global sweeper to remove data left behind when a worker or CI job crashes.
  13. Record run identity, worker identity, test identity, fixture keys, network information, console output, traces, screenshots, and page state so data collisions can be separated from real product races.
Practical Insights

Algorithmic complexity is not the useful measure for this design. The practical cost comes from browser contexts, fixture creation, network calls, service setup, and the number of workers. Adding workers can reduce total CI time until the browser host, application, database, or shared test environment becomes the bottleneck. Each browser context also uses memory. API fixture creation is usually much faster than creating all setup state through the UI. Real services add more runtime and variability, while controlled services add maintenance work. Namespaces, cleanup jobs, deterministic builders, and traces require extra engineering effort, but they usually save time by reducing flaky failures and making failures easier to diagnose.

Why Interviewers Ask This

Interviewers ask this to see whether I understand that parallel browser tests are a shared state problem, not only a speed problem. They want to know whether I can separate fixture ownership, browser state, network behavior, and asynchronous messages for every worker. They also want to see whether I can design reliable cleanup, safe retries, and useful diagnostics. A strong answer shows that I can increase test speed without hiding real product races or creating flaky failures from test data collisions.

Common interview mistakes

Common mistakes include giving every worker the same user or project names, reusing one browser context, sharing cookies or storage, and letting workers read from the same notification channel. Another mistake is generating unique data without recording the run and worker ownership, which makes failures harder to reproduce and cleanup harder to target. Fixed sleep calls create flaky timing and should be replaced with observable readiness checks. Tests also become unreliable when teardown deletes records owned by another worker or when cleanup is not idempotent. Over mocking is another problem because a heavily controlled browser test gives less confidence in the real application integration. The opposite mistake is using every real external service even when it cannot be isolated reliably. Weak assertions that inspect private implementation details also make tests fragile. Finally, teams often forget crash cleanup and diagnostics, so stale data remains and later failures are incorrectly blamed on the product.

Interview tip

Explain the design around ownership. Start with one namespace and one browser context for every worker. Then show how that same identity flows through fixture names, API records, notification channels, cleanup, retries, and diagnostics. Finish by explaining which services remain real, which network boundaries are controlled, and how the captured evidence separates a product race from a test data collision.

Interviewer may ask next
What would you do if two workers still occasionally consume the same notification after you added unique test data?

I would treat the notification channel as the failing isolation boundary. Unique users and projects are not enough if every worker still reads from one shared inbox, topic, or subscription. I would route each worker to a channel that includes its run identity and worker identity, then accept only messages carrying that ownership value. I would also log the message identity, run identity, worker identity, and test identity. If the same message reaches two correctly isolated channels, that evidence points toward a product or messaging race. If both workers were subscribed to the same channel, it is a test configuration collision.

How would you decide whether to keep a service real or replace it when the parallel suite becomes slow in CI?

I would keep a service real when that integration is part of the confidence the browser test is meant to provide and when the service can be safely namespaced. The internal application API is a good example because the browser journey depends on it. I would consider controlling a third party network boundary when the remote service is slow, costly, rate limited, unreliable, or cannot provide worker isolation. Mock Service Worker can provide deterministic responses at that boundary when the project supports it. The tradeoff is that the controlled test becomes faster and more stable, but it no longer proves that the real remote integration works, so that confidence should come from a separate contract or integration check.

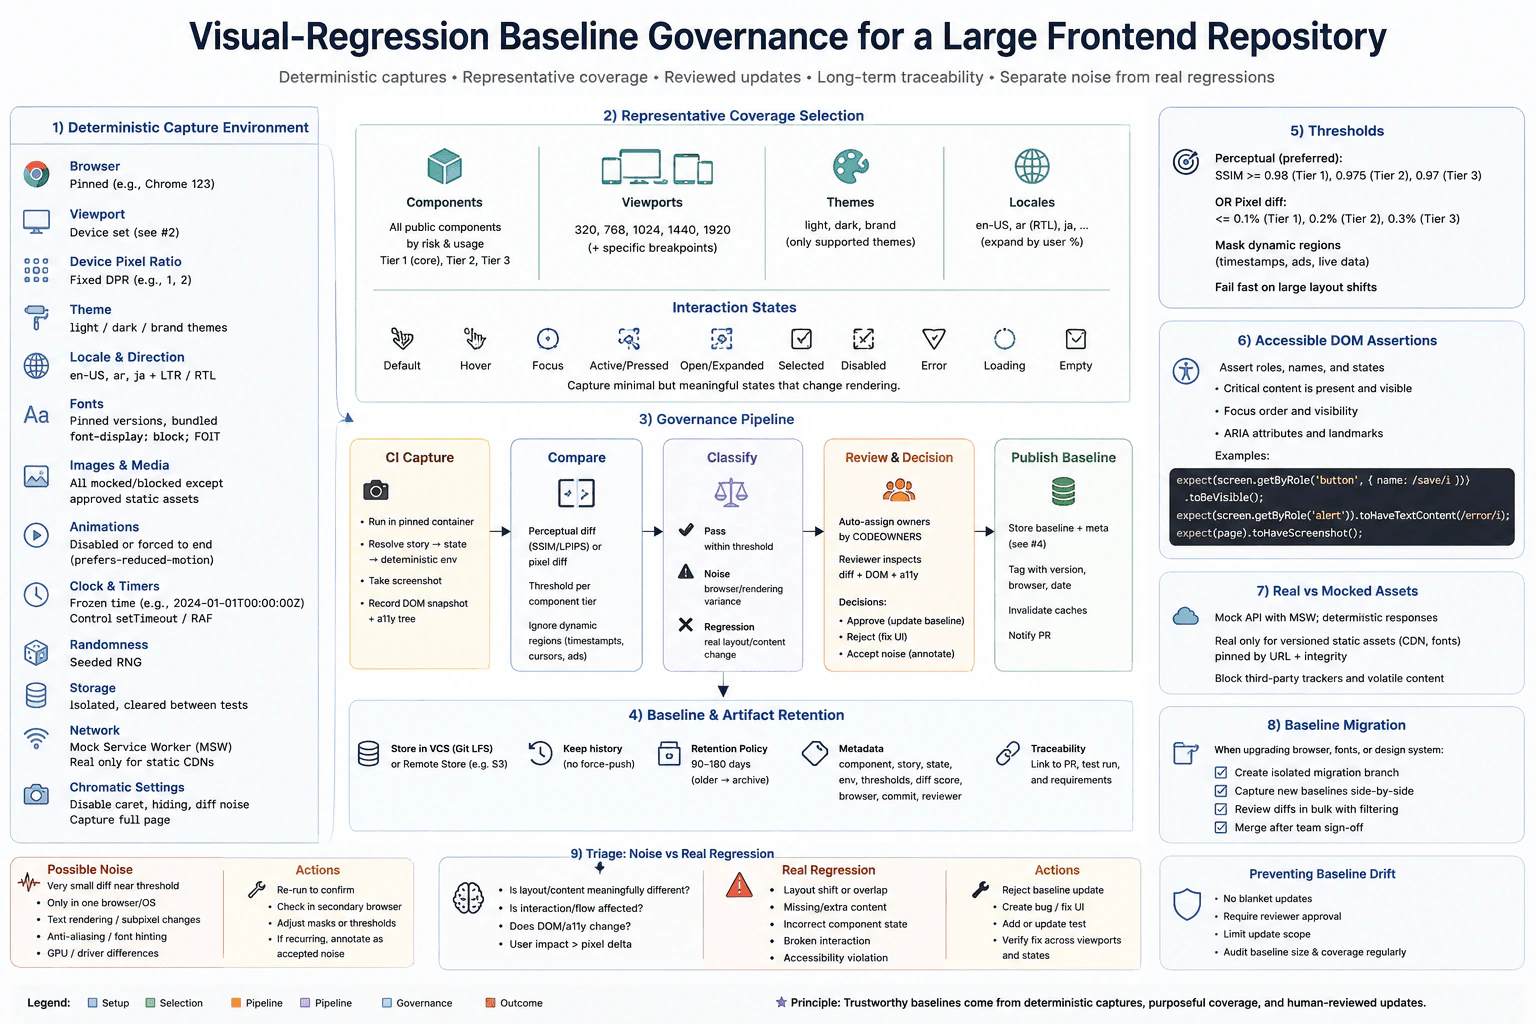
85. Design governance for visual-regression baselines in a large frontend repository.TestingHard

Question Details

Hundreds of components have snapshots at multiple viewports, themes, locales, and interaction states, and indiscriminate baseline updates have hidden defects. Define deterministic fixture, font, image, animation, clock, and browser settings; representative state and viewport selection; pixel or perceptual thresholds; accessible DOM assertions; pointer and keyboard states; real versus mocked network assets; reviewer ownership; artifact retention; and baseline migration. Include how to triage browser-rendering noise separately from a real layout regression.

Short Interview Answer (30-60 seconds)

I would make baseline updates a controlled review process, not an automatic response to every image difference. First I would make captures deterministic by pinning the browser, viewport, device pixel ratio, fonts, locale, theme, clock, randomness, storage, animations, and network behavior. I would capture representative components, viewports, themes, locales, and interaction states. CI would compare screenshots with small approved perceptual or pixel thresholds and run accessible DOM assertions. It would classify the result as pass, rendering noise, or real regression. Component owners would review intentional changes before publishing a new baseline. This costs more setup and review time, but it prevents silent baseline drift.

Detailed Explanation

The goal is to stop accidental picture changes from becoming the new normal. Every test run should create the same picture when the product has not changed. We choose a useful set of screens, sizes, colors, languages, and user states instead of testing every possible combination. When a picture changes, the system should show the old result, new result, and difference. A person who owns that part of the product decides whether the change is expected. Important results stay available so the team can understand when, why, and by whom an approved picture changed.

Useful Questions to Ask the Interviewer
  1. Which browsers, viewports, device pixel ratios, themes, and locales are officially supported?
  2. Do component owners already exist through CODEOWNERS or another ownership model?
  3. How long should screenshot differences and approved baselines be retained?
  4. Are visual tests expected to use only controlled assets, or must some versioned real assets remain part of the test?
Design governance for visual-regression baselines in a large frontend repository. diagram
How to Explain It in an Interview

I would treat this as visual regression testing in a real browser with a controlled environment and a governed baseline lifecycle. The confidence boundary is the rendered user interface plus the important accessible DOM state. The test proves that a selected component state renders close enough to an approved baseline under known browser conditions. It does not prove every browser, every viewport, every locale, every state, or every remote service works.

First I make capture deterministic. I pin the browser version used by CI and run it in a controlled runner or container. I use explicit viewport sizes and device pixel ratios. I load pinned test fonts and wait until they are ready before capture. I control locale, text direction, time zone, theme, feature flags, storage, and seeded random data. I freeze the clock when time affects rendering. I disable animations or force them to a stable final state before the screenshot. Images and other media should use versioned stable assets. Volatile third party content should not affect the baseline.

For network behavior, I would normally mock API responses with Mock Service Worker so the component receives deterministic data through the normal browser request boundary. Static assets such as fonts, icons, images, videos, and style files can stay real when they are versioned, pinned, and intentionally part of what we want to verify. Real static assets should be loaded from a stable location with versioned URLs or integrity controls. Trackers, advertisements, and other volatile remote content should be blocked or replaced.

Next I choose representative coverage. I would not build the full product of every component, viewport, theme, locale, state, and browser. That becomes expensive and difficult to review. I would rank components by reuse, user impact, and visual risk. Core components get the strongest coverage. Lower risk components get a smaller matrix.

For viewports, I would use supported breakpoints such as 320, 768, 1024, 1440, and 1920 pixels when those sizes match the product. I would add another size only when layout behavior changes there. For themes and locales, I would include the supported combinations that are most likely to expose spacing, contrast, text length, or direction problems. Right to left locales deserve explicit coverage when the product supports them.

For each component, I would capture meaningful states that visibly change rendering. Examples include default, hover, focus, active, pressed, open, expanded, selected, disabled, loading, empty, and error. Pointer and keyboard states both matter. A hover screenshot does not prove keyboard focus is visible. I would explicitly move focus with realistic browser actions and verify focus order and visible focus treatment when that behavior matters.

The capture step should resolve the exact component story or scenario and state, render it in the pinned browser, wait for stable fonts and assets, take the screenshot, and record a DOM snapshot or accessibility tree when useful. Each case should start with clean storage and controlled state so one test cannot affect another.

Visual comparison should use a small approved threshold instead of accepting every changed pixel. I would prefer a perceptual comparison such as SSIM or LPIPS for general visual similarity and keep pixel comparison available where exact pixels matter. Thresholds can vary by component tier because small text and icon regions behave differently from large containers or charts. A policy could use stricter limits for core components and slightly wider limits for lower risk components. Large layout shifts, clipping, missing content, and major spacing changes should fail immediately.

Some regions are naturally unstable. Examples include timestamps, advertisements, live data, cursors, or other dynamic content. I would mask or ignore those regions only when they are not part of the behavior being tested. Every mask should be narrow and reviewed because a large mask can hide a real defect.

A screenshot cannot prove accessibility by itself, so I would run accessible DOM assertions beside the visual comparison. I would check important roles, accessible names, states, visible critical content, focus order, ARIA attributes, landmarks, and relevant accessibility rules. Contrast checks can also run where the selected tooling supports them. These assertions can catch a defect that leaves the pixels unchanged, such as a button losing its accessible name.

In CI, the main flow is capture, compare, classify, review, and publish. A result inside the approved threshold passes. A very small inconsistent difference can be classified as possible rendering noise for investigation. A consistent layout, content, interaction, or accessibility change is treated as a real regression until someone proves that the change is intentional.

Noise triage starts by rerunning the exact same deterministic case. If the difference changes between runs, appears only on one browser or operating system, or is limited to subpixel text rendering, font hinting, antialiasing, GPU behavior, driver behavior, or rounding, I investigate the environment before touching the baseline. I would confirm the same case in another runner or browser environment. Possible responses include pinning a missing dependency, tightening font loading, correcting device pixel ratio settings, adjusting a narrowly justified mask, changing a narrowly justified threshold, or keeping a browser specific baseline when supported browsers consistently render differently.

A real regression is usually consistent. It may move or resize an element, create overlap or clipping, remove or add unexpected content, change wrapping, render the wrong component state, break an interaction, or create an accessibility violation. In that case I reject the baseline update and fix the code or design. I would then rerun the affected states and viewports. If the visual change is intentional, the author requests a baseline update and explains why.

Baseline updates should require human review. CI can assign the relevant component owner through CODEOWNERS. The reviewer should inspect the old image, new image, visual difference, DOM information, and accessibility result. The reviewer should confirm that the design change is intentional and that the update scope is limited. A blanket baseline update should not be accepted merely because many screenshots changed.

When a baseline is approved, I would store the baseline plus metadata such as component, story or scenario, state, viewport, environment, threshold, browser, commit, and reviewer. The pull request should link to the test run and artifacts. Baselines can live in version control with Git LFS or in a remote artifact store. History should remain traceable rather than being rewritten. Difference artifacts can use a retention window such as 90 to 180 days, while approved baselines and important migration records may be retained longer according to repository policy.

For baseline migration, such as a browser upgrade, font change, or design system release, I would create an isolated migration branch. CI would recapture the selected matrix using the new deterministic environment. Reviewers would compare old and new baselines side by side and filter changes by component or owner. The new baseline set would be merged only after team approval. The old set should remain available during a validation window so suspicious changes can still be investigated.

To prevent baseline drift, I would reject blanket updates, require reviewer approval, limit update scope, keep an audit trail, and periodically review baseline size and coverage. The main tradeoff is coverage versus maintenance cost. More screenshots can detect more visual differences, but they also increase CI runtime, storage, review load, and noise. The best governance model keeps captures deterministic, selects representative cases, uses small explainable thresholds, adds accessible DOM checks, assigns clear owners, keeps artifacts traceable, and changes baselines intentionally.

Technical Approach
  1. Define the confidence boundary. Treat the real browser render and important accessible DOM state as the behavior under test.
  2. Pin the capture environment. Control browser version, viewport, device pixel ratio, fonts, locale, direction, time zone, theme, clock, randomness, storage, animations, and feature flags.
  3. Stabilize data and assets. Use explicit fixtures, Mock Service Worker for deterministic API responses, and versioned real static assets only when they are intentionally part of the test.
  4. Select representative coverage. Rank components by reuse, user impact, and visual risk. Choose supported viewport breakpoints, themes, locales, and visible states instead of every possible combination.
  5. Capture meaningful pointer and keyboard states. Include hover, focus, active, pressed, expanded, selected, disabled, loading, empty, and error only when they change user visible behavior.
  6. Render the exact scenario in the pinned real browser. Wait for stable fonts and assets, capture the screenshot, and record the useful DOM or accessibility state.
  7. Compare with the approved baseline. Use a small perceptual threshold and pixel comparison where exact pixels matter. Mask only narrowly justified dynamic regions.
  8. Run accessible DOM assertions. Check important roles, names, states, focus order, visible content, ARIA attributes, landmarks, and relevant accessibility rules.
  9. Classify the result. Pass stable results inside the threshold. Investigate inconsistent subpixel or browser rendering differences as noise. Treat consistent layout, content, state, interaction, or accessibility changes as regressions.
  10. Require owner review for intentional changes. Show the old image, new image, visual difference, metadata, and accessibility result before publishing a replacement baseline.
  11. Retain baselines, difference artifacts, metadata, and audit history according to repository policy.
  12. Migrate baselines in an isolated branch when browsers, fonts, or design systems change. Recapture the selected matrix, review changes in bulk, and merge only after approval.
Practical Insights

Traditional algorithmic complexity is not the main concern. The practical cost grows with the number of selected components, states, viewports, themes, locales, and browsers. Every added combination creates more browser runtime, screenshots, comparison work, storage, and reviewer effort. The largest maintenance cost is often keeping fixtures deterministic and reviewing visual differences carefully. A representative matrix keeps CI and storage manageable while still covering important visual risk. Retention also has a storage cost, so temporary difference artifacts can expire sooner than approved baselines and migration history.

Why Interviewers Ask This

Interviewers ask this to see whether I can treat visual regression testing as a governed engineering system instead of a screenshot update task. They want to know whether I can make browser captures deterministic, choose representative coverage, separate rendering noise from real defects, combine visual checks with accessible DOM checks, define reviewer ownership, retain evidence, and migrate baselines without hiding regressions.

Common interview mistakes

Common mistakes include updating every failed baseline without reviewing the visual difference, using an unstable browser or font environment, taking screenshots before fonts or images are ready, depending on live APIs, capturing every possible matrix combination, or using thresholds so wide that real layout changes pass. Another mistake is trusting pixels alone and skipping roles, names, focus, states, and other accessible DOM assertions. Teams also create noise when animations, clocks, random data, storage, locale, device pixel ratio, or feature flags are uncontrolled. Large masks can hide bugs. Weak ownership allows unrelated baseline changes to be approved casually. Browser, font, or design system upgrades should be reviewed migrations instead of silent baseline rewrites.

Interview tip

Explain the flow in this order: make the browser deterministic, choose representative cases, capture meaningful pointer and keyboard states, compare with a small threshold, add accessible DOM checks, separate noise from real regressions, require owner approval, retain traceable artifacts, and migrate baselines deliberately. Emphasize that a changed screenshot is evidence to review, not permission to update the baseline.

Interviewer may ask next
What would you do if the same visual test sometimes fails by a few pixels on only one browser runner?

I would treat that as a rendering noise investigation before changing the baseline. The boundary is the deterministic real browser capture for that exact component, state, viewport, and browser version. I would rerun the same case, confirm fonts and static assets finished loading, check device pixel ratio, clock, animation state, locale, GPU behavior, driver behavior, and subpixel text rendering. I would also compare the same scenario in another runner or browser environment. If the difference is inconsistent, I would correct the environment or use a narrowly justified threshold or mask. If one supported browser consistently renders differently, I may keep a browser specific baseline. I would not replace a shared baseline merely to silence an unstable runner.

How would you keep the visual test suite useful when the repository grows to thousands of components?

I would keep the same governance boundary but reduce unnecessary combinations. I would classify components by reuse, user impact, and visual risk, then choose a representative set of viewports, themes, locales, and interaction states for each class. Core components would get stricter thresholds and broader coverage. CI could run the highest value cases on every pull request while broader coverage runs on scheduled builds or release checks. The tradeoff is that less frequent coverage can delay detection of rare combinations, but that is usually better than an enormous suite that becomes slow, noisy, expensive, and routinely ignored.

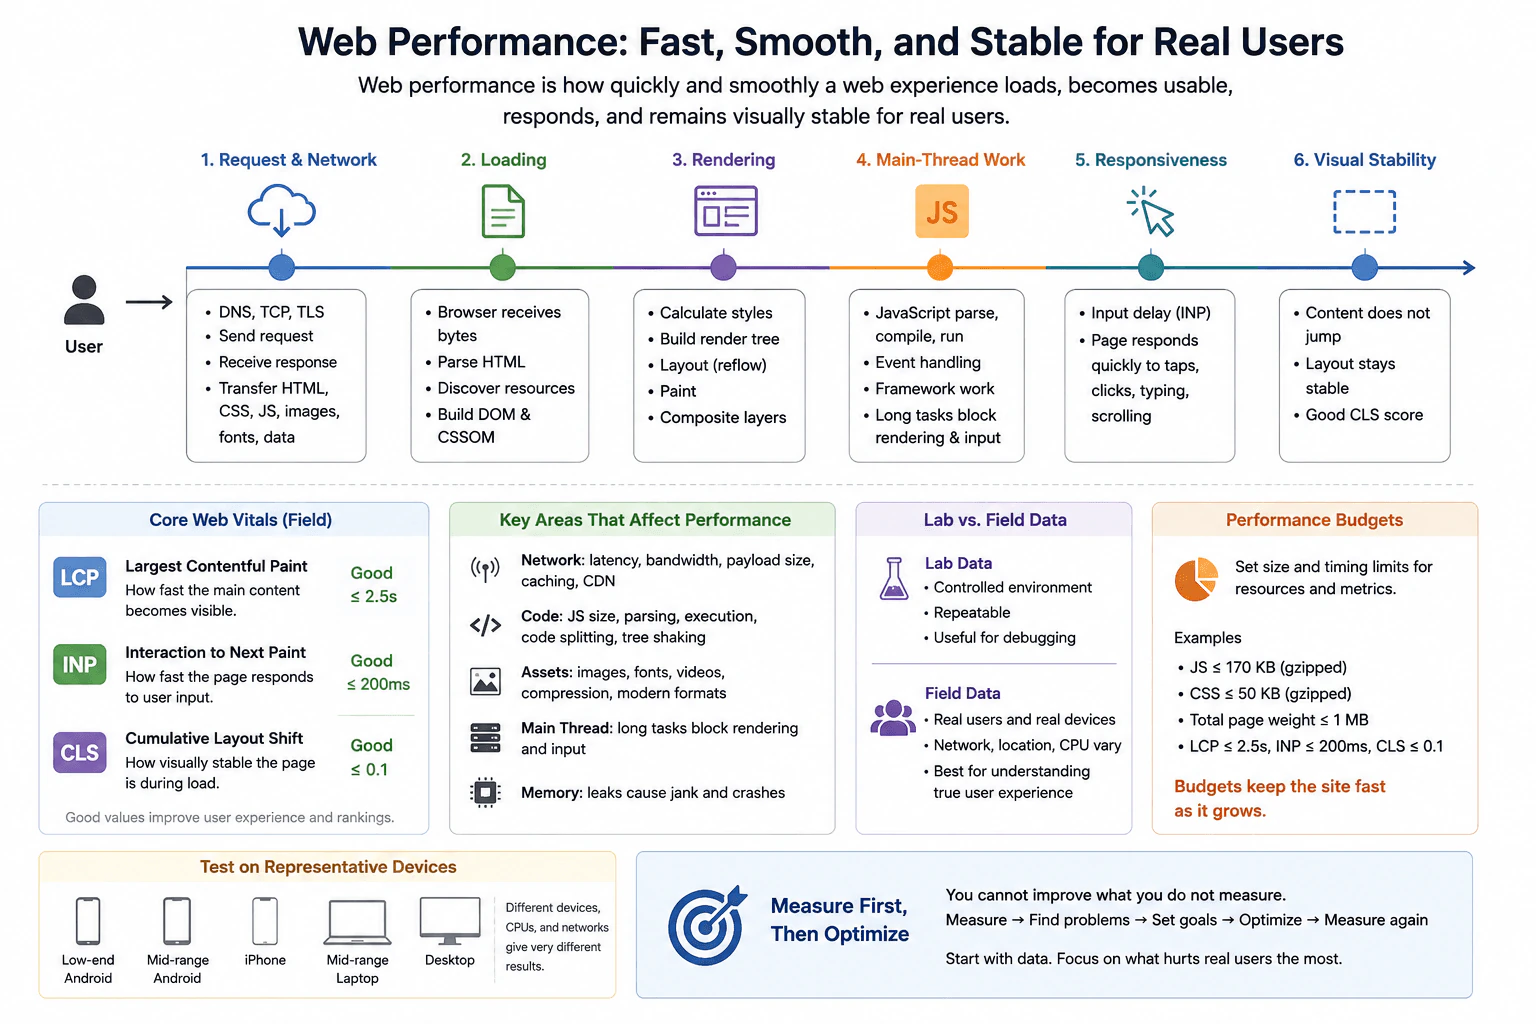
86. What is web performance?PerformanceEasy

Question Details

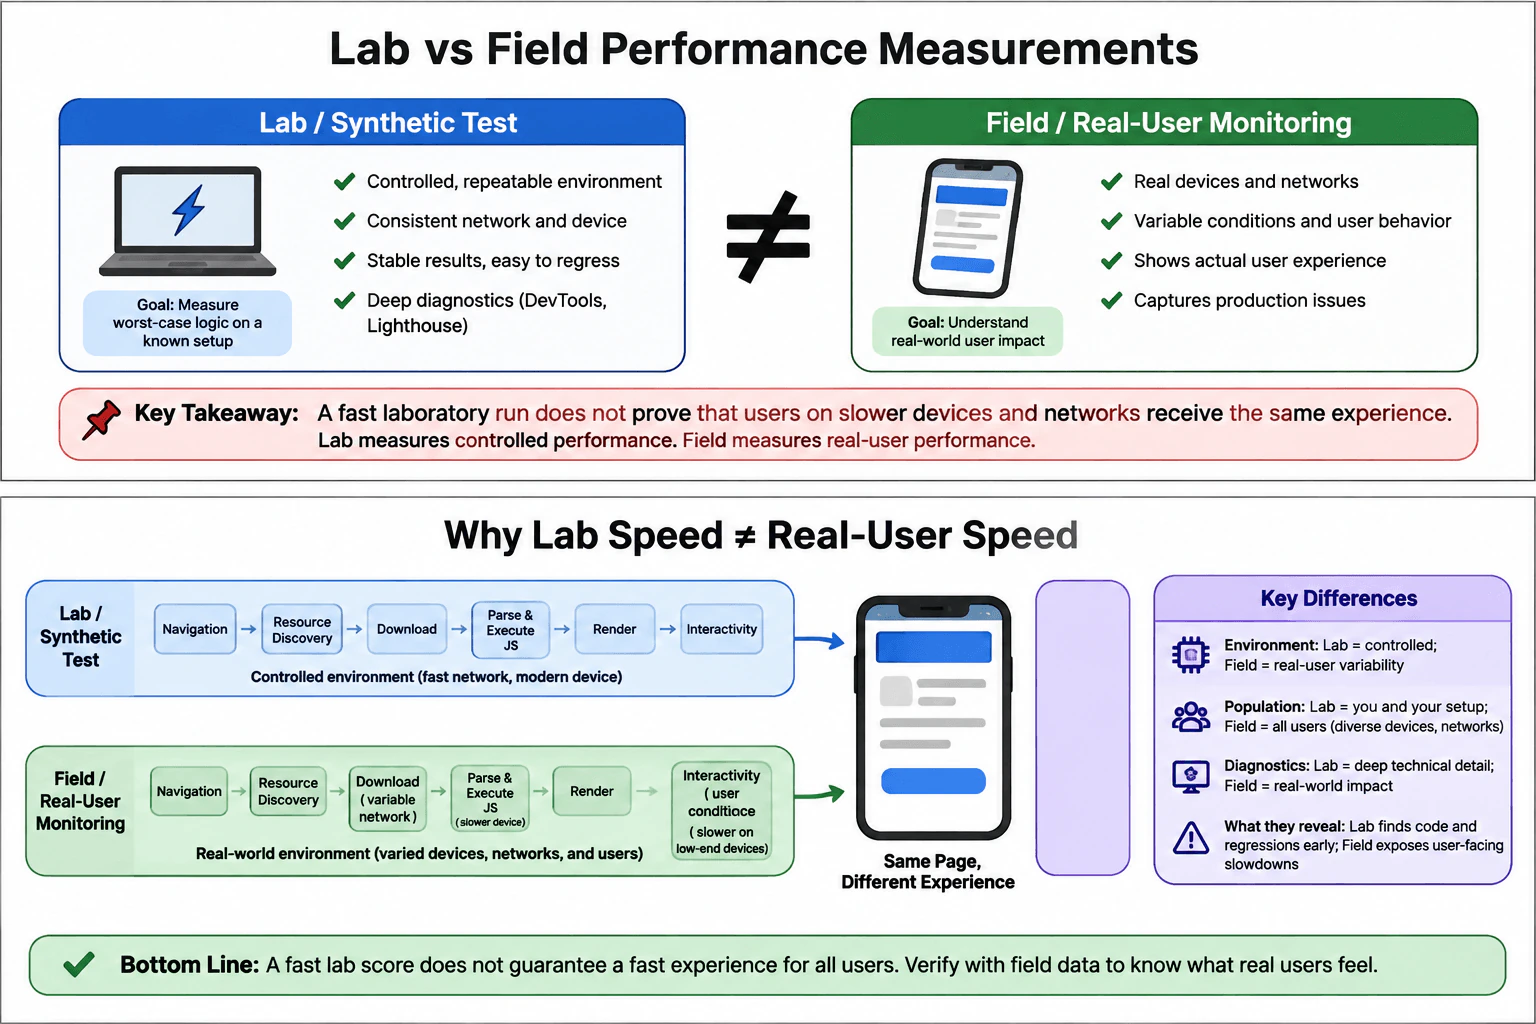
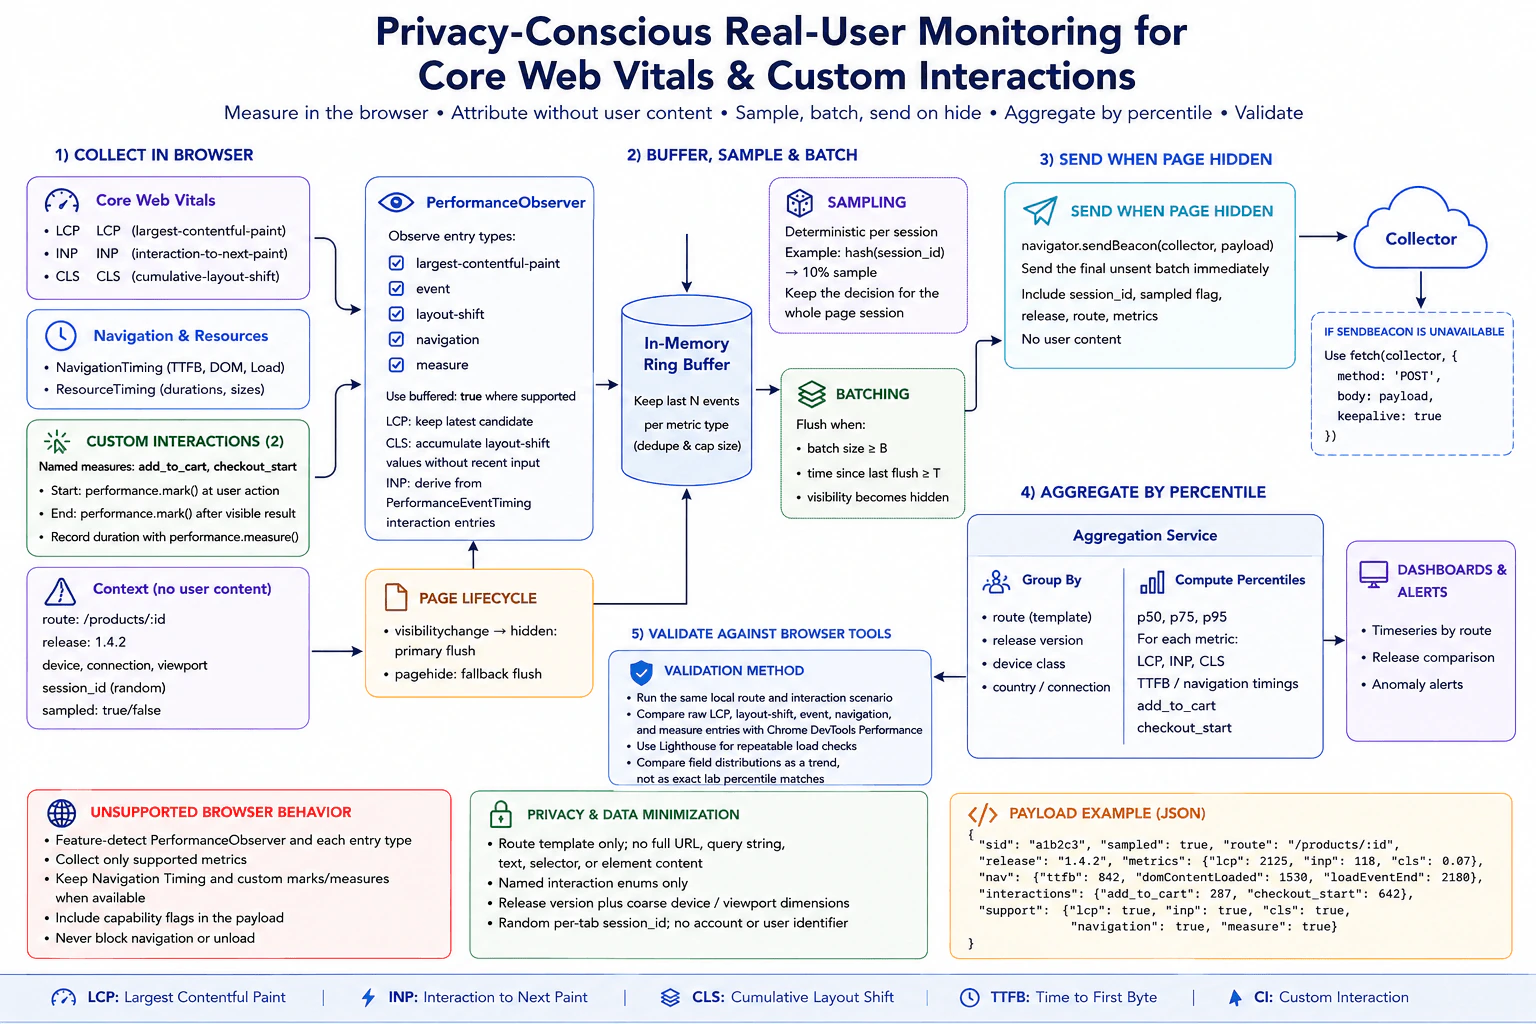
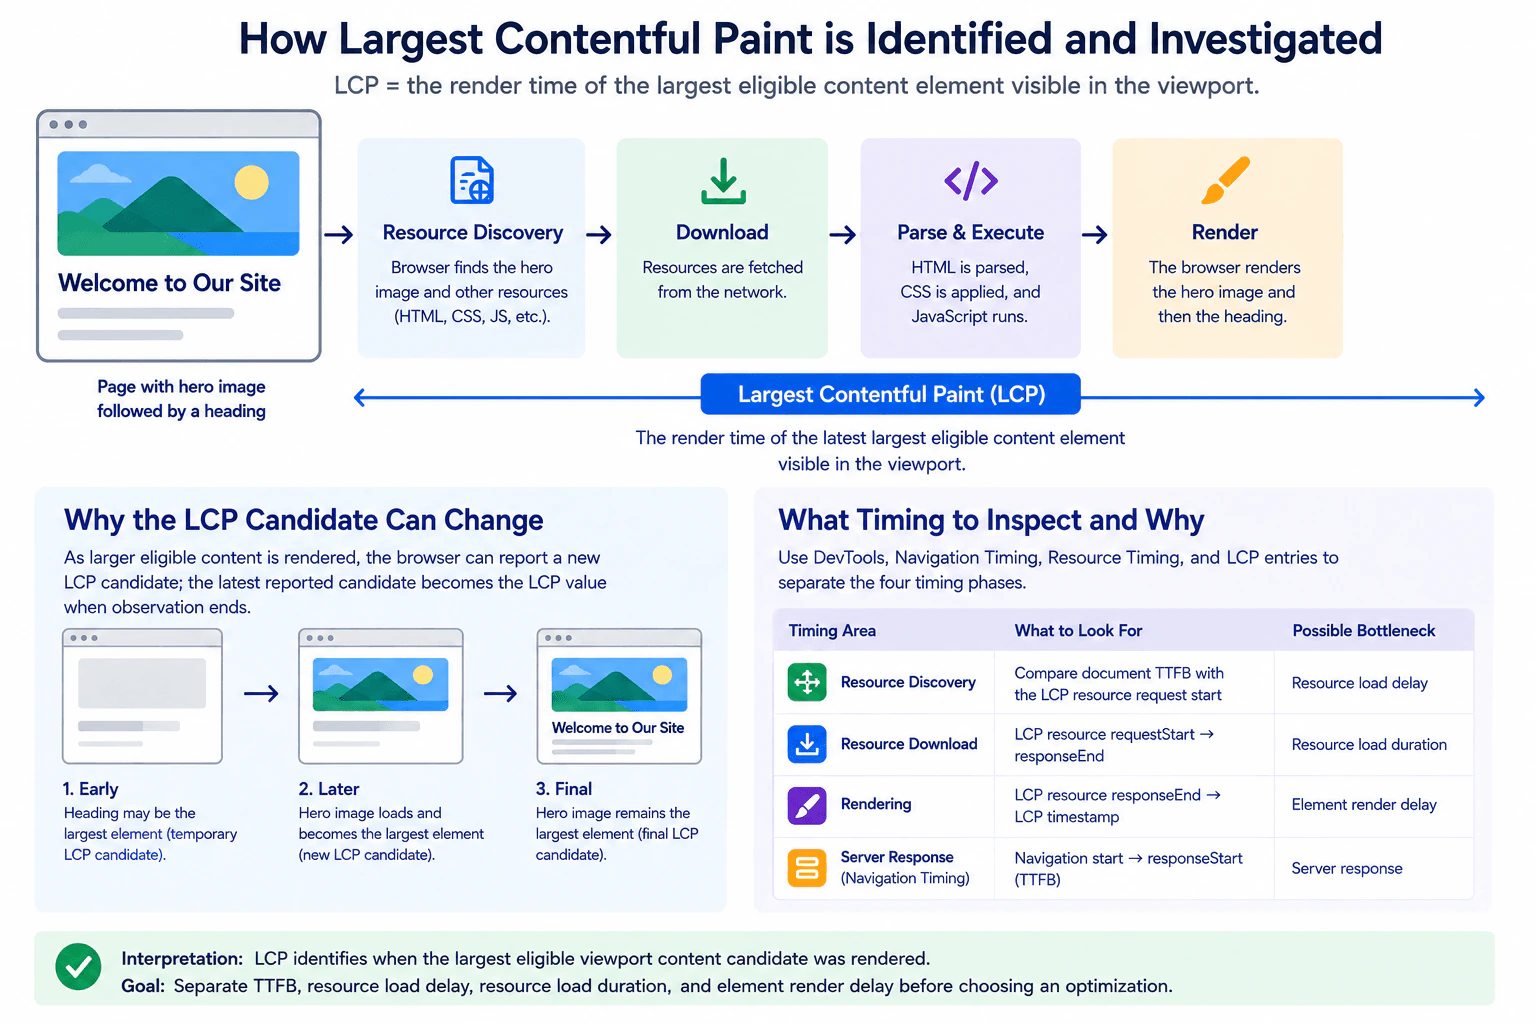
Define web performance as how quickly and smoothly a web experience loads, becomes usable, responds, and remains visually stable for real users. Explain loading, rendering, main-thread work, network transfer, responsiveness, memory, Core Web Vitals, lab versus field data, performance budgets, representative devices, and why measurement must come before optimization.

Short Interview Answer (30-60 seconds)

I would measure the real user experience first, then optimize the part that the evidence shows is slow. Web performance means how quickly a page loads and becomes usable, how fast it responds to input, and whether the layout stays visually stable. I look at Core Web Vitals such as LCP, INP, and CLS, plus network transfer, JavaScript work, rendering, and memory. I use field data for real users and lab data for controlled testing. The main tradeoff is that an optimization can add complexity, so I only make changes that solve a measured problem.

Detailed Explanation

Web performance is about how fast and smooth a website feels to a real person. A good page should show useful content quickly, become ready to use soon, react quickly when someone taps, clicks, types, or scrolls, and avoid content jumping around. It should also keep working well on ordinary phones, computers, and network connections. The best way to improve it is to measure what people experience first, find the part causing the delay or instability, make a focused change, and then measure the same experience again.

Useful Questions to Ask the Interviewer
  1. Are we discussing page loading, user interaction, or the overall browser experience?
  2. Should I focus on real user measurements, controlled tests, or both?
  3. Are there target devices, browsers, or network conditions that matter most?
What is web performance? diagram
How to Explain It in an Interview

I would start with the user visible symptom and a metric that proves it. For loading, I can use Largest Contentful Paint, or LCP, which measures when the main visible content appears. A good target shown in the diagram is 2.5 seconds or less. For responsiveness, I can use Interaction to Next Paint, or INP, which measures how quickly the page gives visual feedback after user input. A good target is 200 milliseconds or less. For visual stability, I can use Cumulative Layout Shift, or CLS. A good target is 0.1 or less.

Next, I would define the measurement boundary. I would choose the exact page or interaction, browser, representative device, network condition, cache state, build mode, and measurement period. This matters because a fast desktop with a strong connection can hide problems that real users see on slower phones and networks.

I would then separate the browser work into clear stages. The request and network stage includes DNS, TCP, TLS, sending the request, receiving the response, and transferring HTML, CSS, JavaScript, images, fonts, and data. The loading stage includes receiving bytes, parsing HTML, discovering resources, and building the DOM and CSSOM. The rendering stage includes style calculation, building the render tree, layout, paint, and compositing. Main thread work includes JavaScript parsing, compiling, execution, event handling, framework work, and DOM updates. Long tasks can block rendering and input.

Responsiveness means the page reacts quickly to taps, clicks, typing, and scrolling. Visual stability means content does not unexpectedly jump while the page is loading or updating. These experiences are represented by INP and CLS in the diagram.

Memory also affects performance. Retained objects, DOM nodes, event listeners, timers, subscriptions, closures, caches, large buffers, or detached trees can increase memory use. This can lead to pauses, jank, or crashes. I would use browser memory tools and repeatable actions before calling something a memory leak.

I would use both lab and field data. Lab data gives a controlled and repeatable environment that is useful for debugging and testing changes. Field data comes from real users on real devices and networks, so it shows the experience people actually receive. One controlled test or one score is not enough proof of production performance.

I would also use performance budgets as guardrails. The diagram shows example limits such as JavaScript at 170 KB or less when compressed, CSS at 50 KB or less when compressed, total page weight at 1 MB or less, LCP at 2.5 seconds or less, INP at 200 milliseconds or less, and CLS at 0.1 or less. These are example project limits, not universal requirements. A team should choose budgets that fit its product and users.

I would test on representative devices and conditions. The diagram includes lower end and middle range Android phones, an iPhone, a middle range laptop, and a desktop. Different CPUs, networks, and device capabilities can produce very different results, so testing only on a powerful development machine is not enough.

After measuring, I would classify the bottleneck. A network problem may involve latency, bandwidth, large payloads, caching, or too many requests. A JavaScript problem may involve large bundles, parsing, execution, or long tasks. A rendering problem may involve expensive style calculation, layout, paint, compositing, or large DOM updates. A responsiveness problem may come from main thread blocking. A memory problem may come from retained references.

Only then would I optimize. The change should match the evidence. Examples include removing unused JavaScript, splitting code, compressing assets, improving image or font delivery, reducing unnecessary requests, avoiding long tasks, reducing layout work, or fixing retained objects. I would then repeat the same test with the same workload and conditions. I would confirm that the target metric improved, the page still works correctly, the layout stays stable, accessibility still works, memory does not regress, and another bottleneck did not become the new problem.

The main rule is simple: measure first, find the problem, set a goal, optimize, and measure again. That prevents guessing and keeps performance work focused on what real users actually experience.

Technical Approach
  1. Define the user visible symptom, such as slow loading, delayed input, layout movement, or growing memory use.
  2. Choose the metric that proves the problem, such as LCP, INP, CLS, network timing, a browser trace, or memory measurements.
  3. Define the exact page, interaction, browser, representative device, network condition, cache state, build mode, and measurement period.
  4. Capture a baseline before changing code.
  5. Use field data to understand real users and lab data to reproduce the problem under controlled conditions.
  6. Break the browser work into request and network transfer, loading, JavaScript execution, rendering, responsiveness, visual stability, and memory.
  7. Use the appropriate browser tool to find evidence for the suspected bottleneck.
  8. Choose one change that directly addresses the measured bottleneck.
  9. Repeat the same scenario under the same conditions after the change.
  10. Verify the target metric, correctness, visual stability, accessibility, memory use, and possible regressions elsewhere.
Practical Insights

Performance work has its own cost. Collecting traces and field measurements takes engineering time and can add small measurement overhead. Reducing JavaScript or assets may require build changes and extra maintenance. Code splitting can improve the first load but may delay a feature until another file is downloaded. More caching can reduce network work but can make invalidation harder. Moving suitable heavy computation to a Web Worker can improve responsiveness, but startup, communication, copying or transferring data, cleanup, browser support, and extra memory add cost. Performance budgets also need maintenance as the product changes. The goal is not the smallest possible page at any cost. The goal is a fast, stable experience with acceptable complexity.

Why Interviewers Ask This

Interviewers ask this question to see whether I understand performance as a real user experience, not only as a page load number. They want to know whether I can measure loading, rendering, JavaScript work, responsiveness, visual stability, network transfer, and memory before changing code. They also want to see whether I understand field data, controlled lab tests, representative devices, performance budgets, and the need to verify an optimization with the same conditions.

Common interview mistakes

Common mistakes include optimizing before measuring, trusting one local run as proof, using only a single lab score, testing only on a powerful desktop and fast network, comparing before and after results under different conditions, and treating every delay as a JavaScript problem. Another mistake is assuming that Promises move CPU work away from the browser main thread. They do not. Developers can also focus only on loading while ignoring interaction delay, visual stability, or memory growth. Performance budgets can also be misused as universal rules instead of project guardrails. Finally, an optimization is incomplete if the team does not verify correctness, accessibility, real user metrics, and whether the bottleneck moved somewhere else.

Interview tip

Start with the user experience and the metric that proves the problem. Then explain the browser stages in order: request and network transfer, loading, rendering, JavaScript main thread work, responsiveness, visual stability, and memory. Say clearly that field data shows real users while lab data helps reproduce problems. Finish with the strongest rule: measure first, make one evidence based change, and measure again under the same conditions.

Interviewer may ask next
What if the page looks fast in a lab test but real users still report slow interactions?

I would trust neither source alone. For the same page and interaction, I would compare field INP data with a controlled browser trace on representative devices and networks. The lab test may be using a faster CPU, a different cache state, or an interaction that does not reproduce the real workload. I would inspect main thread waiting, event handler work, JavaScript execution, rendering, and the next visual update. This matters because a good loading result does not prove good responsiveness. The tradeoff is that field data is realistic but less controlled, while lab data is easier to reproduce but may not represent every user.

How would you use performance budgets without treating them as proof that the site is fast?

I would use the budgets as guardrails for the same frontend workload, not as the final measurement. For example, I could track compressed JavaScript size, CSS size, total page weight, LCP, INP, and CLS during development. If a change exceeds a budget, it should trigger investigation. I would still validate the release with representative lab tests and real user field data because a page can stay under a size limit and still be slow because of main thread work, request timing, rendering, or device limits. The main tradeoff is that strict budgets help prevent gradual regressions, but poorly chosen limits can block useful product changes without proving a real user problem.

87. What do the Core Web Vitals measure for a frontend application?PerformanceEasy

Question Details

For a production web page, explain what Largest Contentful Paint, Interaction to Next Paint, and Cumulative Layout Shift each represent from the user's perspective. For every metric, identify the browser event or visual behavior it summarizes, whether lower or higher is better, and one kind of frontend change that can affect it. Distinguish these user-experience metrics from server uptime and raw API latency.

Short Interview Answer (30-60 seconds)

Core Web Vitals measure what users actually experience in the browser. LCP measures loading performance by looking at when the largest visible content element is painted. INP measures responsiveness by looking at the time from a user interaction until the next visual update. CLS measures visual stability by scoring unexpected layout movement. Lower is better for all three. A good LCP is at most 2.5 seconds, a good INP is at most 200 milliseconds, and a good CLS is at most 0.10. These browser experience metrics are different from server uptime and raw API latency.

Detailed Explanation

These measurements tell us whether a web page feels fast, responds quickly when someone uses it, and stays visually steady while the person reads or interacts with it. One measurement looks at when the main visible content appears. Another looks at how quickly the page shows a result after a click, tap, or key press. The third looks at whether visible content unexpectedly moves around. Smaller values are better. Together, they describe important parts of the experience a person can actually see and feel while using a page.

Useful Questions to Ask the Interviewer
  1. Are we discussing real user data from production or a controlled browser test?
  2. Should I explain the standard good thresholds for each metric?
  3. Do you want one example frontend change that can affect each metric?
What do the Core Web Vitals measure for a frontend application? diagram
How to Explain It in an Interview

I would explain the metrics in the same order that a user can experience them.

First is LCP, or Largest Contentful Paint. It measures loading performance. It records when the largest eligible visible content element in the viewport is painted. From the user's point of view, this helps describe when the main visible content feels available. Lower is better. A good LCP is at most 2.5 seconds. A frontend change that can affect it is optimizing the hero image or an important resource needed to render that content.

Second is INP, or Interaction to Next Paint. It measures responsiveness. It looks at interaction latency from user input, through work on the browser main thread, until the browser can present the next visual update. It summarizes responsiveness across the user interactions observed during the page visit rather than judging only one click. Lower is better. A good INP is at most 200 milliseconds. A useful frontend change is reducing long main thread tasks or expensive event handler work.

Third is CLS, or Cumulative Layout Shift. It measures visual stability. It measures the largest session window score of unexpected layout shifts. From the user's point of view, a low score means buttons, text, images, and other content stay where expected instead of moving unexpectedly. Lower is better. A good CLS is at most 0.10. A common frontend change is reserving width and height, or aspect ratio space, for images, ads, and dynamic content before they appear.

The measurement boundary is the browser experience. Server uptime and raw API request and response latency are separate signals and are not Core Web Vitals. They can influence what a user eventually experiences, but they do not replace LCP, INP, or CLS. A server can be available while a page still loads slowly, responds poorly, or shifts unexpectedly.

For production validation, I would use real user browser measurements to understand actual devices, networks, cache states, and user behavior. A controlled browser test is useful for reproducing a problem and finding its cause, but one local run or one Lighthouse result is not enough to prove production performance. After a frontend change, I would compare the same page and interaction conditions, measure the same target metric again, and confirm that correctness, accessibility, and other important interactions still work.

Technical Approach
  1. Identify the user experience problem. Use LCP for slow main content appearance, INP for slow interaction feedback, and CLS for unexpected visual movement.
  2. Capture a baseline under known browser, device, network, build, and cache conditions when those details matter.
  3. Use production field measurements to understand real users. Use a controlled browser test to reproduce a specific problem.
  4. Connect the metric to browser behavior. For LCP, inspect loading and rendering of the largest visible content. For INP, inspect user input, main thread waiting, event handler work, rendering, and the next paint. For CLS, inspect which visible elements move unexpectedly and why.
  5. Make one change that matches the evidence. Optimize an important image or critical resource for LCP, reduce long main thread work for INP, or reserve layout space for CLS.
  6. Repeat the same representative scenario after the change.
  7. Measure the target metric again and verify correctness, accessibility, supported browser behavior, and possible regressions elsewhere.
Practical Insights

This approach does not have a useful algorithmic complexity such as Big O because the question is about browser experience metrics. The practical cost is measurement and engineering work. LCP changes can involve image processing, resource loading, and cache behavior. INP changes can require breaking expensive JavaScript work into smaller pieces, which can increase code and maintenance cost. CLS changes can require layout and component styling changes. Browser profiling also adds temporary measurement overhead. The important tradeoff is to improve the measured user experience without harming correctness, accessibility, or another important interaction.

Why Interviewers Ask This

Interviewers ask this to check whether I understand frontend performance from the user's point of view. They want to see whether I can separate loading performance, interaction responsiveness, and visual stability, choose the correct metric for each problem, connect browser evidence to a frontend change, and avoid confusing browser experience with server uptime or raw API latency.

Common interview mistakes

Common mistakes include treating Core Web Vitals as server health metrics, using raw API latency as a replacement for browser measurements, saying that higher values are better, or mixing the three metrics together. Another mistake is treating LCP as the time when the whole page finishes loading. For INP, a candidate may look only at one fast click and ignore responsiveness across the page visit. For CLS, a candidate may treat every visual movement as a problem instead of focusing on unexpected layout shifts. It is also a mistake to optimize before measuring, trust one local run as production proof, compare different workloads before and after a change, or improve a metric by removing useful feedback, accessibility behavior, validation, or error handling.

Interview tip

Explain the three metrics from the user's point of view. Say LCP means loading performance, INP means responsiveness, and CLS means visual stability. State that lower is better for all three, give one frontend change for each, and finish by saying that these browser experience metrics are different from server uptime and raw API latency.

Interviewer may ask next
If the API responds quickly but INP is still poor, what would you investigate?

I would investigate the browser interaction path instead of assuming the API is the problem. For the same user interaction, I would look at input arrival, waiting on the main thread, event handler work, state updates, rendering work, and the next paint. A fast API can still be followed by expensive JavaScript or rendering that delays visible feedback. I would use a browser performance trace to find that work, make an evidence based change such as reducing a long main thread task, and retest the same interaction. The main tradeoff is that splitting work can add code complexity, so I would verify correctness and responsiveness together.

How would you validate a Core Web Vitals improvement before and after releasing it?

I would compare the same page and user interaction under the same controlled conditions first, then watch real user browser measurements after release. The measurement boundary remains the browser experience for LCP, INP, and CLS. I would not use one Lighthouse run, server uptime, or raw API latency as final proof. I would compare representative field distributions, confirm that the target metric improved, and check correctness, accessibility, errors, and other important routes or interactions. The main tradeoff is that controlled tests are easier to reproduce, while field data better represents real devices, networks, cache states, and user behavior.

88. How do lab performance measurements differ from field measurements?PerformanceEasy

Question Details

Compare a repeatable local or synthetic test with real-user monitoring for the same page. Cover the environment represented, variability, available diagnostics, population bias, and the kinds of regressions each method can reveal. Explain why a fast laboratory run does not prove that users on slower devices and networks receive the same experience.

Short Interview Answer (30-60 seconds)

I use lab measurements to test the same page in a controlled and repeatable environment, and I use field measurements to understand what real users experience. Lab tests use known device and network conditions, so results are more stable and detailed diagnostics are easier to collect with browser DevTools or Lighthouse. Field measurements come from real devices, networks, browsers, and user behavior, so they have much more variation. Lab tests are useful for finding code and asset regressions. Field data can reveal production problems that appear only for certain users. A fast lab result does not prove that users on slower devices or networks get the same experience, so I use both.

Detailed Explanation

A laboratory test checks the same page in a setup that I can control and repeat. This makes changes easier to compare. A field measurement watches what happens when real people use the page on their own devices and networks. Those conditions can be much faster or slower than my test setup. The two methods therefore answer different questions. One gives detailed evidence in a known environment. The other shows what real users actually experience. A fast laboratory result cannot prove that every user gets the same result because real devices, networks, browsers, and behavior vary.

Useful Questions to Ask the Interviewer
  1. Are we comparing the same page and user action in both environments?
  2. Which device classes, browsers, network conditions, and user groups matter most in production?
  3. Do we already collect field performance data for this page?
How do lab performance measurements differ from field measurements? diagram
How to Explain It in an Interview

I would compare the same page in both lab and field measurements.

In the lab, I define a known setup. That includes the browser, device profile, network condition, build, cache state, and measurement window when they matter. I run the same navigation or interaction several times. Because the environment is controlled, the results have lower variation and are easier to reproduce. This makes lab testing useful for comparing builds and finding regressions.

For a page load, I can follow the browser path from navigation to resource discovery, download, JavaScript parsing and execution, rendering, and interactivity. Browser DevTools can show detailed timing and execution evidence. Lighthouse can also provide controlled diagnostic guidance. This deep diagnostic detail is one of the main strengths of laboratory testing.

Field measurement looks at the same page while real users load and interact with it. Their devices, browsers, networks, locations, background activity, and behavior differ. The results therefore have much more variation. That variation is valuable because it can reveal conditions that one controlled setup does not represent.

Population is another difference. A lab run represents the test environment that I selected. It does not represent every user. Field data represents the users who are actually measured, but it can still have population bias. Sampling, instrumentation, consent rules, or missing user groups can affect what the data represents.

The two methods can also expose different regressions. Lab testing is good for finding code, asset, loading, JavaScript, or rendering changes under known conditions. Field data can reveal production problems that appear only on slower devices, weak networks, certain browsers, certain regions, or unusual usage patterns.

The most important conclusion is that lab speed and real user speed are not the same thing. A modern device on a fast controlled network can perform very well while a slower device on a poor network performs badly on the same page. I use lab measurements for repeatable investigation and detailed diagnosis, then field measurements to validate what real users actually experience.

Technical Approach
  1. Choose one page and one navigation or interaction to compare.
  2. Define the laboratory environment, including browser, device profile, network condition, build, cache state, and measurement window when relevant.
  3. Run the same scenario several times so normal variation is visible instead of trusting one result.
  4. Use browser DevTools and controlled diagnostic tools to inspect loading, JavaScript execution, rendering, and interactivity when those areas are relevant.
  5. Collect field measurements for the same page from real users.
  6. Segment field results by useful dimensions such as device class, browser, network quality, or region when the telemetry supports it.
  7. Compare the laboratory evidence with the field evidence. Look for regressions that reproduce in both places and problems that appear only in real conditions.
  8. After a change, repeat the same laboratory scenario and continue checking field data so the real user result is not assumed from the laboratory result alone.
Practical Insights

There is no meaningful algorithmic complexity to calculate for this comparison. The main cost is measurement work. Laboratory testing needs a controlled setup and repeated runs, but it is easier to reproduce and gives detailed evidence. Field monitoring needs browser instrumentation, data collection, sampling, segmentation, and analysis across many users. Field data is harder to reproduce because real conditions vary. Using both costs more than using only one method, but each covers an important limitation of the other.

Why Interviewers Ask This

Interviewers ask this to see whether I understand that controlled lab measurements and field measurements answer different questions. They want to know whether I can reproduce the same page in a known environment, use detailed browser diagnostics, understand actual user experience across many devices and networks, recognize population bias, and avoid treating one fast laboratory result as proof of good production performance.

Common interview mistakes

Common mistakes include treating one Lighthouse run as proof of production performance, comparing different pages or conditions between measurements, testing only on a fast modern device and network, ignoring slower devices and poor networks, assuming field data has no population bias, using only averages when a distribution is available, expecting field telemetry to provide the same deep diagnostics as browser DevTools, and changing code before measuring where the delay actually occurs. Another mistake is declaring success after the laboratory result improves without checking whether real users also receive a better experience.

Interview tip

Start with the main difference: lab data gives a controlled and repeatable view, while field data gives a variable real user view. Then compare environment, variability, diagnostics, population, and the kinds of regressions each method can reveal. Finish by explaining that a fast lab result describes only the chosen setup, so field data is still needed to validate actual user experience.

Interviewer may ask next
What would you do if the laboratory test is consistently fast but field measurements show that some users still have a slow experience?

I would treat that as evidence that the controlled setup does not represent all real user conditions. For the same page, the laboratory boundary covers my chosen browser, device profile, network condition, build, and cache state. The field boundary covers real devices, browsers, networks, locations, background activity, and user behavior. I would segment the field data to find where the slow experience is concentrated, then reproduce those conditions in the laboratory when possible. This matters because a fast controlled run does not prove that slower devices or networks behave the same way.

Why not use only field measurements if they represent real users?

I would not use field measurements alone because they show real user impact but usually provide less controlled and less detailed diagnostic evidence. For the same page, field data can show which users or environments are slow, while a repeatable laboratory scenario can help isolate whether the delay comes from loading, JavaScript execution, rendering, or interactivity. The tradeoff is that the laboratory represents only the environment I configured, while field data covers a broader population but has more variation and may contain sampling or instrumentation bias. I use both because they answer complementary questions.

89. Design privacy-conscious real-user monitoring for Core Web Vitals and custom interactions.PerformanceHard

Question Details

Design a browser-side measurement plan for a multi-route application that records LCP, INP, CLS, navigation timing, route identity, release version, and two named business interactions. Specify which PerformanceObserver entry types are consumed, how buffered entries and page lifecycle events are handled, how values are attributed without capturing user content, how sampling and batching work, and what is sent when a page is hidden. Define aggregation by percentile and a validation method against browser tooling, including unsupported-browser behavior.

Short Interview Answer (30-60 seconds)

I would measure real users in the browser with PerformanceObserver and the Performance API. I would collect LCP, INP, CLS, navigation timing, the active route template, release version, and the named add_to_cart and checkout_start interactions. I would keep only privacy safe attributes, sample deterministically once per session, batch records in bounded memory, and flush the final unsent batch when the page becomes hidden. I would aggregate by route, release, and device class using p50, p75, and p95, then validate raw entries with browser tools. The main tradeoff is collecting enough detail for diagnosis without collecting user content or adding too much measurement overhead.

Detailed Explanation

This design measures how real people experience the application while protecting their content. It records when the main content appears, how quickly the page responds to input, whether the layout moves unexpectedly, and how long document navigation takes. It also measures two important actions, add_to_cart and checkout_start. Each record uses a safe route pattern and release version instead of personal information. Only a selected set of sessions is measured. Records are grouped in memory, sent when needed, summarized with percentiles, and checked against browser tools before the data is trusted.

Useful Questions to Ask the Interviewer
  1. Should every route use the same sampling rate, or can important routes use a higher rate?
  2. Which route templates and release fields are already available in the frontend?
  3. Should add_to_cart and checkout_start end after the next visible result, as shown in the approved design?
  4. Which browsers must provide the full metric set, and which browsers may report a reduced set?
Design privacy-conscious real-user monitoring for Core Web Vitals and custom interactions. diagram
How to Explain It in an Interview

I would start with the exact user experience we need to measure. For page experience, I would collect LCP, INP, CLS, and document navigation timing. For business experience, I would collect add_to_cart and checkout_start. The browser is the measurement boundary. The collector is an external destination for finished records, not part of the browser performance model.

For PerformanceObserver, I would consume largest contentful paint entries, event entries for INP, layout shift entries for CLS, navigation entries, and measure entries for the two custom interactions. I would request buffered entries where that entry type and browser support it so early observations are not missed. For LCP, I would keep the latest valid candidate until the metric is finalized. For CLS, I would use layout shift entries without recent user input and apply the CLS session window calculation rather than treating every shift across the whole page lifetime as one total. For INP, I would use PerformanceEventTiming interaction entries and derive the interaction latency according to the browser metric rules.

Navigation Timing gives document level values such as TTFB, DOMContentLoaded, and load event end. In a multi route application, the route template identifies the active application route, but a client route change does not magically create a new document Navigation Timing entry. I would keep that distinction clear when analyzing route data. The diagram also shows Resource Timing as optional loading context. If I use it, I would keep only safe timing and size information and would not send full resource URLs.

The two business interactions use performance.mark() and performance.measure(). I would place a start mark when the user begins add_to_cart or checkout_start. I would place the end mark after the visible result is produced, then store the measured duration under that fixed interaction name. I would never store button text, form values, selectors, element text, query strings, or other user content.

Each record would include a route template such as /products/:id, release version, coarse device and viewport information, a random per tab session_id, a sampled flag, metric values, and capability flags. It would not include an account identifier, user identifier, full URL, query string, text value, selector, or element content. This gives enough attribution to compare routes and releases without identifying a person.

Sampling would be deterministic for the whole page session. For example, I can hash session_id and keep about ten percent of sessions. Once a session is selected or rejected, that decision stays stable for that session. Stable sampling avoids changing the population halfway through a page session and makes the resulting distributions easier to reason about.

Selected records go into a small in memory ring buffer. The buffer has a fixed cap so instrumentation cannot grow without limit. I would flush when the batch reaches a chosen record count, when the time since the previous flush reaches a limit, or when document visibility changes to hidden. The primary final flush signal is visibilitychange when the document becomes hidden. pagehide is the fallback lifecycle signal.

When the page becomes hidden, I would send the final unsent batch with navigator.sendBeacon(). If sendBeacon is unavailable, I would use fetch with keepalive set to true. The payload contains only the privacy safe fields shown in the design. Sending must not block navigation or unload. I would also remember that sendBeacon accepting data for queuing is not a guarantee that the collector received it, so the monitoring system should tolerate missing batches.

For reporting, I would group records by route template, release version, device class, and only other coarse dimensions that are safe and useful. I would compute p50, p75, and p95 for LCP, INP, CLS, navigation timings, add_to_cart, and checkout_start. P75 is especially useful for Core Web Vitals, while the other percentiles help show the overall distribution. Percentiles are more useful than one average because a slow group of users remains visible.

For validation, I would run the same local route and interaction scenario in Chrome DevTools Performance. I would compare raw largest contentful paint, layout shift, event, navigation, and measure entries with what the RUM code records. Lighthouse can provide repeatable load diagnostics, but it is not production field evidence. I would compare field distributions with lab results as a trend and consistency check rather than expect exact percentile equality.

Browser support is handled with feature detection. I would test PerformanceObserver and the individual entry types that matter. If one metric is unsupported, I would still collect the supported metrics, keep Navigation Timing and custom marks and measures when available, and include capability flags in the payload. An unsupported metric should be absent rather than reported as zero because zero could look like a genuine measurement. Missing support must never block the page.

The main production tradeoff is diagnostic detail versus privacy, cost, and observer overhead. More dimensions can help analysis, but they increase payload size, cardinality, and privacy risk. A higher sample rate improves confidence, but it increases browser work and collection volume. I would therefore start with the smallest useful schema, stable session sampling, bounded memory, explicit capability flags, and the exact measurements shown in the approved diagram. I would then verify that the instrumentation itself does not materially change the experience it measures.

Technical Approach
  1. Define the browser measurement boundary and the exact metrics: LCP, INP, CLS, navigation timing, add_to_cart, and checkout_start.
  2. Observe largest contentful paint, event, layout shift, navigation, and measure entries. Request buffered entries where that entry type and browser support it.
  3. Derive the final metric values. Keep the latest valid LCP candidate. Apply the CLS session window rule to eligible layout shifts. Derive INP from PerformanceEventTiming interaction entries.
  4. Measure add_to_cart and checkout_start with performance.mark() and performance.measure().
  5. Add only safe attribution: route template, release version, coarse device and viewport data, random per tab session_id, sampled flag, and capability flags.
  6. Choose sessions deterministically, for example about ten percent by hashing session_id, and keep that decision stable for the session.
  7. Store selected records in a bounded in memory ring buffer. Flush by batch size, elapsed time, or hidden page state.
  8. Use visibilitychange to hidden as the primary final flush signal and pagehide as a fallback.
  9. Send the final unsent batch with navigator.sendBeacon(). Use fetch with keepalive when sendBeacon is unavailable.
  10. Group field records by safe dimensions and compute p50, p75, and p95 for each metric.
  11. Validate raw entries with Chrome DevTools Performance and use Lighthouse only as a controlled diagnostic check.
  12. Feature detect browser support, send capability flags, and collect a reduced metric set when some entry types are unavailable.
Practical Insights

The browser work should stay small and bounded. Processing cost grows with the number of performance entries and custom interaction records that are actually collected. Memory stays bounded because the ring buffer has a fixed maximum size. Sampling lowers total collection volume, and batching lowers the number of network sends. The main costs are observer callbacks, small in memory records, serialization, payload bytes, browser support logic, and maintenance. A larger sample improves confidence but costs more browser and collection capacity. More attribution fields may help diagnosis, but they increase payload size, data cardinality, and privacy risk.

Why Interviewers Ask This

Interviewers ask this to see whether you can design browser measurement that is useful, private, reliable, and cheap enough to run for real users. They want to know if you understand Core Web Vitals, PerformanceObserver, the Performance API, page lifecycle events, safe attribution, deterministic sampling, bounded batching, percentile reporting, browser support limits, and validation with browser tools. They also want to see whether you can separate field evidence from controlled lab checks without collecting user content.

Common interview mistakes

Common mistakes include collecting full URLs, query strings, text values, selectors, or account identifiers when a route template and named interaction are enough. Another mistake is changing the sampling decision during one session, which can bias the population. Do not rely only on beforeunload for delivery. Do not treat sendBeacon queue acceptance as proof of delivery. Do not report unsupported metrics as zero. Do not calculate CLS by simply adding every layout shift for the entire page lifetime. Do not treat Lighthouse as production proof or expect one lab run to equal field percentiles. Do not use only averages when the slow part of the distribution matters. Do not allow the in memory buffer to grow without a cap. Finally, do not add so much instrumentation that the monitoring code changes the performance it is trying to observe.

Interview tip

Explain the design in one path: collect, attribute safely, sample, batch, send on hidden, aggregate by percentile, validate, then handle missing browser support. Name add_to_cart and checkout_start, the route template, and the exact privacy boundary. Make it clear that field data shows real user distributions while DevTools and Lighthouse help reproduce and validate controlled cases.

Interviewer may ask next
What if field p75 for INP is poor, but your local DevTools run looks fast?

I would not conclude that the field data is wrong. The exact workload is INP for real interactions on the measured route templates, while the local DevTools run is only one controlled browser scenario. I would first confirm that PerformanceEventTiming entries and interaction attribution match in DevTools. Then I would segment field results by route, release, and device class. The slow field tail may come from devices, interaction patterns, or main thread work that the local scenario does not reproduce. The tradeoff is that more segmentation can reveal the cause, but it also creates smaller sample groups and higher analysis cardinality.

How would you change the design if traffic grows enough that sampling ten percent of sessions becomes too expensive?

I would keep the same browser measurement boundary, metric definitions, privacy rules, and bounded batching, then lower the deterministic session sample for very high traffic groups. I would keep the sampling decision stable for each session and compare percentile stability before and after the change for LCP, INP, CLS, add_to_cart, and checkout_start. Important low traffic routes could keep a higher sample while very busy routes use a lower rate. The tradeoff is lower collection cost versus less statistical confidence in small groups, so I would change the rate only after checking sample volume and percentile stability.

90. How is Largest Contentful Paint interpreted and investigated?PerformanceEasy

Question Details

A landing page's main visual content is a hero image followed by a heading. Explain how a browser identifies an LCP candidate, why the candidate can change while the page loads, and what timing information you would inspect before deciding whether the bottleneck is resource discovery, download, rendering delay, or server response. Keep the discussion focused on browser rendering and page resources.

Short Interview Answer (30-60 seconds)

I would first identify the element reported as the Largest Contentful Paint candidate and measure the page from navigation start to its render time. On this landing page, the heading can be an early candidate, then the hero image can replace it when the image becomes the larger eligible visible element. I would separate the result into document TTFB, resource load delay, resource load duration, and element render delay. Then I would optimize only the phase that is actually slow. For example, earlier image discovery can help when discovery is late, but giving too many resources high priority can create competition.

Detailed Explanation

The page may show the heading before the large picture is ready. At that moment, the heading can be the biggest eligible visible part of the page. Later, the hero picture appears and may become larger than the heading. The browser can then report the hero picture as a new candidate. To understand why the final result is slow, I would look at when the first page data arrives, when the picture starts loading, how long the picture takes to arrive, and how long the browser waits before showing it.

Useful Questions to Ask the Interviewer
  1. Are we investigating real user data, a controlled browser test, or both?
  2. Is the hero image expected to become the final largest eligible visible element at the tested viewport size?
  3. Should I keep the same browser, device class, network condition, build, cache state, route, and viewport for each comparison?
How is Largest Contentful Paint interpreted and investigated? diagram
How to Explain It in an Interview

Largest Contentful Paint measures the render time of the latest largest eligible content element reported in the viewport. On this landing page, the heading can be an early candidate because it renders before the hero image. When the larger hero image renders, the browser can report it as a new LCP candidate. In this example, the hero image remains the final candidate.

I would measure one representative page load from navigation start through the final LCP timestamp. I would keep the browser, device class, network condition, production build, cache state, viewport, and route consistent. I would use field data to understand what real users experience and a controlled browser run to reproduce the case. I would not treat one local run or one diagnostic score as final proof.

I would then divide the observed LCP time into the same four timing areas shown in the diagram.

First is document TTFB. Navigation Timing lets me inspect navigation start to responseStart. This is the browser observed time until the first byte of the document response arrives. It can include connection, network, and server waiting time, so it does not prove how much time was spent inside the server. I treat the remote server as an external timing boundary.

Second is resource load delay. I compare the document responseStart with the LCP resource requestStart. If the hero image request begins much later, the browser discovered or prioritized the resource late. DevTools Network, Resource Timing, and the page markup help show when the request began and how the image became discoverable.

Third is resource load duration. I inspect the hero image from requestStart to responseEnd. A long interval here means the image itself takes a long time to transfer. Possible frontend causes include an unnecessarily large image, an unsuitable image format, weak caching behavior, or delivery conditions that make the resource slow. I would use the actual request timing before calling download the bottleneck.

Fourth is element render delay. I compare the hero image responseEnd with the LCP timestamp. If the image has finished downloading but LCP occurs much later, the problem is after the resource arrives. I would use the browser Performance trace to inspect JavaScript work on the main thread, style calculation, layout, paint, image decoding, font dependencies, or other rendering work that prevents the hero image from appearing sooner.

The optimization must match the measured phase. If resource discovery is late, I might make the hero image discoverable earlier in the initial HTML, use preload when justified, or give the true LCP image appropriate fetch priority. If resource load duration is large, I would reduce the image transfer cost. If element render delay is large, I would reduce the measured work that blocks rendering. If document TTFB is the largest phase, the browser evidence tells me that the delay occurs before the document response begins, but I would not invent an internal server cause from frontend timing alone.

Each change has a tradeoff. Preloading or raising priority can make one resource start sooner, but it can also compete with CSS, fonts, scripts, or other images. Image changes can affect visual quality, responsive behavior, caching, and maintenance. Removing JavaScript or rendering work can affect page behavior if done carelessly.

After the change, I would repeat the same page load under the same conditions and compare the same four timing areas. I would confirm that the correct hero image and heading still appear, responsive images still select the right source, keyboard and screen reader behavior is unchanged, and other important resources did not become slower. In production, I would continue watching field LCP distributions because a controlled browser test cannot represent every real device and network condition.

Technical Approach
  1. Define the exact landing page, route, viewport, browser, device class, network condition, build, cache state, and measurement window.
  2. Capture a baseline LCP value and identify the element reported as the current LCP candidate.
  3. Confirm whether the heading appears first and whether the larger hero image later becomes the new LCP candidate.
  4. Use Navigation Timing to inspect navigation start to responseStart for the document TTFB boundary.
  5. Use DevTools Network and Resource Timing to compare document responseStart with the hero image requestStart. A large gap indicates resource load delay.
  6. Measure the hero image from requestStart to responseEnd. A large interval indicates resource load duration.
  7. Compare the hero image responseEnd with the LCP timestamp. A large interval indicates element render delay.
  8. Use a Performance trace when render delay is large so you can inspect JavaScript work, style calculation, layout, paint, image decoding, and other rendering activity.
  9. Choose one change that directly addresses the measured slow phase.
  10. Repeat the same scenario and compare the same timing boundaries before and after the change.
  11. Verify visual correctness, responsive image behavior, accessibility, supported browsers, and the timing of other important resources.
  12. Confirm with field data that the improvement also appears for real users and that the bottleneck did not move to another phase.
Practical Insights

There is little algorithmic cost because this is mainly a measurement and diagnosis process. Detailed browser tracing does add recording overhead, so I would use it for controlled diagnosis rather than assume it is free. Field telemetry adds implementation and maintenance work, but it gives evidence from real users. Changes such as preload or higher fetch priority also have a cost because one resource can compete with CSS, fonts, scripts, or other images. Image changes can affect quality, memory use, caching, and maintenance. The safest approach is to change only the phase that measurements show is slow, then test the same workload again.

Why Interviewers Ask This

Interviewers ask this to see whether I understand what Largest Contentful Paint represents and whether I can diagnose a slow result from evidence instead of guessing. They want to see that I can follow the page from the initial document response through resource discovery, download, JavaScript work, and rendering, understand why the reported candidate can change, choose the right browser timing evidence, and make an optimization only after identifying the slow phase.

Common interview mistakes

Common mistakes include treating the first visible element as the final LCP candidate, assuming the hero image is always the candidate without checking the reported entry, and forgetting that a larger eligible element can replace an earlier candidate. Another mistake is looking only at the total LCP value instead of separating document TTFB, resource load delay, resource load duration, and element render delay. Developers may blame the network even when the image has already finished downloading and the real delay is rendering. Other mistakes include preloading before proving discovery is late, giving too many resources high priority, treating TTFB as pure server processing time, comparing different device or cache conditions, using one local run as proof, and improving the metric without checking correctness and accessibility.

Interview tip

Explain LCP as a measured sequence instead of one mysterious number. Start with the candidate, show how the heading can be replaced by the larger hero image, then walk through document TTFB, resource load delay, resource load duration, and element render delay. Finish by saying that the optimization must match the measured slow phase and that you would verify the same page under the same conditions afterward.

Interviewer may ask next
What if the hero image downloads quickly but LCP is still late?

I would not call that a download problem. For this landing page, I would compare the hero image responseEnd with the LCP timestamp. If that interval is large, the evidence points to element render delay. I would use a browser Performance trace to inspect JavaScript work on the main thread, style calculation, layout, paint, image decoding, font dependencies, or other work that happens after the resource arrives but before it becomes visible. This matters because reducing transfer size would not address the measured delay. Any change must still preserve layout, visual correctness, accessibility, and required page behavior.

Would you always preload the hero image to improve LCP?

No. I would preload the hero image only when this exact landing page shows meaningful resource load delay because the LCP image starts too late. The measurement boundary is the same controlled page load, especially the interval between document responseStart and the hero image requestStart. Preload can make the request begin earlier, but it can also create competition with CSS, fonts, scripts, or other images and can waste bandwidth when the wrong image is selected for a viewport. I would first confirm discovery is the bottleneck, apply the change, repeat the same test, and then watch production LCP to verify that the improvement holds.

More questions load as you scroll

Disclaimer: This interview guide is for educational and informational purposes only. It is designed to help readers prepare, but it does not guarantee any interview result, hiring decision, offer, or outcome. Interview questions, hiring criteria, and preferred answers can vary by employer, interviewer, industry, location, and time. The examples and explanations reflect the authors' research and judgment, are provided without warranties of any kind, and should not be treated as the only correct approach. Diagrams are simplified illustrations intended to highlight the main components and their interactions; actual systems and implementations may be more complex. Alternative approaches may be equally valid or better suited to a particular question, context, or interviewer. To the fullest extent permitted by applicable law, the author, contributors, and publisher are not liable for decisions made, actions taken, or losses incurred based on this guide.

Content Accuracy and Verification: To the fullest extent permitted by applicable law, we do not represent or warrant that interview guides, questions, answers, examples, or diagrams are accurate, complete, current, error-free, or suitable for any particular purpose. You are responsible for independently reviewing and verifying the information before relying on it.