This interview guide is for educational and informational purposes only. It is designed to help readers prepare, but it does not guarantee any interview result, hiring decision, offer, or outcome. Interview questions, hiring criteria, and preferred answers can vary by employer, interviewer, industry, location, and time. All answers, examples, and explanations in this guide are suggested examples for interview preparation, not definitive answers or instructions for professional practice. They are based on research and judgment, are provided without warranties of any kind, and should be adapted to the question, role, and applicable laws and professional requirements. Diagrams are simplified illustrations intended to highlight the main concepts and their relationships; actual situations, systems, and practices may be more complex. Alternative approaches may be equally valid or better suited to a particular question, context, or interviewer. To the fullest extent permitted by applicable law, the contributors and publisher are not liable for decisions made, actions taken, or losses incurred based on this guide.
State Laws and Professional Responsibilities
Laws and requirements governing an occupation vary by state and jurisdiction. You are responsible for checking the current laws, licensing requirements, and scope-of-practice rules that apply to your location and role, and for ensuring that your answers and actions comply with them. Adapt examples in this guide to those requirements. This guide is not legal advice.
Identity, Image, and Privacy Notice
To respect individual privacy, some names, profile photographs, avatars, biographical details, and other identifying information displayed in this guide may be replaced with pseudonyms, licensed stock images, illustrative avatars, composite images, or representative descriptions. Unless a person is expressly identified as an actual contributor, a displayed name, image, or profile should not be understood as depicting or identifying a specific candidate, interviewer, employee, or other real individual. These representations are provided for editorial and illustrative purposes only and do not imply endorsement, employment, participation, or affiliation with this guide or any company mentioned in it. Any resemblance to an actual person is coincidental.
Company Notice
This guide is an independent educational resource and is not affiliated with, endorsed by, sponsored by, or approved by the company named in this guide. Company names identify reported interview experiences or the employer context of clearly labeled original practice exercises. Interview practices can change without notice, and inclusion of company-specific content does not mean these questions are official, complete, or guaranteed to be asked. To the fullest extent permitted by law, the author, contributors, and publisher are not responsible for outcomes related to use of this material.
Content Accuracy and Verification
To the fullest extent permitted by applicable law, we do not represent or warrant that interview guides, questions, answers, examples, or diagrams are accurate, complete, current, error-free, or suitable for any particular purpose. You are responsible for independently reviewing and verifying the information before relying on it.
Questions or comments?
Contact us for general questions, or share feedback, technical corrections, and comments with the community.
91. How would you diagnose a slow LCP hero image from a network waterfall?PerformanceMedium
i Question Details
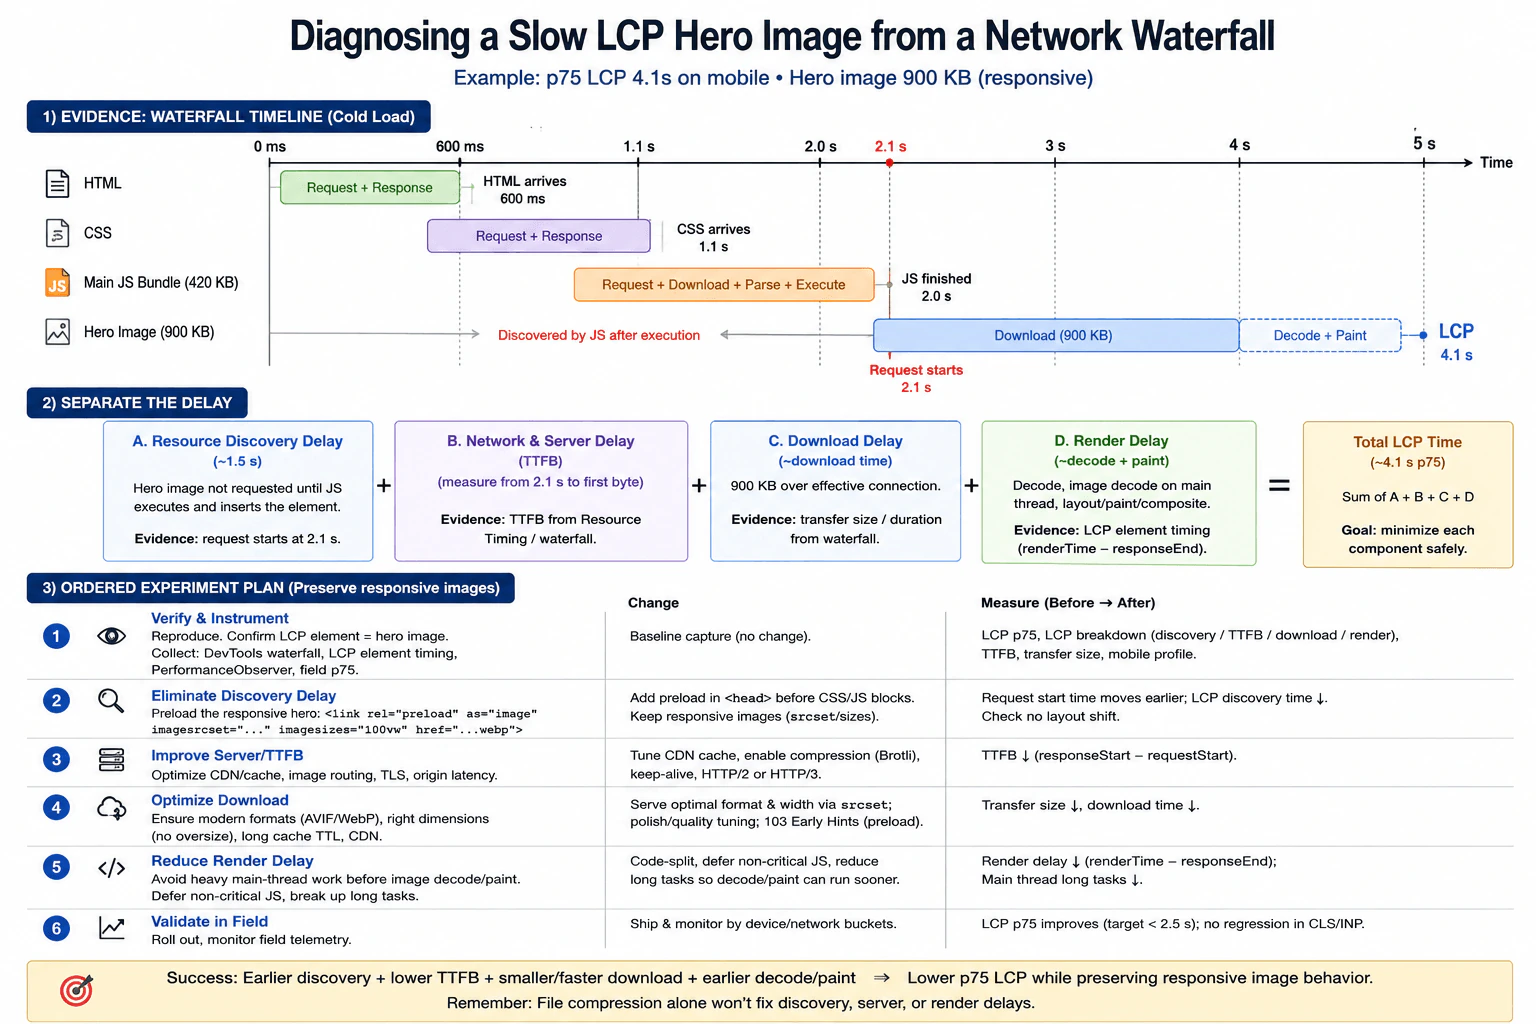
A product page has a p75 LCP of 4.1 seconds on mobile field data. The LCP element is a 900 KB hero image inserted by a stylesheet-backed component after the main JavaScript bundle executes. In a cold-load trace, HTML arrives at 600 ms, CSS at 1.1 s, the 420 KB script finishes at 2.0 s, and the hero request starts at 2.1 s. Describe the evidence you would collect, separate resource discovery, download, server, and render delay, and propose an ordered experiment plan with before-and-after measurements. Preserve the responsive image behavior and do not assume that simply compressing the file addresses the full delay.
Short Interview Answer (30-60 seconds)
I would start by measuring where the 4.1 second LCP is spent. The strongest clue is that HTML arrives at 600 ms, CSS at 1.1 seconds, JavaScript finishes at 2.0 seconds, and the 900 KB hero request does not start until 2.1 seconds. That shows a large discovery delay before the image even begins loading. I would use the network waterfall, Resource Timing, LCP observation, and a Performance trace when needed to separate discovery, TTFB, download, and render delay. I would test earlier responsive discovery first, then server wait, transfer size, and render work, and compare the same mobile cold load before and after each change.
Detailed Explanation
The page feels slow because its large main picture appears much later than the rest of the page. Real mobile data shows that this picture is visible at about 4.1 seconds for the slower group of users. The page itself starts arriving much earlier, but the picture is not requested until after the main script has finished. So a large part of the wait happens before the picture download even starts. I would measure each part of that wait, test one change at a time, and repeat the same mobile test after every change.
Useful Questions to Ask the Interviewer
Should the mobile field p75 LCP remain the main success metric?
Can I reproduce the product page with a cold cache and a representative mobile network profile?
Must the current responsive image selection and layout behavior stay unchanged?
Is the hero always the LCP element on this route for the mobile viewport being measured?
How to Explain It in an Interview
I would begin with the user visible symptom. Mobile field data shows a p75 LCP of 4.1 seconds, and the LCP element is the 900 KB hero image. I would use field data to understand real users, then reproduce the same product page with a cold cache, the production build, a representative mobile device class, and a representative mobile network profile. The controlled trace is for diagnosis. The field p75 is the production result that matters.
The waterfall gives the first strong clue. HTML arrives at 600 ms. CSS arrives at 1.1 seconds. The 420 KB main JavaScript bundle finishes at 2.0 seconds. The hero request starts at 2.1 seconds. The stylesheet backed component inserts the image only after JavaScript finishes, so the browser discovers the critical image very late. From HTML arrival at 600 ms to the hero request at 2.1 seconds, the diagram shows about 1.5 seconds of discovery delay. This is the first bottleneck to test.
I would separate the LCP path into four measured parts. First is resource discovery delay, which is the time before the browser starts the hero request. Second is server wait, measured as TTFB for that image request. I treat that as an external timing boundary. Third is download time, measured from the resource timing entry and transfer size. Fourth is render delay, measured from response end until the image becomes the LCP element, including decode and the browser work needed for layout, paint, and compositing.
For evidence, I would collect the DevTools network waterfall, Resource Timing for the hero request, LCP entries through PerformanceObserver where supported, field p75 data, and a Performance trace if I need to inspect decode work or long main thread tasks around layout and paint. I would confirm that the same hero image is the LCP element and that its request really begins only after the component appears.
My first experiment would remove the discovery delay. I would preload the responsive hero in the document head before CSS or JavaScript can block discovery, using a preload that matches the image source set and sizes rules. Another valid change is to expose the hero URL in markup early enough for the browser to discover it without waiting for the main bundle. I would keep the responsive image behavior so each viewport still receives the correct candidate.
After that, I would measure TTFB for the hero as its own external wait. If that part is meaningful, I would test external delivery changes such as CDN cache behavior, image routing, connection reuse, TLS setup, and HTTP 2 or HTTP 3. I would measure TTFB again rather than assume those changes help. For the image bytes themselves, I would focus on correct dimensions, responsive candidates, and an efficient format such as AVIF or WebP. A smaller file can reduce transfer time, but it cannot remove the original discovery delay.
Finally, I would inspect render delay. If the bytes arrive but the hero still becomes visible late, I would look for image decode cost or long main thread work that delays layout, paint, or compositing. I would test deferring noncritical JavaScript, splitting code, or reducing proven long tasks only when the trace shows that work is delaying the hero.
For every experiment, I would repeat the same page, device class, network profile, production build, and cold cache state. I would compare hero request start time, TTFB, transfer size, download duration, render delay, and LCP before and after. After rollout, I would confirm field p75 moves toward the below 2.5 second goal shown in the diagram, responsive image selection still works, there is no layout shift, and CLS and INP do not regress. I would also verify the image still has the correct accessible text and semantics, and check whether the bottleneck moved to another part of the loading path.
Technical Approach
Define the baseline with mobile field p75 LCP at 4.1 seconds.
Reproduce the same product page with a cold cache, production build, representative mobile device class, and representative mobile network profile.
Confirm that the 900 KB hero image is the LCP element.
Read the waterfall and record HTML at 600 ms, CSS at 1.1 seconds, JavaScript completion at 2.0 seconds, and hero request start at 2.1 seconds.
Separate the path into resource discovery delay, image TTFB, download time, and render delay.
Use Network tools and Resource Timing for request timing. Use PerformanceObserver for LCP and a Performance trace when render work needs investigation.
Test earlier responsive discovery first because the request currently waits for JavaScript completion.
Retest the same scenario and compare request start time and LCP.
If TTFB is meaningful, test delivery and caching changes and measure TTFB again.
Optimize the responsive image transfer with correct dimensions and efficient formats, then measure transfer size and download time.
If render delay remains, trace decode and main thread work and reduce only the work proven to delay visibility.
Validate field p75 after rollout and check responsive behavior, CLS, INP, visual correctness, and whether the bottleneck moved elsewhere.
Practical Insights
The main cost is measurement and maintenance work rather than algorithm complexity. Adding a responsive preload or changing when the hero becomes discoverable adds markup and maintenance responsibility. The preload must match the responsive source set and sizes rules or the browser can fetch an unnecessary image. Image format and dimension changes affect build work, caching, and asset management. Performance tracing also takes investigation time. The safest approach is to change one measured bottleneck at a time, repeat the same mobile cold load, and confirm that the delay did not move into rendering or another resource.
Why Interviewers Ask This
Interviewers ask this to see whether the candidate can read a browser waterfall, separate resource discovery from server wait, download time, and render delay, and then choose changes that match the measured delay. They also want to see disciplined before and after testing, correct use of field data and browser tools, protection of responsive image behavior, and awareness that making the file smaller does not remove a late discovery problem.
Common interview mistakes
Common mistakes are compressing the 900 KB image before proving where the time is lost, treating the full image request as one number instead of separating discovery, TTFB, transfer, and render delay, using one local run as production proof, comparing different cache or network conditions before and after, adding a preload that does not match the responsive source set and sizes rules, assuming server wait is the only network problem, ignoring main thread work after the bytes arrive, and declaring success without checking field p75, responsive behavior, CLS, INP, visual correctness, and whether the bottleneck moved elsewhere.
Interview tip
Lead with the measured clue: the hero request starts at 2.1 seconds only after the main JavaScript bundle finishes. Then walk through discovery, TTFB, download, and render delay in that order. Tie each experiment to one measured part, and finish by saying that you would repeat the same mobile cold load and confirm the result in field p75 data.
Interviewer may ask next
What if the hero file becomes much smaller but p75 LCP barely changes?
I would measure the same product page and mobile cold load again instead of assuming the image optimization failed. If the hero still starts near 2.1 seconds, the discovery delay is still present, so the smaller file only reduces transfer time. If the request starts earlier but LCP still finishes late, I would inspect TTFB and render delay next. This matters because reducing one part can expose another part as the new bottleneck.
What tradeoff would you watch when preloading the responsive hero image?
The main tradeoff is fetching the wrong responsive candidate or fetching a resource that is not actually critical. For this 900 KB hero, the preload must match the same source set and sizes rules used by the page. I would compare the same mobile cold load before and after, confirm that the request starts earlier, and verify that transfer size does not increase because of duplicate or incorrect downloads. I would then watch field p75 LCP, CLS, and INP after rollout.
92. What does Interaction to Next Paint reveal about responsiveness?PerformanceEasy
i Question Details
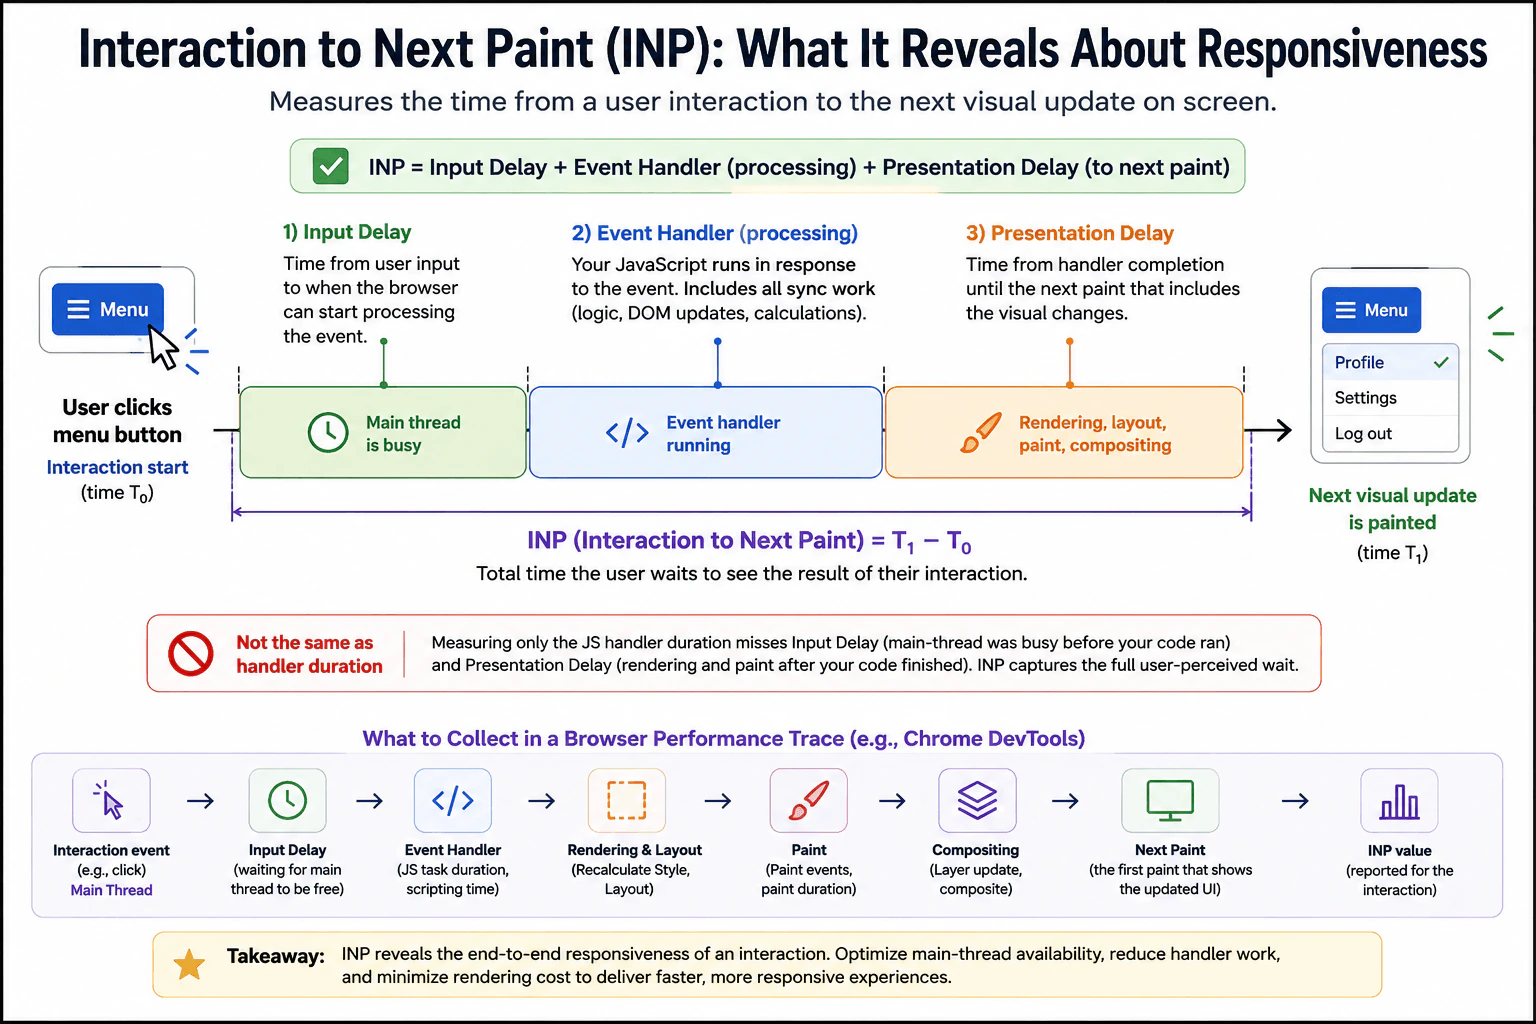
A user clicks a menu button and the visual state changes only after a noticeable pause. Explain what Interaction to Next Paint measures across the interaction, how input delay, event-handler work, and presentation delay contribute, and how it differs from measuring only the JavaScript handler's duration. State what evidence you would collect in a browser performance trace.
Short Interview Answer (30-60 seconds)
Interaction to Next Paint reveals how long users wait for visual feedback after an interaction. For the menu click, I would measure from the input to the next paint that shows the changed menu, then separate that latency into input delay, event handler processing, and presentation delay. Measuring only the JavaScript handler misses time when the main thread is busy before the handler and rendering work after it. I would inspect a browser Performance trace for the interaction event, main thread activity, handler work, style calculation, layout, paint, compositing, and the next paint.
Detailed Explanation
When a person clicks the menu button, the important question is how long they wait before they can see the menu change. The wait can happen in three places. The browser may be busy before it reacts. The click code may take time to run. Then the browser may need more time to prepare and show the new picture. Looking only at the click code can therefore hide part of the delay. I would measure the whole wait and inspect where the time is being spent.
Useful Questions to Ask the Interviewer
Does the pause happen consistently on the same device and browser?
Should I focus on this menu interaction or also consider real user interaction data?
Can I reproduce the issue with the same page state and a production build?
How to Explain It in an Interview
The visible symptom is that the user clicks the menu button and the changed menu appears only after a pause. For this individual interaction, the latency runs from the input at time T0 to the next paint at time T1 that shows the visual result. The diagram represents this as T1 minus T0.
That interaction latency has three important parts. Input delay is the time from the user's input until the browser can start processing it. A busy main thread can make this part large. Event handler processing is the JavaScript that runs because of the click, including synchronous logic, calculations, and DOM updates. Presentation delay is the time from the end of event processing until the next paint. It can include style calculation, layout, paint, compositing, and other rendering work needed to show the updated menu.
This is why handler duration alone is incomplete. A short handler can still feel slow if the main thread was busy before the handler started or if the browser spent a long time producing the next visual update after the handler finished. The full interaction latency captures what the user actually waits for.
I would reproduce the same menu click with a known browser, device condition, page state, production build, and cache state. Then I would record a browser DevTools Performance trace. I would locate the interaction event and inspect the main thread before the handler starts. I would look for long work that caused input delay. Next, I would inspect the handler task and the synchronous JavaScript it triggers. After that, I would inspect style calculation, layout, paint, compositing, and the first paint that shows the updated menu.
The trace tells me which part dominates. If input delay is large, I would investigate other main thread work that blocked the click. If event handler processing is large, I would reduce unnecessary synchronous JavaScript or DOM work. If presentation delay is large, I would investigate expensive style calculation, layout, paint, or compositing caused by the update. I would choose a change only after the trace identifies the expensive stage.
After a change, I would repeat the same interaction under the same conditions. I would compare the full interaction latency and inspect the trace again to confirm that the measured bottleneck became smaller and did not simply move to another stage. I would also verify that the menu still opens correctly, focus behavior remains correct, keyboard interaction works, and the visual result is unchanged.
A local trace explains one reproducible interaction, but it does not represent every real user. Field telemetry can show responsiveness across many real devices and sessions. At the page level, Interaction to Next Paint is derived from the observed interaction latencies during the page visit, with protection against occasional outliers on pages that have many interactions. It is not simply the duration of one JavaScript handler.
Technical Approach
Define the symptom as the delay between clicking the menu button and seeing the changed menu.
Record the same interaction with a known browser, device condition, page state, production build, and cache state.
Mark the input time and the next paint that contains the updated menu.
Measure input delay by checking how long the interaction waited before processing began.
Inspect the event handler and synchronous JavaScript work triggered by the click.
Inspect style calculation, layout, paint, and compositing between handler completion and the visible update.
Classify the dominant delay as input waiting, JavaScript processing, or presentation work based on trace evidence.
Make one targeted change that addresses the measured bottleneck.
Repeat the same interaction under the same conditions and compare the full interaction latency.
Verify menu correctness, focus behavior, keyboard access, visual behavior, supported browsers, and whether the bottleneck moved elsewhere.
Practical Insights
The Performance trace adds some measurement overhead, so I would use it to diagnose the interaction rather than treat one trace as exact production timing. The cost of a fix depends on the measured problem. Reducing unnecessary JavaScript can lower CPU work. Reducing style calculation, layout, paint, or compositing can shorten presentation delay. Larger changes can increase code and maintenance cost. The important rule is to change only the stage that evidence shows is expensive, then repeat the same measurement to confirm the result.
Why Interviewers Ask This
Interviewers ask this to see whether I understand responsiveness from the user's point of view. They want me to separate waiting before JavaScript runs, work done by the event handler, and waiting for the browser to show the result. They also want to know whether I can use a browser performance trace to find the real source of delay instead of looking only at JavaScript execution time.
Common interview mistakes
Common mistakes include measuring only the event handler and calling that the complete interaction delay, ignoring main thread work before the handler, ignoring style calculation, layout, paint, or compositing after the handler, optimizing before recording evidence, comparing different page states before and after a change, treating one local trace as proof for all users, and changing code without checking whether the delay moved to another stage. Another mistake is improving timing while breaking menu focus, keyboard behavior, or the visible result.
Interview tip
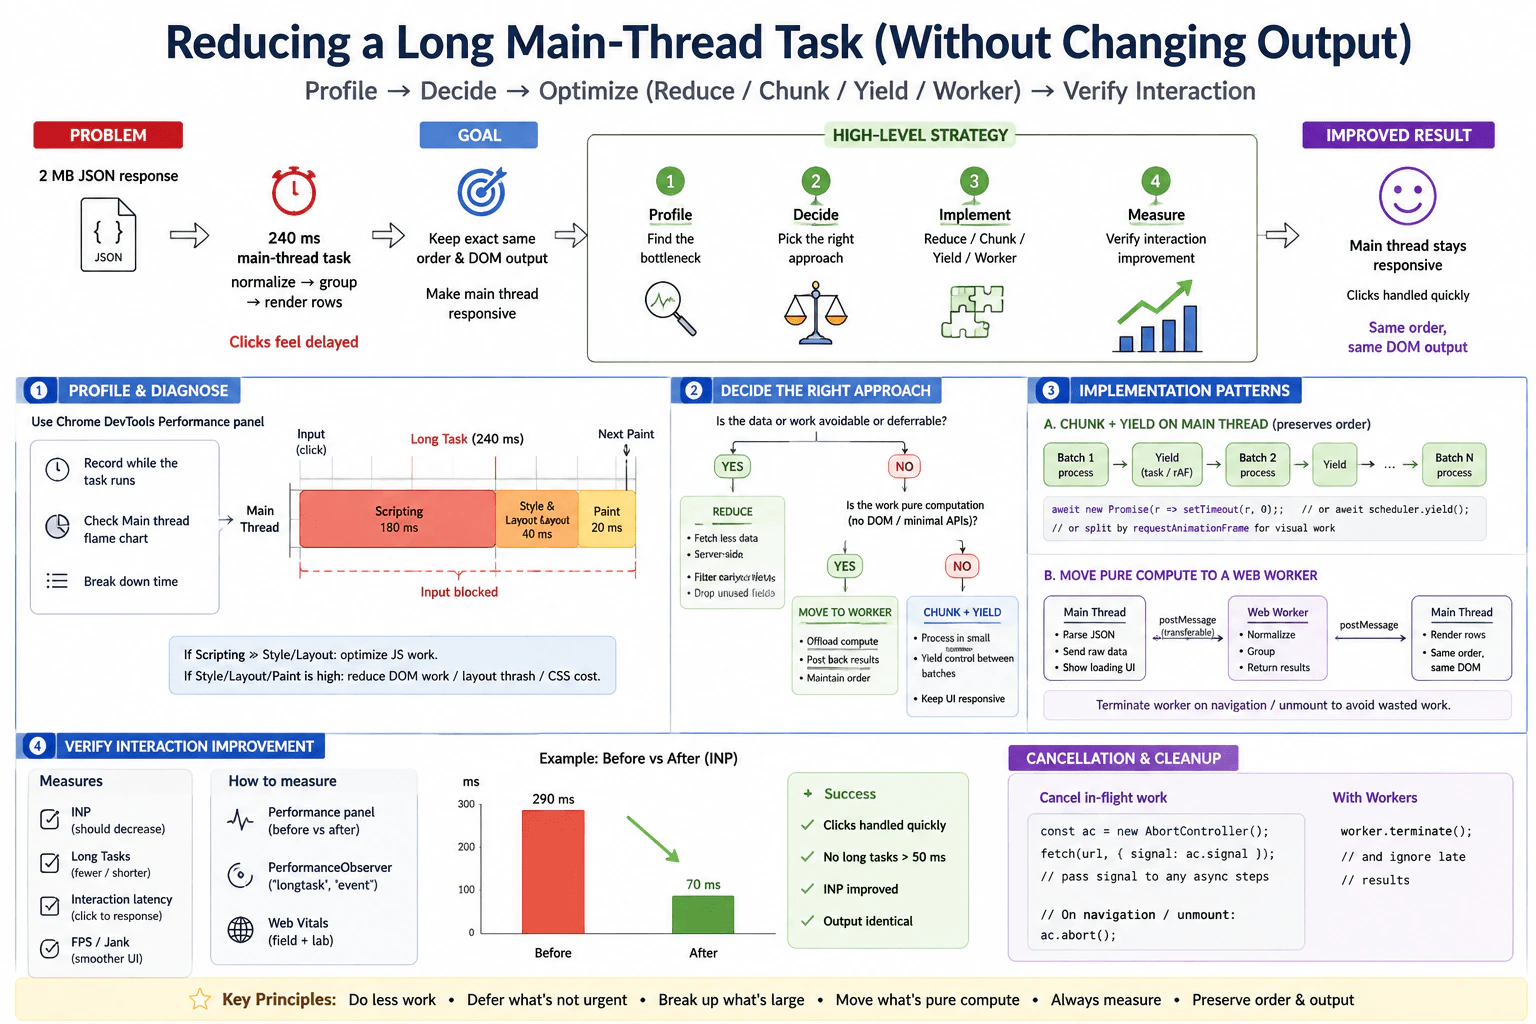
Explain the interaction as one continuous path. Start with the click, then describe input delay, event handler processing, presentation delay, and the next visible paint. Emphasize that handler duration is only one part of what the user experiences. Then name the exact trace evidence you would inspect before proposing a change.
Interviewer may ask next
What if the menu's JavaScript handler takes only a few milliseconds but the interaction still feels slow?
A short handler does not prove that the interaction is responsive. For this menu click, I would keep the measurement boundary from the input event to the next paint that shows the updated menu. I would inspect the Performance trace for main thread work before the handler and rendering work after it. A long input delay can mean the main thread was busy before my code ran. A long presentation delay can mean style calculation, layout, paint, or compositing was expensive after the handler finished. I would optimize the measured slow stage rather than the handler just because it is easy to see.
How would you validate an Interaction to Next Paint improvement before releasing it broadly?
For the same menu interaction, I would repeat the controlled trace with the same browser, device condition, page state, production build, and cache state. I would confirm that the full interaction latency from input to the next visible paint improved and that the delay did not move into another stage. I would test mouse and keyboard behavior, focus handling, visual correctness, and supported browsers. After release, I would use real user field telemetry to watch responsiveness across real devices. The tradeoff is that field data gives realistic distributions, while a local trace gives much more detail about one interaction.
93. How would you investigate poor INP in a searchable product list?PerformanceMedium
i Question Details
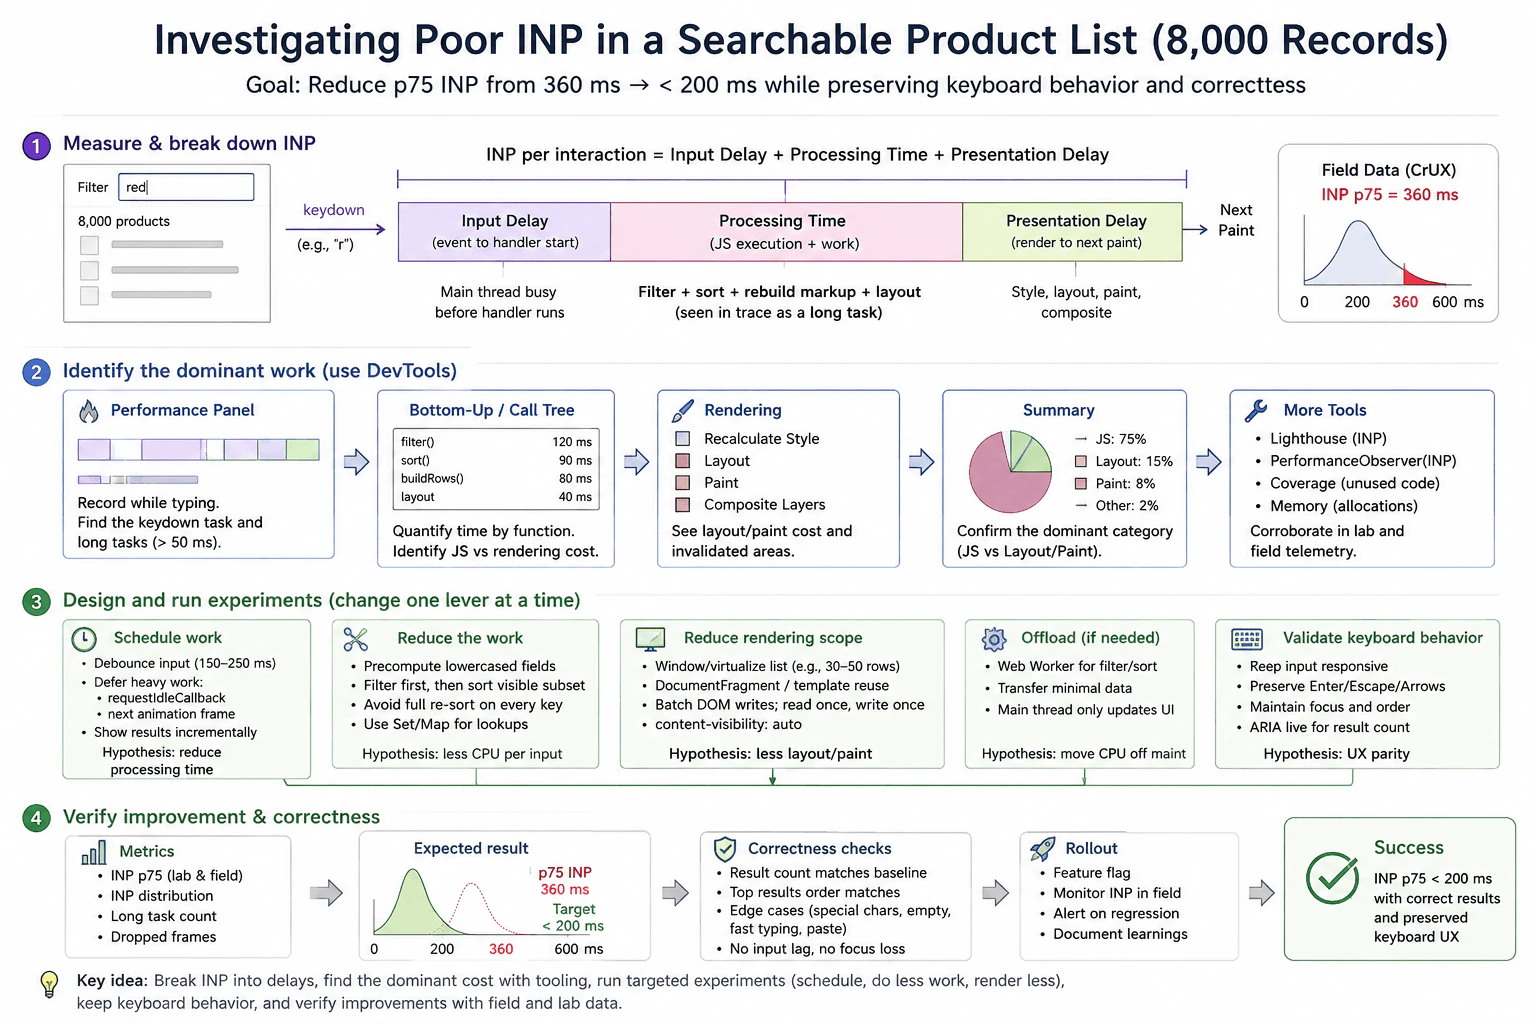
Field data shows p75 INP of 360 ms when users type into a filter box containing 8,000 client-side records. A trace shows a keydown task that filters, sorts, rebuilds result markup, and recalculates layout before the next paint. Explain how you would break down input delay, processing time, and presentation delay; identify the dominant work with browser tooling; and design experiments involving scheduling, reduced work, and rendering scope. State how you would preserve keyboard behavior and verify that results stay correct.
Short Interview Answer (30-60 seconds)
I would start with the p75 INP of 360 ms and reproduce the same typing interaction with 8,000 client side records in the browser Performance panel. I would split the interaction into input delay, processing time, and presentation delay, then inspect the keydown task, Bottom Up view, Call Tree, and rendering work to see whether filtering, sorting, markup rebuilding, or layout dominates. I would test one change at a time, such as doing less work, rendering fewer rows, scheduling nonurgent work, or moving suitable filter and sort work to a Web Worker. I would keep the input responsive, preserve keyboard behavior and focus, compare the same workload before and after, and verify result count, order, edge cases, and field INP.
Detailed Explanation
Users feel a delay while typing into a product search box. The page holds 8,000 items, and each key press causes several large pieces of work before the updated list appears. The current real user result is slow, with p75 INP at 360 ms. I would first find which part of the interaction consumes the most time. Then I would test smaller, safer changes one by one. The goal is to make typing feel immediate while keeping the same results, order, focus, and keyboard controls.
Useful Questions to Ask the Interviewer
Which browsers and device classes show the worst INP for this filter interaction?
Is the current 360 ms p75 measured for the same product list size and typing flow that we can reproduce in the lab?
Must every keystroke immediately update all matching rows, or can nonurgent result work be scheduled while the input stays responsive?
Which keyboard behaviors and accessibility rules must remain unchanged?
How to Explain It in an Interview
I would begin with the user visible symptom: typing into the filter has p75 INP of 360 ms for a list of 8,000 client side records. For this interaction, INP can be understood as input delay plus processing time plus presentation delay. Input delay is the wait before the event handler starts. Processing time is the JavaScript and related work caused by the interaction. Presentation delay is the time from that work finishing until the next visible paint.
I would reproduce the same typing flow with a production build on a representative browser and device class. I would record the interaction in the browser Performance panel. I would find the keydown event and inspect the main thread around it. The trace already tells us that filtering, sorting, rebuilding result markup, and recalculating layout all happen before the next paint, so I would measure how much each part contributes instead of guessing.
I would use Bottom Up and Call Tree views to quantify the expensive JavaScript functions. I would also inspect style calculation, layout, paint, and invalidated rendering areas. The diagram shows JavaScript as the dominant category with layout and paint also contributing. I would treat the percentages and per function durations shown in the diagram as illustrative trace values, not as production facts unless the actual recording reports them. PerformanceObserver can collect supported interaction metrics in runtime telemetry. Lighthouse can provide controlled diagnostic guidance, but I would not use one Lighthouse run as proof of production performance. Field telemetry is the source for real user distributions, while the lab trace is the source for detailed causality.
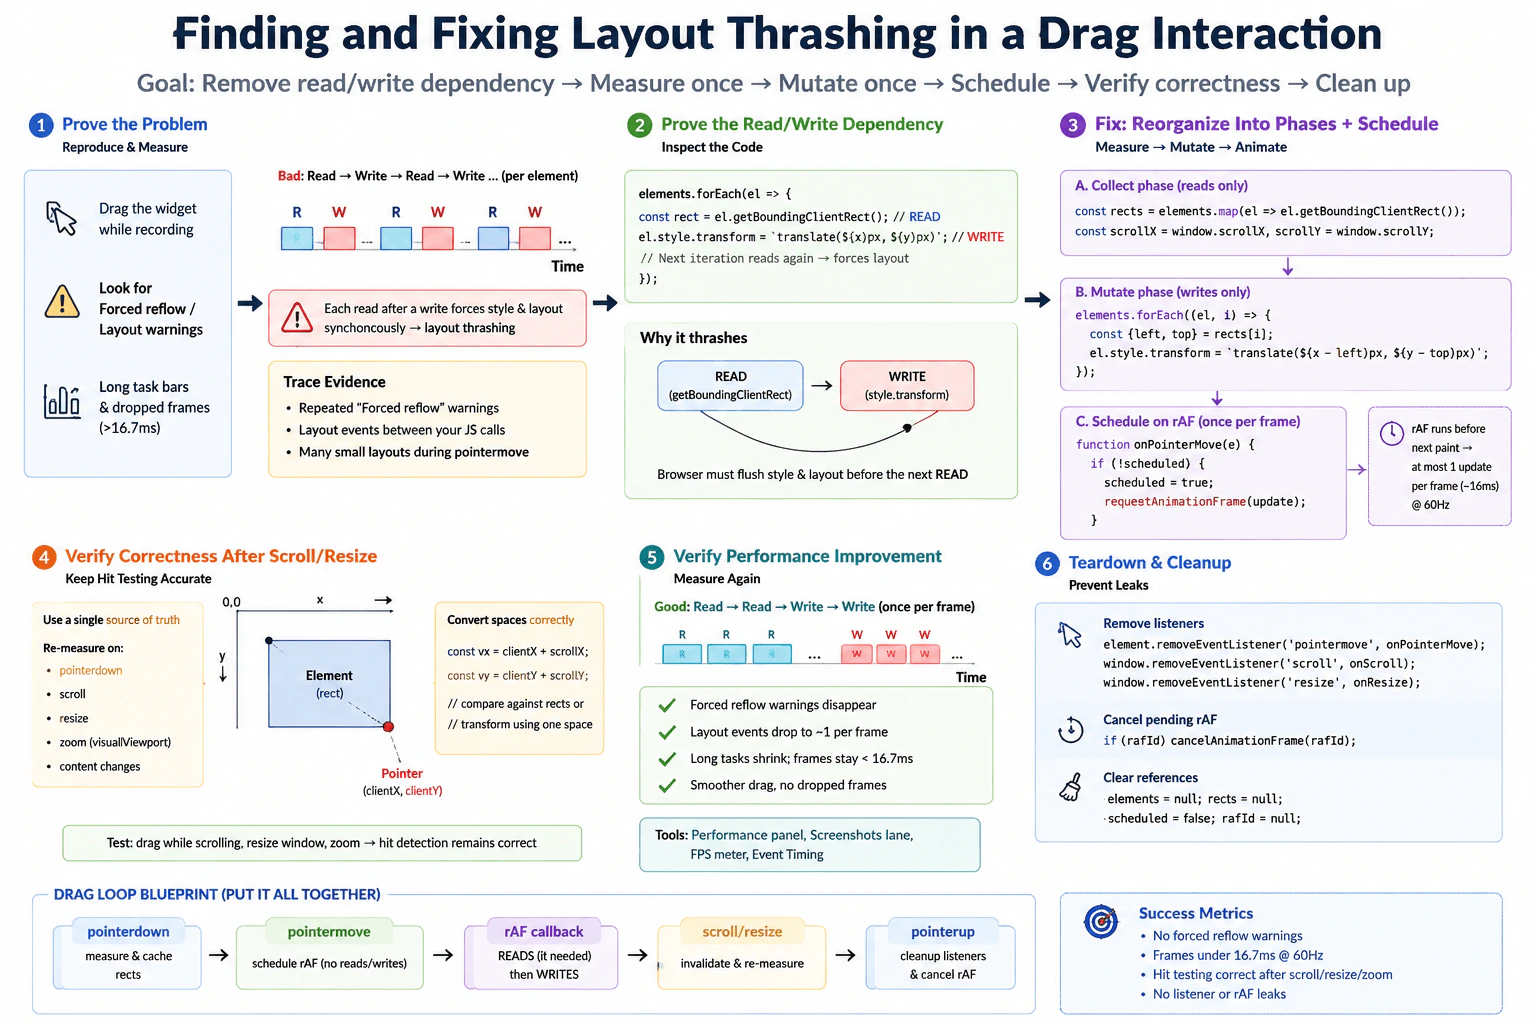
Then I would run controlled experiments, one change at a time. First, I would reduce work per keystroke. I could precompute normalized searchable fields, use a Set or Map for repeated lookups, filter before sorting, avoid a full sort when it is not needed, and cache proven repeated work. Second, I would reduce rendering scope by windowing or virtualizing the result list, limiting the rendered rows, batching DOM writes, reading layout before writing, and using content visibility where it fits the component.
Scheduling can help when work is truly deferrable. Debouncing can reduce repeated searches during rapid typing, but it adds a short delay before results update, so I would test the user experience rather than assume it is better. requestIdleCallback can handle nonurgent work, but idle time is not guaranteed and a fallback may be needed. requestAnimationFrame can coordinate visual updates, but it does not make expensive computation free. If the filter and sort remain CPU heavy after reducing work, I would test a Web Worker for that computation. The worker can return minimal result data while the main thread keeps DOM updates and rendering. I would include worker startup, message transfer, extra memory, cleanup, and maintenance in the tradeoff.
I would preserve keyboard behavior throughout the experiments. The input should keep focus and remain responsive. Enter, Escape, arrow keys, Tab, Home, and End should keep their expected behavior when those controls are part of the component. Result order must remain stable, and screen reader announcements should remain correct. I would verify result count, top result order, special characters, an empty query, fast typing, paste input, and focus behavior.
Finally, I would repeat the same workload before and after each change. I would compare p75 INP, the interaction distribution, long task count, dropped frames, and the trace itself. The diagram uses a target below 200 ms, so I would use that as the desired project target, not as a guaranteed outcome. I would also check that the bottleneck did not move from JavaScript into layout, paint, worker communication, or memory. For material changes, I would use a feature flag when risk justifies it, monitor field INP and errors after release, and roll back if responsiveness or correctness regresses.
Technical Approach
Start with the field symptom. Record that p75 INP is 360 ms for typing into the filter over 8,000 client side records.
Reproduce the same interaction in a controlled browser session using a representative device class, production build, and consistent cache state.
Record the interaction in the browser Performance panel. Find the keydown event and the long main thread task before the next paint.
Split the interaction into input delay, processing time, and presentation delay. This shows whether the user is waiting before JavaScript starts, inside JavaScript and related work, or before the visible paint.
Use Bottom Up and Call Tree to measure filtering, sorting, and result construction. Inspect style calculation, layout, paint, and invalidated areas to measure rendering cost.
Choose one experiment that matches the evidence. Reduce repeated computation first. Then reduce rendering scope with windowing or virtualization. Use scheduling only for work that can safely wait.
If filter and sort remain CPU heavy after reducing work, test a Web Worker. Send only the data needed for computation and return minimal result data. Keep DOM updates on the main thread.
Retest the same typing workload after each change. Compare p75 INP, the interaction distribution, long tasks, dropped frames, and trace shape.
Verify result count, top result order, empty and special queries, fast typing, paste behavior, focus, keyboard controls, and screen reader behavior.
Release cautiously, monitor field INP and errors, and use a feature flag or rollback path for material changes.
Practical Insights
With 8,000 records, scanning every record on every keystroke is roughly O(n) work for filtering. Sorting all matching records can add O(k log k), where k is the number of matches. If the code sorts the full list every time, the practical cost can approach O(n log n) for each input. Rebuilding thousands of DOM rows also creates large rendering and layout costs.
The first goal is to reduce the amount of work, not merely move it. Precomputed search fields use extra memory but reduce repeated string work. Caching can save CPU but needs invalidation when product data changes. Virtualization lowers DOM and layout cost but adds list state and accessibility complexity. A Web Worker can move suitable CPU work away from the main thread, but startup, message transfer, extra memory, cleanup, and maintenance add cost. Profiling itself also has overhead, so before and after comparisons must use the same conditions.
Why Interviewers Ask This
Interviewers ask this to see whether I can start from a real user symptom, split interaction latency into useful parts, use browser evidence to find the dominant cost, and choose a change that matches that evidence. They also want to see whether I understand that JavaScript work and rendering both compete for the browser main thread, that a Web Worker is only useful for suitable computation, and that faster results still need correct keyboard behavior, accessibility, and production verification.
Common interview mistakes
A common mistake is optimizing before measuring which part of INP is slow. Another is treating one local run, one Lighthouse score, or an average as final proof. It is also easy to compare different list sizes or typing patterns before and after a change, which makes the result unreliable.
Another mistake is assuming a Promise moves CPU work off the main thread. It does not. requestAnimationFrame also does not make expensive filtering free. Debouncing can reduce repeated work, but too much delay can make the search feel less responsive. A Web Worker can help with suitable CPU work, but moving filter and sort there does not remove DOM, layout, and paint cost on the main thread.
Another mistake is using Coverage or memory tools as proof of this specific interaction bottleneck without evidence. They can help investigate unused code or allocation problems if the trace points that way, but the Performance panel remains the main tool for this question.
Finally, do not improve the metric by breaking behavior. Result count, result order, focus, keyboard controls, screen reader announcements, paste behavior, and edge cases must remain correct. Also check whether the optimization simply moves the bottleneck from JavaScript to rendering, worker communication, or memory.
Interview tip
Explain the investigation as a chain of evidence. Start with p75 INP of 360 ms, split the interaction into input delay, processing time, and presentation delay, show how the Performance panel finds the dominant work, then connect each experiment to that evidence. Finish by saying that you will compare the same workload before and after and protect correctness, focus, keyboard behavior, accessibility, and field monitoring.
Interviewer may ask next
What if a local trace looks fast after the change, but field p75 INP is still poor?
I would not treat the local trace as proof that the problem is solved. The exact workload is typing into the filter over 8,000 client side records, and the production boundary is the real browser interaction through the next visible paint. I would segment field INP by browser, device class, list size, and interaction path, then reproduce the slow segment in the lab. The local machine may be faster, the production data may create more matches, or the bottleneck may have moved into layout, paint, worker communication, or another main thread task. The tradeoff is that broader telemetry and representative testing take more time, but they prevent us from optimizing only a fast lab case.
When would you move filtering and sorting to a Web Worker instead of only virtualizing the list?
I would use a Web Worker only if profiling shows that filter and sort remain a meaningful CPU cost on the main thread after reducing unnecessary work. For this 8,000 record search, virtualization mainly reduces DOM, layout, and paint work, while a worker targets suitable computation. If both are expensive, they can address different parts of the same interaction. The worker should receive only the data it needs and return minimal result data, because startup, message transfer, extra memory, cleanup, and code complexity are real costs. I would compare the same typing workload before and after and keep all DOM updates, focus behavior, and keyboard handling on the main thread.
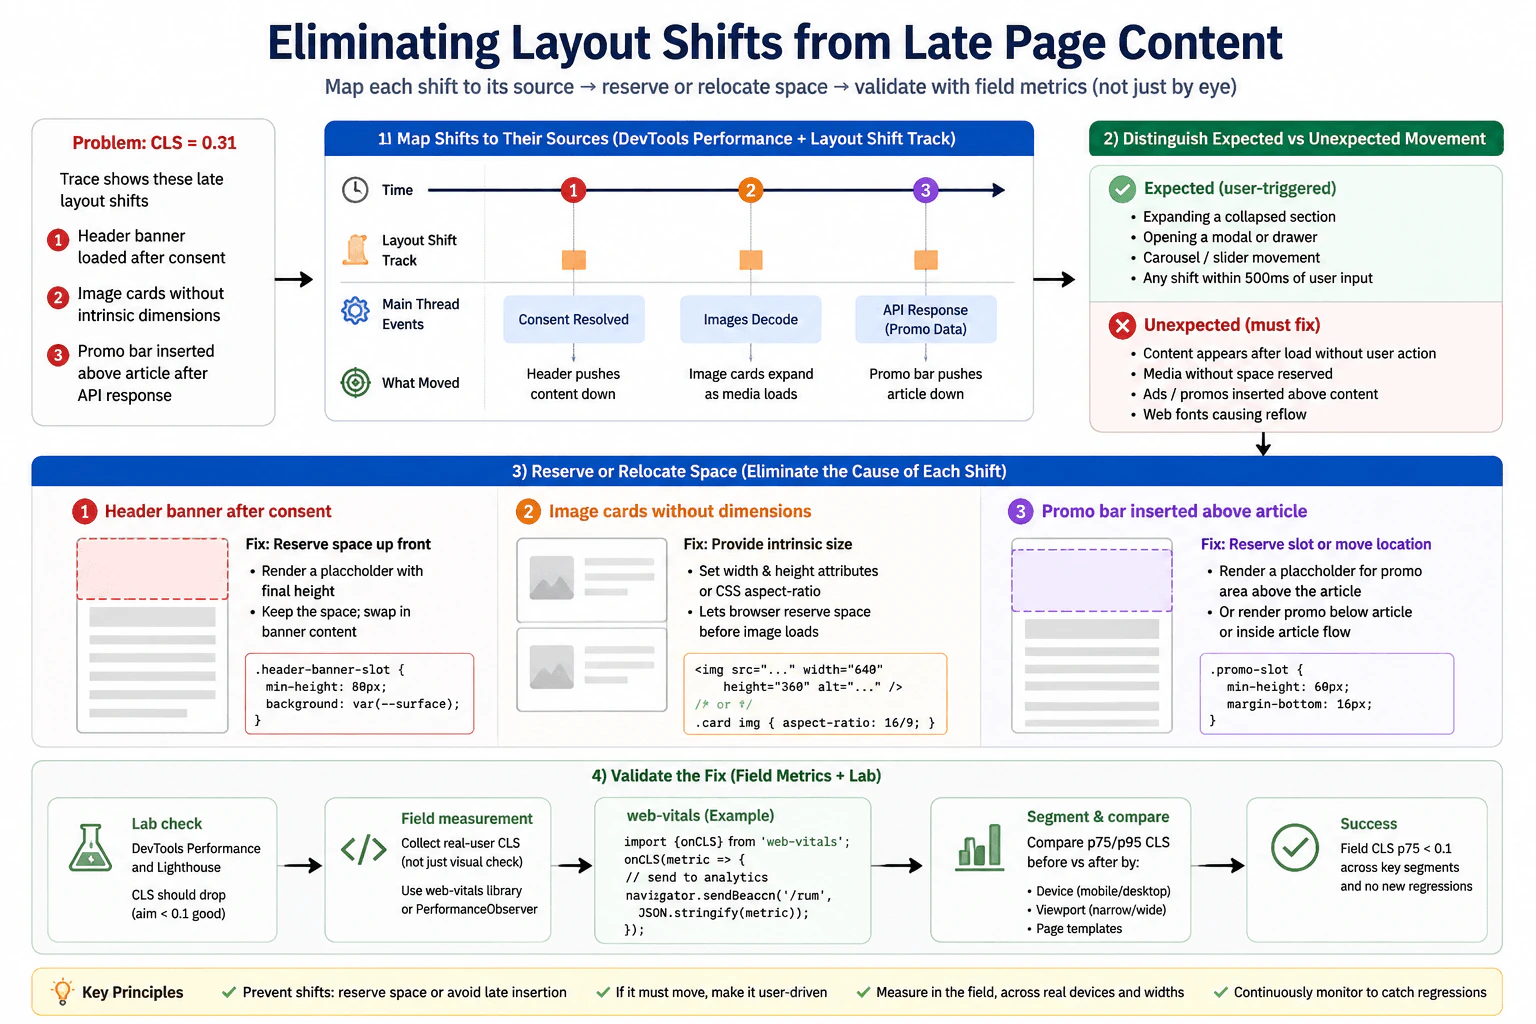
94. What causes Cumulative Layout Shift on a web page?PerformanceEasy
i Question Details
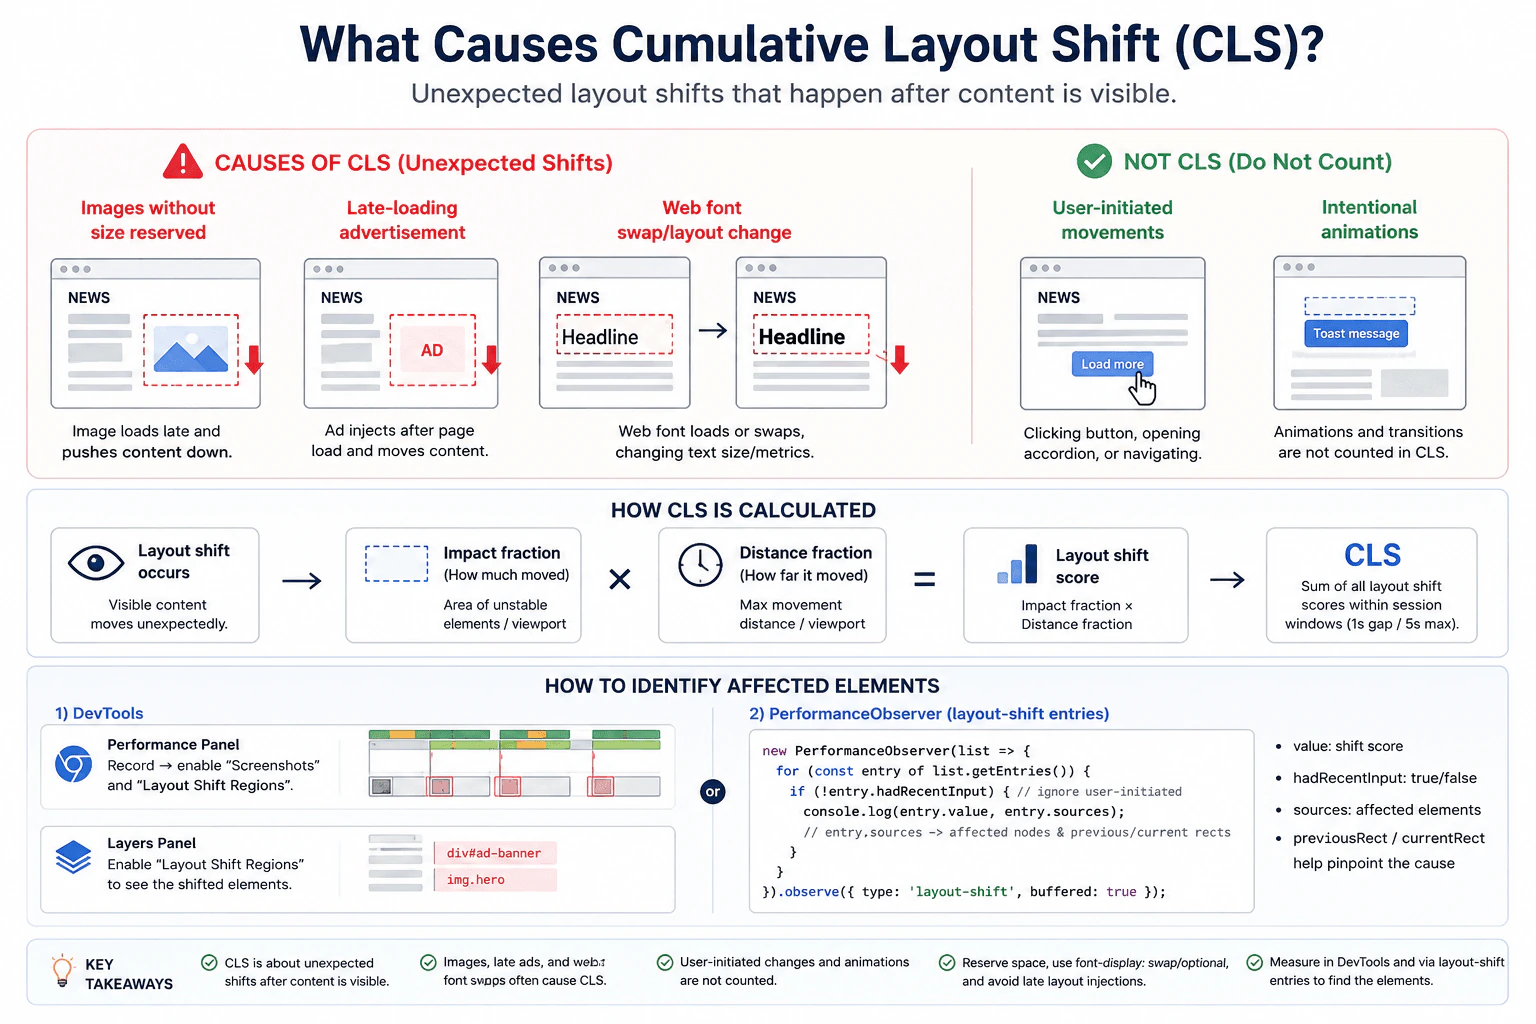
Consider a news page where images, a late-loading advertisement, and a web font can move already-visible content. Explain which unexpected shifts contribute to CLS, which user-initiated movements do not, and what browser tooling or layout-shift entries you would use to identify the affected elements. Do not treat animation smoothness as the same metric.
Short Interview Answer (30-60 seconds)
I would measure unexpected movement of visible content with CLS and inspect the layout shift entries that caused it. Common causes are images without reserved space, advertisements inserted after content is visible, and web font changes that alter text size or wrapping. A shift with recent qualifying user input is normally excluded from CLS. I would use the browser Performance panel or PerformanceObserver to inspect the shift score and affected elements. For each shift, the score uses impact fraction and distance fraction, while CLS uses the largest session window total. I would then reserve stable space or correct the measured source and retest the same page.
Detailed Explanation
CLS tells us whether content that a person can already see suddenly moves when they did not expect it. On a news page, an image may appear and push text down, an advertisement may be inserted above an article, or a new font may change the size and wrapping of a headline. These movements can make people lose their reading position or click the wrong thing. Movement that follows recent qualifying user input is normally excluded. Animation smoothness is a separate concern, so it should not be treated as the same measurement.
Useful Questions to Ask the Interviewer
Should I focus on CLS during the first page load or during the full page lifetime?
Should I explain how to identify the exact elements that moved?
Do you want both browser DevTools and PerformanceObserver explained?
How to Explain It in an Interview
I would start with the user visible symptom. Content that was already visible changes position unexpectedly. The metric is Cumulative Layout Shift, or CLS, which measures visual instability in the browser.
For one layout shift, the browser calculates a score using impact fraction and distance fraction. Impact fraction represents how much of the viewport is affected by unstable content. Distance fraction represents how far that content moved relative to the viewport. The shift score is the product of those two values.
CLS is not simply the sum of every layout shift during the full page lifetime. The browser groups qualifying shifts into session windows. A session window ends after a gap of at least one second without a shift or after five seconds from the first shift in that window. The reported CLS value is the largest total from any session window.
On the news page in this example, an image without reserved dimensions can load after text is visible and push that text downward. A late loading advertisement can be inserted above existing article content and move it. A web font can replace the fallback font with different character measurements, which can change line wrapping and move nearby content. These are examples of unexpected layout movement that can contribute to CLS.
Movement related to recent qualifying user input is handled differently. A LayoutShift entry exposes hadRecentInput. When that value is true, the shift is excluded from CLS. For example, an expected layout change that happens shortly after a supported click or key action should not be treated like an unexpected page shift. Scrolling itself does not create a layout shift just because content moves through the viewport.
Animation smoothness is also a different performance concern. A transform based animation can move pixels without changing layout, so that movement does not create a layout shift. However, an animation that changes layout properties can still create layout shifts. The important distinction is whether layout unexpectedly changes, not whether the animation looks smooth.
For evidence, I would record the same news page in the browser Performance panel and inspect layout shift events or layout shift regions. This shows when shifts happened and helps connect them to visible elements. I can also use PerformanceObserver to collect layout shift entries in JavaScript.
A LayoutShift entry can provide value, hadRecentInput, and sources. Each source can identify an affected node and include previousRect and currentRect, which show where that element was before and after the shift. The source identifies an element that moved, but it is not always the original cause. For example, article text may be listed as the shifted element even though a late advertisement above it caused the movement.
I would use the evidence before choosing a fix. Images should reserve their layout space with dimensions or an aspect ratio before the image finishes loading. Advertisement containers should reserve a predictable amount of space before the advertisement appears. For fonts, I would reduce metric differences between the fallback and final fonts and choose an appropriate font display strategy. Using font display swap by itself does not guarantee a lower CLS if the replacement font has different measurements.
I would then repeat the same scenario with the same browser, viewport, network condition, build, cache state, and measurement window. I would compare the CLS value and the relevant layout shift entries. I would also verify that images, advertisements, text, keyboard behavior, and screen reader behavior still work correctly.
The main tradeoff is that reserved advertisement or image space may temporarily appear empty. Font choices can also affect design and loading behavior. The goal is not to remove useful content. The goal is to keep the layout predictable while that content loads.
Technical Approach
Define the symptom as unexpected movement of content that is already visible.
Use CLS as the main visual stability metric.
Reproduce the news page with the same browser, viewport, network condition, build, cache state, and measurement window.
Record the page with the browser Performance panel and inspect layout shift events or layout shift regions.
Use PerformanceObserver when runtime layout shift entries are useful.
Inspect each entry value, hadRecentInput, and available sources such as the affected node, previousRect, and currentRect.
Connect the shifted element to the actual cause, such as an image without reserved space, a late advertisement, or a font metric change.
Exclude shifts with recent qualifying user input from the CLS calculation.
Apply one change that addresses the measured cause, such as reserving layout space or reducing font metric differences.
Repeat the same scenario and verify the CLS value, layout shift entries, correctness, and accessibility.
Practical Insights
This investigation does not depend on an important algorithmic time complexity. The main costs come from measurement and browser layout work. Recording a Performance trace adds temporary profiling overhead, so it is mainly a diagnostic tool. PerformanceObserver can collect runtime layout shift entries with lower overhead, but production telemetry still needs careful sampling and storage. Reserving space may leave a temporary empty area while an image or advertisement loads. Font changes may require design work to keep fallback and final text measurements similar. These costs are usually small compared with the benefit of a stable page.
Why Interviewers Ask This
Interviewers ask this question to see whether I understand visual stability in the browser. They want to know whether I can identify unexpected layout movement, separate it from expected movement after user input, and use browser evidence to find the elements involved. They are also checking whether I understand that CLS is different from animation smoothness and whether I can choose fixes that address the measured cause instead of guessing.
Common interview mistakes
Common mistakes include assuming every visible movement contributes to CLS, treating animation smoothness as the same metric, and blaming a late resource without inspecting actual layout shift evidence. Another mistake is forgetting that a shift with recent qualifying user input is excluded from CLS. Developers may also look only at the final CLS number without checking which elements moved. A source element in a layout shift entry may be the element that moved rather than the element that caused the movement. It is also incorrect to say that every intentional animation is automatically excluded. A layout changing animation can still create shifts. Other mistakes include changing several things before measuring, comparing different page conditions before and after a fix, and using one local run as proof for all real users.
Interview tip
Explain CLS as a visual stability problem first. Use the same news page example from start to finish. Name the three common causes, explain which recent user input shifts are excluded, describe impact fraction and distance fraction briefly, and show how the Performance panel or layout shift entries identify moved elements. Finish by explaining how you would reserve stable space or correct font metrics and then retest the same page.
Interviewer may ask next
What if the page moves after a user clicks a control?
I would inspect the LayoutShift entry before deciding whether it contributes to CLS. For this news page, I would check hadRecentInput for the shift and inspect the affected elements and timing. If hadRecentInput is true, that shift is excluded from CLS because it follows recent qualifying user input. This matters because I should not spend time optimizing an expected interaction while leaving unexpected shifts from the image, advertisement, or font unchanged.
What tradeoff can appear when you reserve space for a late advertisement?
The main tradeoff is that the news page may temporarily show empty space while the advertisement is loading, unavailable, or smaller than the reserved area. I would still reserve a predictable container when the alternative is moving visible article content after it appears. I would validate the change with the same browser, viewport, network condition, build, cache state, and measurement window. I would compare CLS and the relevant layout shift entries and also check responsive layouts so the reserved area does not create an unacceptable permanent gap.
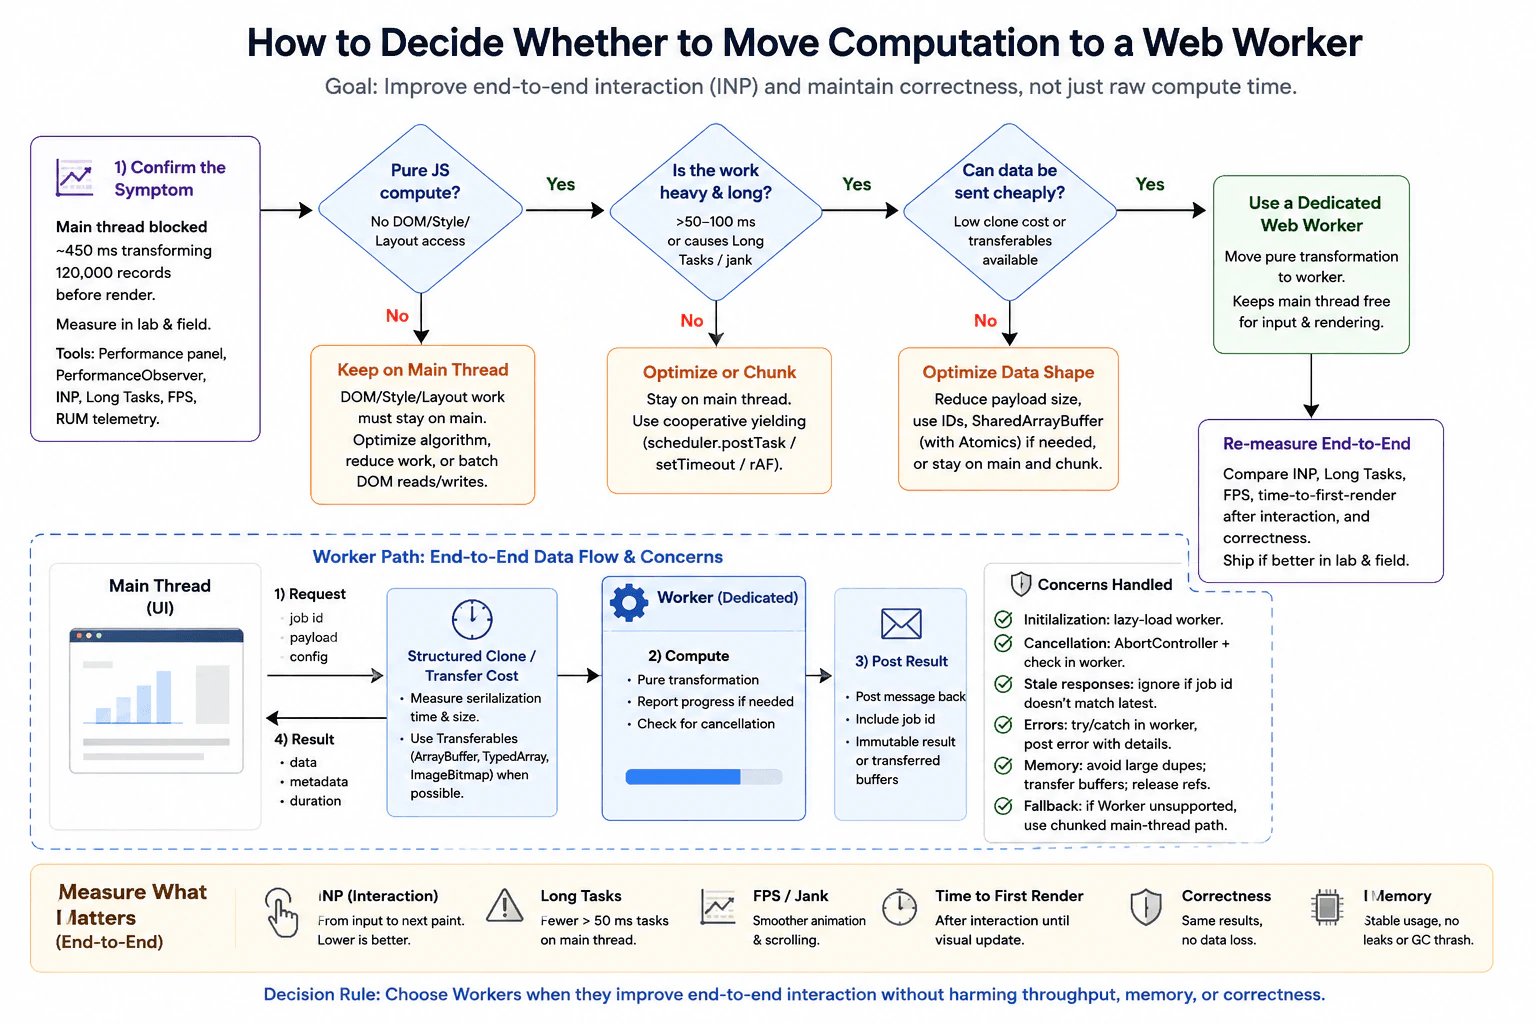
95. How would you decide whether to move computation to a Web Worker?PerformanceHard
i Question Details
A visualization transforms 120,000 records and currently blocks the main thread for 450 ms before rendering. Compare optimizing the algorithm on the main thread, chunking with cooperative yielding, and moving pure transformation to a dedicated worker. Account for structured-clone or transferable costs, initialization, cancellation, stale responses, error propagation, memory duplication, and browsers without the required worker capability. Define end-to-end interaction and correctness measurements rather than comparing computation time alone.
Short Interview Answer (30-60 seconds)
I would measure the full interaction first, not only the transform function. The visualization blocks the main thread for about 450 ms while transforming 120,000 records, so I would confirm that the delay is pure JavaScript work with a browser performance trace. I would optimize the algorithm first, then compare cooperative chunking with a dedicated Web Worker. I would choose the worker only if the full path, including startup, cloning or transfer, computation, result handling, rendering, memory, cancellation, and errors, gives better INP and fewer long tasks while keeping results correct.
Detailed Explanation
The page has to transform 120,000 records before it can show the visualization. Right now that work keeps the browser busy for about 450 ms, so the person may feel a pause before seeing the result. The decision is whether to make the work cheaper on the main thread, split it into smaller pieces so the browser can respond between pieces, or move the pure calculation to a separate worker. The best choice is the one that makes the whole interaction faster and smoother while keeping the final result correct, memory use reasonable, and fallback behavior safe.
Useful Questions to Ask the Interviewer
Is the 450 ms block measured on a representative production device and browser?
Does the transformation touch the DOM, style, layout, canvas state, or any other main thread only API?
What INP and time to first useful visual result should this interaction meet?
Are the 120,000 records plain serializable data, or can large buffers be transferred instead of copied?
Can a newer request replace an older request while work is still running?
Which browsers must support this feature, and what fallback behavior is required?
How to Explain It in an Interview
I would treat this as an interaction performance decision. The baseline is the same user action that transforms 120,000 records and blocks the main thread for about 450 ms before the useful visual result appears.
First, I would reproduce the action with a production build on representative devices and supported browsers. I would keep the input size, build, cache state, browser, device class, and interaction the same for every comparison. In browser Performance tools I would confirm that the delay is JavaScript execution on the main thread rather than network waiting, style calculation, layout, paint, or compositing. I would also collect INP, long task duration, animation or scrolling smoothness, time to first useful visual result, total interaction time, memory behavior, and result correctness. Lab traces help me reproduce and inspect the cause. Field telemetry tells me whether real users see the same problem.
Then I would compare three choices. First, I would keep the work on the main thread and improve the algorithm, data structures, repeated lookups, and unnecessary allocations. This is the simplest option because it avoids worker startup and message costs. If the optimized work becomes short enough that the interaction is responsive, I would keep it on the main thread.
Second, I would test cooperative chunking. I would split the transformation into small pieces and yield between pieces with a scheduler such as scheduler.postTask when available, or setTimeout as a fallback. requestAnimationFrame can be used when I specifically want to schedule a small piece of work before a visual update, but it does not make expensive work free. Chunking avoids worker communication costs, but the CPU work still runs on the main thread, so large or frequent chunks can still cause jank.
Third, I would test a dedicated Web Worker if the expensive part is pure computation. A worker cannot directly access the page DOM, style, or layout. The main thread sends a job id and input data. The browser uses structured clone for ordinary serializable values, or ownership transfer for supported transferable buffers when that is safe. The worker performs the pure transformation and posts the result back with the same job id. The main thread accepts only the newest valid result, applies it, and renders the visualization.
I would measure the full worker path. That includes worker initialization when it is not already ready, request creation, serialization or transfer, worker computation, result transfer, main thread result application, and the next visible update. A worker is useful only when this complete interaction is better than the optimized main thread or chunked version. Raw worker compute time alone is not enough.
I would also handle production correctness. Each request gets a job id. If a newer request starts, the older job becomes obsolete. An AbortController can represent cancellation in the application, but it does not automatically stop worker CPU work. The main thread must send a cancel message or terminate and replace the worker when appropriate, and long worker computations should check a cancellation flag between safe chunks. When any result returns, the main thread ignores it if its job id is no longer current. This prevents stale responses from replacing newer state.
Errors must cross the worker boundary clearly. I would listen for worker error and message error events, return useful error details for expected failures, and keep the UI in a safe state. I would watch memory because structured cloning large data can temporarily duplicate it. Transferable ArrayBuffer based data can reduce copying, but transfer changes ownership, so the sender must not expect to keep using the transferred buffer. SharedArrayBuffer with Atomics is another specialized option for shared memory, but it adds browser security requirements and synchronization complexity, so I would use it only when measurement shows that simpler transfer is not enough.
For browsers without the required worker capability, I would use a checked main thread fallback with the same transformation logic. That fallback can use the optimized algorithm and cooperative chunking so the result remains correct even if responsiveness is lower.
Finally, I would rerun the same representative scenario for all three choices. I would compare INP, long tasks, FPS or visible jank, time to first useful visual result, total interaction time, memory, and correctness. I would also verify cancellation, stale result handling, error states, supported browsers, and that the transformed output matches the expected result. For this 450 ms pure transformation, a dedicated worker is a strong candidate if algorithm improvements and chunking are not good enough and the communication and memory costs remain acceptable.
Technical Approach
Define the baseline as the same interaction that transforms 120,000 records and blocks the main thread for about 450 ms before the useful visual result.
Reproduce it with the same production build, browser, device class, input, cache state, and measurement window.
Use browser Performance tools to confirm that the long delay is JavaScript execution on the main thread and not network waiting or rendering work.
Measure INP, long tasks, FPS or visible jank, time to first useful visual result, total interaction time, memory, and correctness.
Optimize the algorithm, data shape, repeated lookups, and unnecessary allocations first. Measure again with the same workload.
If the work is still expensive, test cooperative chunking with small pieces that yield through scheduler.postTask or setTimeout. Use requestAnimationFrame only for small work that should run before a visual update.
If the expensive part is pure and the data is serializable or transferable, test a dedicated Web Worker. Measure initialization, request setup, structured clone or transfer cost, worker computation, result return, main thread application, and rendering.
Give each request a job id. Mark older work obsolete when a newer request starts and ignore stale results.
Use AbortController as the application cancellation signal, then send a cancel message or terminate the worker when appropriate. Let long worker work check cancellation between safe chunks.
Propagate worker errors to the main thread. Watch memory duplication and use transferable buffers when ownership transfer is safe and useful.
Use an optimized main thread fallback when the required worker capability is unavailable.
Compare all options under the same workload and choose the simplest one that meets interaction, memory, and correctness goals.
Practical Insights
Moving the transformation to a worker does not automatically reduce the amount of logical computation. If the algorithm still visits the same 120,000 records, the big order of growth may stay the same. The main benefit is that suitable CPU work no longer blocks input and rendering on the main thread. A worker adds initialization, message handling, serialization or transfer, error handling, cancellation logic, and maintenance cost. Structured cloning can copy large data and temporarily increase memory use. Transferable buffers can reduce copy cost, but ownership moves to the receiver. Cooperative chunking avoids worker startup and transfer costs, but the CPU work still consumes main thread time.
Why Interviewers Ask This
Interviewers ask this to see whether I measure the user experience before choosing a concurrency tool. They want to know whether I can prove that JavaScript execution is blocking the main thread, compare simpler options first, understand worker communication and memory costs, and preserve correctness when requests are cancelled, replaced, or fail.
Common interview mistakes
Common mistakes are moving work to a worker before proving that JavaScript execution is the bottleneck, comparing only worker compute time instead of the full interaction, and assuming a Promise moves CPU work off the main thread. Another mistake is sending very large copied objects without measuring structured clone and memory cost. Teams also forget worker initialization, cancellation, stale responses, error propagation, browser fallback behavior, and ownership changes for transferred buffers. Chunking can also fail when each piece is still too large. Before and after tests are misleading when they use different devices, inputs, builds, or cache states. It is also a mistake to ignore correctness after the optimization.
Interview tip
Explain the decision in a clear order. Start with the 450 ms user visible block. Prove that pure JavaScript work is causing it. Optimize the algorithm first. Then compare cooperative chunking with a dedicated worker. Include initialization, data movement, memory, cancellation, stale results, errors, and fallback behavior. Finish by saying that the winning choice is the simplest one that improves the full interaction and preserves correctness.
Interviewer may ask next
What if the worker compute time is much faster but the interaction still feels just as slow?
I would not call the worker a success. For the same 120,000 record interaction, I would measure from the user action through worker initialization when relevant, request setup, structured clone or transfer, worker computation, result return, main thread application, and the next visible update. If INP, long tasks, FPS, or time to first useful visual result do not improve, the bottleneck may have moved to data movement, rendering, or result handling. I would profile that full path and compare it again with the optimized main thread and chunked versions.
How would you roll out the worker path if memory use increases for large inputs?
I would keep the same 120,000 record workload and compare memory together with INP, long tasks, visible result time, and correctness. I would check whether structured cloning creates large temporary copies and test transferable buffers when ownership transfer is safe. I would release the worker path gradually behind a controlled switch, monitor field interaction metrics, memory signals, and errors, and keep the optimized main thread fallback available. If memory pressure or failures exceed the budget, I would disable the worker path and investigate a smaller data shape or a safer transfer strategy.
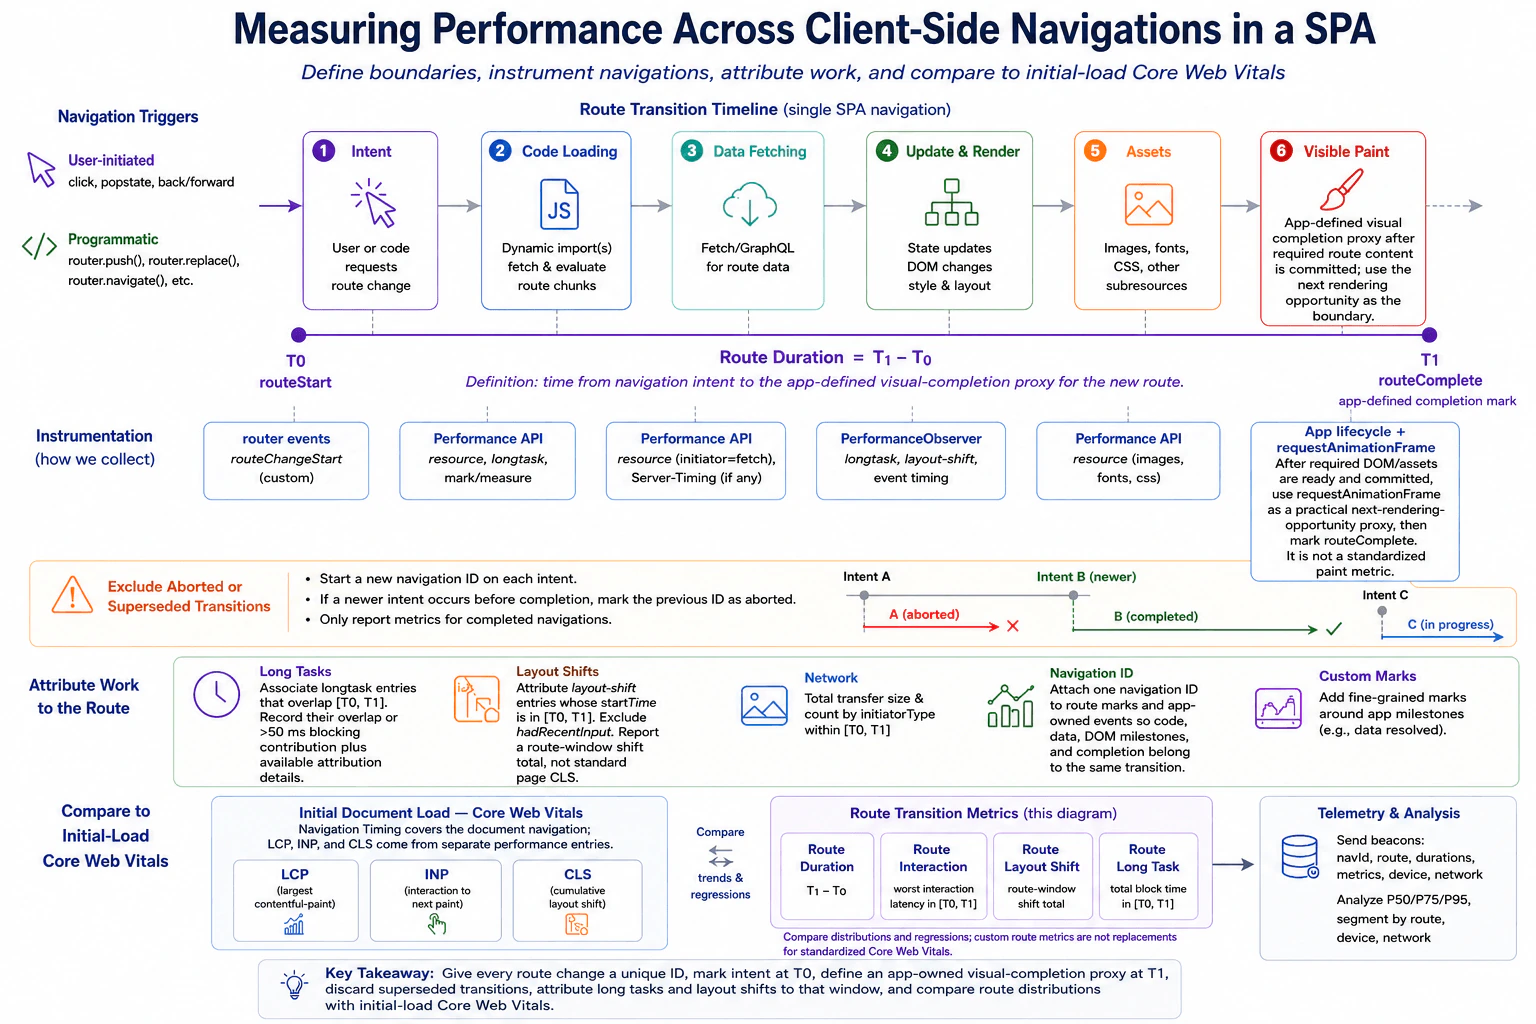
96. How would you measure performance across client-side navigations in a single-page application?PerformanceHard
i Question Details
The initial document navigation is fast, but users report slow route transitions that do not create new Navigation Timing entries. Define start and completion boundaries for a route change that may involve code loading, data fetching, DOM updates, images, and a final paint. Explain how you would instrument user-initiated and programmatic navigations, exclude aborted or superseded transitions, relate long tasks and layout shifts to the route, and compare the custom metric with initial-load Core Web Vitals.
Short Interview Answer (30-60 seconds)
I would treat every completed route change as its own measured transaction. I would mark T0 when the user or application requests the route, assign a unique navigation ID, and mark T1 at an application owned visual completion proxy after required route content is committed and the next rendering opportunity is reached. I would discard superseded transitions, associate long tasks and layout shifts with that route window, collect resource and interaction data, and compare P50, P75, and P95 route results with initial load LCP, INP, and CLS. The important tradeoff is that T1 is a custom proxy, not a standard browser paint metric.
Users may see a fast first visit but still feel that moving to another view is slow. The goal is to measure every route change from the moment it starts until the new view is ready enough to see and use. We also need to ignore a route change if a newer one replaces it. Then we can see which routes are slow, what work happened while they were changing, and how many real users are affected. Finally, we compare these route results with the first visit results without pretending they are the same measurement.
Useful Questions to Ask the Interviewer
What should count as visually complete for each route?
Do we need to wait for every image, or only content required for the route?
Which browsers, device classes, and network conditions matter most?
Should back and forward navigation use the same completion rule?
Which routes have the most user complaints?
How to Explain It in an Interview
I would start with the symptom. The initial document navigation is fast, but users report slow route changes. A single page application normally keeps the same document, so those route changes do not create new Navigation Timing entries. I therefore need a custom route measurement.
At T0, I mark the moment the route change is requested. For a click or a back and forward action, I capture the user intent at the router boundary. For a programmatic navigation such as router.push or router.replace, I mark the same logical start when the application requests the route. Every transition receives a unique navigation ID so marks, resources, tasks, layout shifts, interactions, and completion can be related to the same route.
Between T0 and T1, I collect the work that can make the transition slow. This can include dynamic JavaScript loading, route data requests, state changes, DOM updates, images, fonts, style calculation, layout, paint preparation, and main thread work. Resource Timing helps explain code, data, image, and font loading. PerformanceObserver can collect supported long task, layout shift, and interaction entries. Application marks can record useful milestones such as data ready or DOM committed.
For T1, I would not claim that the browser exposes a standard final paint event for a route. The application defines a visual completion proxy. After the required route content is ready and committed, I use requestAnimationFrame as a practical next rendering opportunity and then record routeComplete. The route duration is T1 minus T0. This gives the team a repeatable boundary, but requestAnimationFrame itself does not prove that pixels have already been presented to the user.
If a newer navigation begins before the previous transition reaches T1, I mark the older navigation as superseded and exclude it from completed route duration results. The navigation ID prevents events from the old transition from being mixed with the new transition.
For long tasks, I associate entries that overlap the T0 to T1 window. I record their overlap or blocking contribution and any available attribution details. For layout shifts, I associate entries whose start time is inside the route window and ignore entries where hadRecentInput is true. I call the result a route window layout shift total, not standard page CLS. For interactions inside the window, I can record a custom worst interaction latency, but I do not call that route INP because INP is a standard page level Core Web Vital.
I would collect field telemetry by route, browser, device class, network condition, build version, and cache state. I would compare P50, P75, and P95 for route duration and supporting signals. In a controlled lab case, I would reproduce the same route and use the browser Performance tools and Network tools to see whether the delay comes mainly from loading, JavaScript execution, rendering, or interaction blocking.
Initial load measurements remain separate. Navigation Timing describes the document navigation. LCP, INP, and CLS come from their own performance entries and describe Core Web Vitals for the document experience. I can compare distributions and regressions between initial load metrics and custom route metrics, but the custom metrics do not replace Core Web Vitals.
If the evidence points to slow chunk loading, heavy JavaScript, delayed data, excessive rendering, or expensive assets, I change only that measured cause. Then I repeat the same route, browser, device class, network condition, build mode, and cache state. I verify the target metric, visual behavior, focus behavior, keyboard and screen reader behavior, errors, and nearby routes. After release, I watch the same field distributions and error signals to make sure the problem improved and the bottleneck did not move elsewhere.
Key Insight / Why This Solution Works
Define the exact route, browser, device class, network condition, build mode, cache state, and visual completion rule.
Mark T0 when user intent or a programmatic route request begins.
Assign a unique navigation ID to the transition.
Record route milestones plus relevant resource, long task, layout shift, and interaction entries.
After required route content is ready and committed, use requestAnimationFrame as the practical next rendering opportunity proxy and mark T1.
If a newer route begins before T1, mark the previous transition as superseded and exclude it from completed route results.
Compute route duration as T1 minus T0 and associate supporting signals with the same navigation ID.
Aggregate real user results by route and conditions and compare P50, P75, and P95.
Reproduce slow routes in browser Performance and Network tools to classify the delay as loading, scripting, rendering, or interaction work.
Make one evidence based change, repeat the same scenario, and verify correctness, accessibility, errors, and nearby routes.
Code
const active = newMap();
let currentNavigationId = null;
let nextId = 1;
const longTasks = [];
const layoutShifts = [];
const interactionEntries = [];
// Collect supported browser entries once so they can later be related to a route window.if ('PerformanceObserver'inwindow) {
try {
const longTaskObserver = newPerformanceObserver((list) => {
for (const entry of list.getEntries()) {
longTasks.push({
startTime: entry.startTime,
duration: entry.duration,
});
}
});
longTaskObserver.observe({ type: 'longtask', buffered: true });
} catch {}
try {
const layoutShiftObserver = newPerformanceObserver((list) => {
for (const entry of list.getEntries()) {
if (!entry.hadRecentInput) {
layoutShifts.push({
startTime: entry.startTime,
value: entry.value,
});
}
}
});
layoutShiftObserver.observe({ type: 'layout-shift', buffered: true });
} catch {}
try {
const eventObserver = newPerformanceObserver((list) => {
for (const entry of list.getEntries()) {
interactionEntries.push({
startTime: entry.startTime,
duration: entry.duration,
});
}
});
eventObserver.observe({ type: 'event', buffered: true, durationThreshold: 16 });
} catch {}
}
functiondiscardNavigation(nav) {
// Remove app owned marks for a transition that will never be reported as completed.
performance.clearMarks(nav.startMark);
for (const milestone of nav.milestones) {
performance.clearMarks(`route:${nav.id}:${milestone.name}`);
}
active.delete(nav.id);
}
exportfunctionbeginRouteNavigation(route) {
// A newer route supersedes the previous active transition, so the old duration is excluded.if (currentNavigationId !== null) {
const previous = active.get(currentNavigationId);
if (previous) {
previous.status = 'superseded';
discardNavigation(previous);
}
}
const id = nextId++;
const startMark = `route:${id}:start`;
const startTime = performance.now();
// T0 is the logical navigation intent boundary for user and programmatic navigations.
performance.mark(startMark, { startTime });
active.set(id, {
id,
route,
startMark,
startTime,
status: 'active',
milestones: [],
});
currentNavigationId = id;
return id;
}
exportfunctionmarkRouteMilestone(id, name) {
const nav = active.get(id);
if (!nav || nav.status !== 'active') return;
// App owned milestones connect data, DOM, or asset readiness to the same navigation ID.const markName = `route:${id}:${name}`;
performance.mark(markName);
nav.milestones.push({
name,
time: performance.now(),
});
}
functionnextRenderingOpportunity() {
// The callback is a practical next rendering opportunity proxy, not a confirmed paint timestamp.returnnewPromise((resolve) =>requestAnimationFrame(resolve));
}
exportasyncfunctioncompleteRouteNavigation(id) {
const nav = active.get(id);
if (!nav || nav.status !== 'active' || currentNavigationId !== id) {
returnnull;
}
// Call this only after the application knows that required route content is ready and committed.awaitnextRenderingOpportunity();
if (!active.has(id) || nav.status !== 'active' || currentNavigationId !== id) {
returnnull;
}
const endMark = `route:${id}:complete`;
const measureName = `route:${id}:duration`;
const endTime = performance.now();
// T1 is an application owned visual completion proxy, not a standardized browser paint metric.
performance.mark(endMark, { startTime: endTime });
performance.measure(measureName, nav.startMark, endMark);
const durationEntry = performance.getEntriesByName(measureName).at(-1);
// Associate long tasks by temporal overlap with the route measurement window.const routeLongTasks = longTasks
.filter((entry) => {
const taskEnd = entry.startTime + entry.duration;
return entry.startTime < endTime && taskEnd > nav.startTime;
})
.map((entry) => {
const overlapStart = Math.max(entry.startTime, nav.startTime);
const overlapEnd = Math.min(entry.startTime + entry.duration, endTime);
return {
startTime: entry.startTime,
duration: entry.duration,
overlap: Math.max(0, overlapEnd - overlapStart),
};
});
// This is a custom route window total, not standard page CLS.const routeLayoutShift = layoutShifts
.filter((entry) => entry.startTime >= nav.startTime && entry.startTime <= endTime)
.reduce((sum, entry) => sum + entry.value, 0);
// This is a custom worst interaction latency inside the route window, not standard INP.const routeInteractionLatency = interactionEntries
.filter((entry) => entry.startTime >= nav.startTime && entry.startTime <= endTime)
.reduce((worst, entry) =>Math.max(worst, entry.duration), 0);
// Resource Timing gives route related loading evidence for code, data, images, fonts, and other assets.const resources = performance
.getEntriesByType('resource')
.filter((entry) => entry.startTime >= nav.startTime && entry.startTime <= endTime)
.map((entry) => ({
name: entry.name,
initiatorType: entry.initiatorType,
startTime: entry.startTime,
duration: entry.duration,
transferSize: entry.transferSize,
}));
nav.status = 'completed';
if (currentNavigationId === id) {
currentNavigationId = null;
}
const result = {
navigationId: id,
route: nav.route,
routeDuration: durationEntry?.duration ?? endTime - nav.startTime,
routeInteractionLatency,
routeLayoutShift,
longTasks: routeLongTasks,
resources,
milestones: nav.milestones,
};
// Clear app owned marks and measures after the summary is built to limit retained entries.
performance.clearMarks(nav.startMark);
performance.clearMarks(endMark);
for (const milestone of nav.milestones) {
performance.clearMarks(`route:${id}:${milestone.name}`);
}
performance.clearMeasures(measureName);
active.delete(id);
return result;
}
Why Interviewers Ask This
Interviewers ask this to see whether I can create a useful browser measurement when normal document navigation timing does not cover route changes. They want to know if I can define clear start and completion boundaries, connect browser work to the correct route, discard misleading samples, choose suitable browser APIs, use real user distributions, and compare custom route measurements with standard Core Web Vitals without confusing the two.
Common interview mistakes
Common mistakes are assuming that every route change creates a new Navigation Timing entry, calling requestAnimationFrame a confirmed final paint timestamp, reporting superseded transitions as successful samples, and calling a route window layout shift total CLS. Another mistake is calling the worst route interaction INP even though INP is a standard page level metric. Results are also misleading when teams compare different routes or different device and network conditions, use averages only, profile one fast development computer, optimize before measuring, or treat one profiler run as proof of production behavior.
Interview tip
Start with the measurement boundary. Say that T0 is navigation intent and T1 is an application owned visual completion proxy. Then explain the navigation ID, the superseded transition rule, the supporting browser entries, field percentiles, and the difference between custom route metrics and standard Core Web Vitals. This gives the interviewer a clear end to end measurement story without claiming that the browser provides a standard route paint metric.
Interviewer may ask next
What if requestAnimationFrame runs while a large route image is still loading?
Then the completion rule is too early for that route. I would first define which content is required for the route to count as visually complete. completeRouteNavigation would be called only after that required image or other required asset is ready and its related UI is committed. T1 would still use the next rendering opportunity as the application owned proxy. Optional images should not block the metric unless the product definition requires them. The tradeoff is that waiting for too much content can turn a useful readiness metric into an asset completeness metric.
How would you roll this measurement out without creating too much telemetry cost?
I would keep the same T0 to T1 route boundary and navigation ID, but sample real user telemetry and send compact summaries instead of every raw browser entry. I would keep route duration, custom route interaction latency, route window layout shift, long task contribution, resource summaries, route name, browser, device class, network condition, build version, and cache state. I would compare P50, P75, and P95 across releases. The tradeoff is less raw debugging detail in exchange for lower network, storage, and analysis cost.
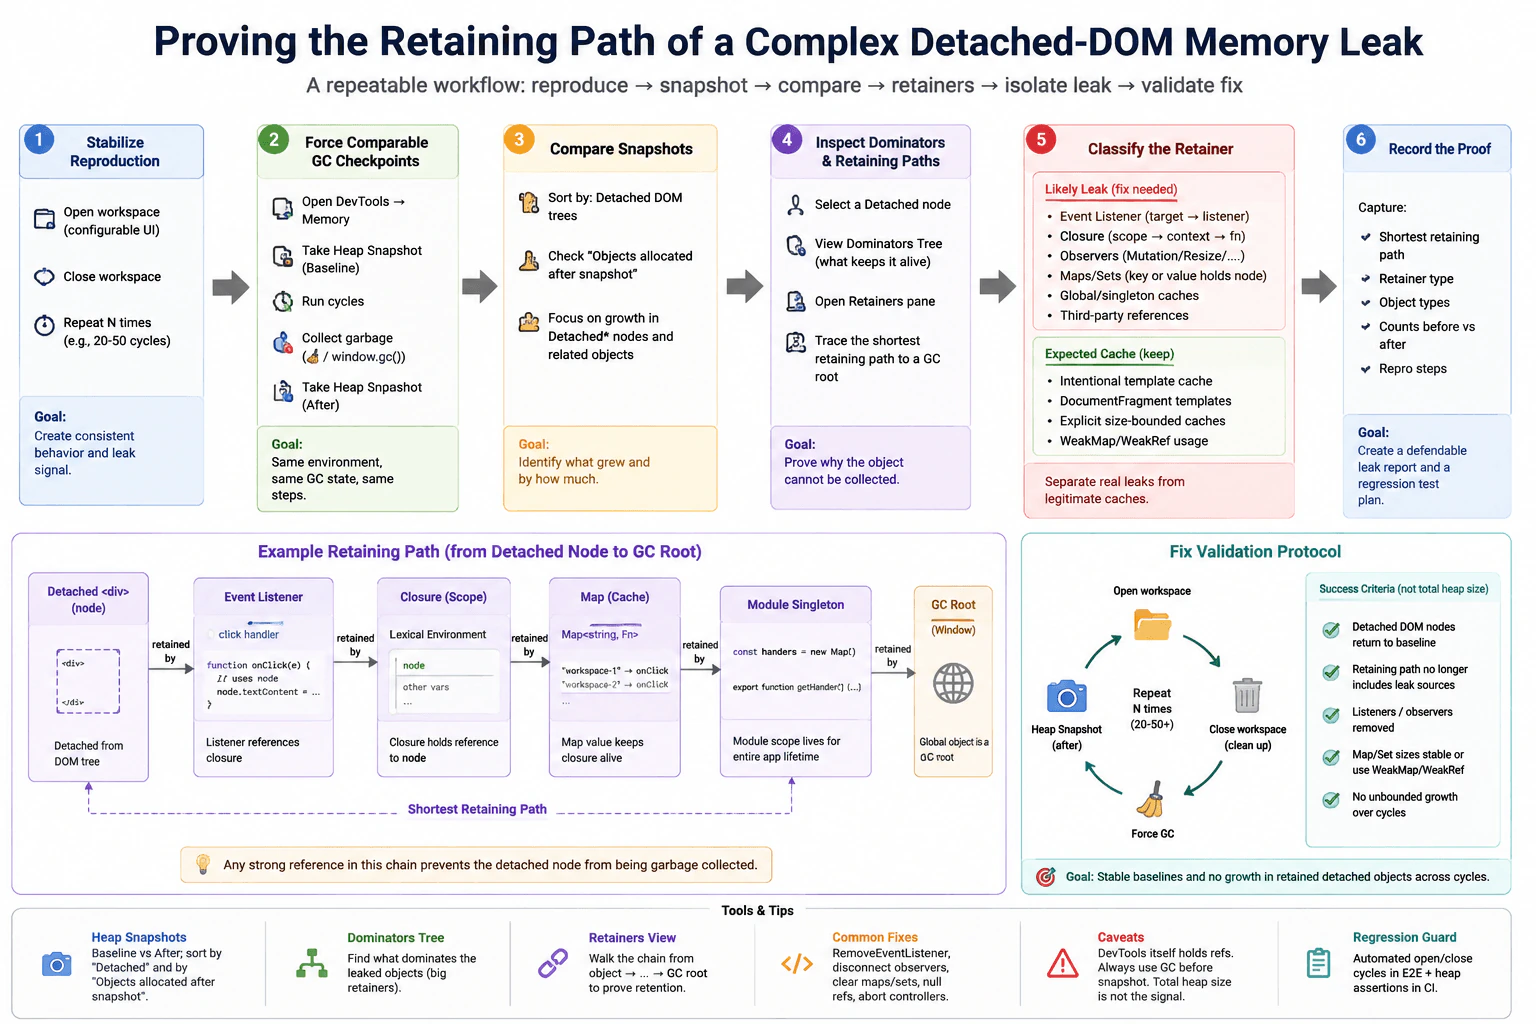
97. How would you prove the retaining path of a complex detached-DOM memory leak?PerformanceHard
i Question Details
After closing a configurable workspace repeatedly, heap snapshots show thousands of detached nodes, but the application also holds legitimate cached templates. Describe how you would establish a stable reproduction, force comparable garbage-collection checkpoints, compare snapshots, inspect dominators and retaining paths, and separate expected caches from leaked listeners, closures, observers, or maps. Define a fix-validation protocol that covers repeated open/close cycles and avoids using total heap size alone.
Short Interview Answer (30-60 seconds)
I would prove the leak by repeating the same workspace open and close sequence, forcing comparable garbage collection checkpoints, and comparing heap snapshots taken at the same points. I would focus on detached DOM trees that keep growing, inspect their dominators and retaining paths, and trace each suspicious node back to a live garbage collection root such as Window. Then I would separate intentional template caches from accidental listeners, closures, observers, maps, sets, timers, or global references. After removing the exact bad reference, I would repeat the same cycles and confirm that detached node counts and retained size stay stable. I would not use total heap size alone because legitimate caches and normal browser memory behavior can make it noisy.
Detailed Explanation
The goal is to prove why old workspace elements stay in memory after the workspace is closed. I would first make the same open and close action happen in a predictable way. Then I would take matching memory pictures at the same points and compare what remains. I would look for old page elements whose count keeps increasing, then follow the chain of things that still point to them. Some saved items are expected, such as reusable templates, so I would separate those from accidental references and repeat the same test after changing the cleanup logic.
Useful Questions to Ask the Interviewer
Can I reproduce the issue with one fixed workspace configuration and the same open and close sequence?
Are there known template caches or other objects that are intentionally kept for the lifetime of the page?
Which browsers must the fix be validated in?
Is there an existing automated workspace lifecycle test that I can extend for memory regression checks?
How to Explain It in an Interview
I would start by defining the symptom precisely. The symptom is not simply that total heap size rises. The stronger symptom is that detached DOM nodes from closed workspaces remain reachable after garbage collection and their count or retained size keeps growing across repeated cycles.
Next I would create a stable reproduction. I would use the same browser version, application build, workspace configuration, data, cache state, and lifecycle sequence. I would disable unrelated noisy features when practical. I would open the configurable workspace, close it, run the normal teardown hooks, and repeat that exact sequence a fixed number of times such as twenty to fifty cycles.
I would then create comparable garbage collection checkpoints. In the browser Memory tools, I would collect garbage and take a baseline heap snapshot at a defined idle state. I would run the chosen number of workspace cycles, return to the same idle state, collect garbage again, and take another heap snapshot. If the browser was launched with explicit garbage collection support, a test harness could use that capability, but I would not assume that ordinary page code can always call it. The important rule is that every snapshot represents the same lifecycle point.
I would compare the snapshots and focus on detached DOM trees and the objects associated with them. I would inspect counts and retained size and look for types that consistently grow across repeated cycles. I would also inspect closures, event listeners, observers, Maps, Sets, timers, and long lived application objects. One snapshot can contain normal noise, so repeated growth under the same workload is stronger evidence than one large value.
For a suspicious detached node, I would inspect the dominator tree and the retainers view. A dominator is an object whose continued reachability controls whether another group of objects can be collected. The retaining path shows the chain of strong references that keeps the detached object reachable. I would trace the shortest useful retaining path until I reach a garbage collection root such as Window.
A concrete path consistent with the investigation could be a detached workspace element retained by an event listener, which is retained through a closure, which is stored as a value in a Map, which is owned by a long lived module singleton, which is reachable from Window. Any strong reference in that chain is enough to keep the detached DOM subtree alive. I would record the path, the retainer type, the relevant object types, the counts before and after the cycles, and the exact reproduction steps so the evidence can be repeated.
I would not automatically label every retained detached node as a leak. The application intentionally keeps cached templates. I would classify those separately. An expected cache should have a clear owner, an intentional purpose, and bounded or stable growth across repeated workspace cycles. Reusable DocumentFragment templates can be legitimate. A bounded Map can also be legitimate. WeakMap or WeakRef may be appropriate for some ownership models, but they do not replace correct lifecycle cleanup.
A suspicious path is different. Examples include an event listener that is never removed, a closure that captures a workspace node, a MutationObserver or ResizeObserver that is never disconnected, a Map or Set that keeps entries for closed workspaces, a timer that still holds workspace state, a third party callback that remains registered, or a global or singleton object that keeps a reference longer than intended. If the retained size or object count grows with each repeated workspace cycle, that makes the case stronger.
Once I prove the exact bad edge, I would remove that ownership relationship rather than applying a broad memory workaround. I might remove the listener during teardown, disconnect the observer, cancel the timer, delete the Map or Set entry, clear a closure reference, abort an obsolete supported operation, or remove the reference held by the singleton. The change should follow directly from the retaining path that was measured.
Then I would validate the fix with the same measurement boundary. I would repeat the same twenty to fifty workspace open and close cycles, use the same garbage collection checkpoints, and capture fresh heap snapshots. I would compare the same object types again. Success means the detached DOM node count returns near the stable baseline, the retained size of the suspicious objects does not keep growing, the old retaining path no longer reaches the closed workspace through the leaking application objects, listener and observer cleanup is visible, and Map or Set ownership remains stable.
I would also verify that the cleanup did not break behavior. Listeners that belong to an active workspace must still work. Observers that are needed while the workspace is open must still run. Timers and callbacks must stop only when their owner is actually closed. Visible behavior, keyboard use, focus behavior, error handling, and accessibility must remain correct.
The main measurement limitation is that developer tools can add noise and can sometimes keep inspected objects reachable. Heap size also changes because of legitimate caches, code, browser internals, and memory fragmentation. That is why I would not use total heap size as the primary success metric. I would track the specific detached nodes, their retained size, their dominators, and their retaining paths.
For regression protection, I would add an automated memory smoke test around the same workspace lifecycle. It would repeat the open and close sequence and flag an unbounded growth trend in the targeted retained objects. That automated check is a guardrail rather than final proof. If it fails, I would return to heap snapshots and retaining path analysis to identify the exact reference.
Technical Approach
Define the symptom as detached workspace DOM nodes that remain reachable after close and continue growing across equivalent cycles.
Freeze the test conditions by using the same browser version, application build, workspace configuration, data, cache state, lifecycle sequence, and idle checkpoint.
Collect garbage and take a baseline heap snapshot.
Open and close the configurable workspace repeatedly using the same actions and normal teardown path.
Return to the same idle state, collect garbage again, and take the comparison snapshot.
Compare detached DOM tree counts, retained size, and related closures, listeners, observers, Maps, Sets, timers, and long lived objects.
Select a suspicious detached node and inspect its dominator and retaining path until the path reaches a garbage collection root such as Window.
Record the shortest useful path, retainer type, object types, counts before and after, and reproduction steps.
Classify the retainer as intentional or accidental. Keep bounded template caches. Treat unexpected listeners, closures, observers, maps, timers, third party references, or global references as leak candidates.
Remove the exact strong reference identified by the retaining path.
Repeat the same twenty to fifty cycles with the same garbage collection checkpoints and capture fresh snapshots.
Confirm that detached node counts and retained size remain stable and that the previous leaking path no longer exists.
Add an automated memory regression guard for the same workspace lifecycle.
Practical Insights
The main cost is investigation time and memory used by the profiling tools. Heap snapshots can pause the page and use a large amount of memory because the browser records many objects and references. Comparing large snapshots can also take time. Repeating twenty to fifty workspace cycles makes the test slower, but it gives stronger evidence. The cleanup itself can add maintenance work because listeners, observers, timers, Maps, Sets, and closures need clear ownership rules. Automated memory tests are also slower and noisier than ordinary functional tests, so they need stable conditions and sensible growth thresholds.
Why Interviewers Ask This
Interviewers ask this to see whether I can prove a browser memory leak with repeatable evidence instead of guessing from total memory. They want to know whether I can create a controlled reproduction, compare equivalent heap snapshots, follow object ownership back to a live garbage collection root, distinguish intentional caches from accidental references, choose the right browser memory tools, and verify that cleanup really works across many repeated workspace cycles.
Common interview mistakes
Common mistakes include treating total heap size as proof of a leak, taking snapshots at different lifecycle points, comparing different workspace configurations, naming a detached node as a leak without tracing its retaining path, assuming every cache is wrong, ignoring legitimate bounded template caches, looking only at object count and ignoring retained size, stopping at the first retainer instead of tracing to a garbage collection root, forgetting to remove event listeners, forgetting to disconnect observers, leaving closed workspace entries in Maps or Sets, keeping DOM nodes inside long lived closures, failing to cancel timers, assuming WeakMap automatically repairs bad lifecycle ownership, trusting one snapshot, and validating the fix with a different workload. Another mistake is forgetting that developer tools themselves can add measurement noise or retain inspected objects.
Interview tip
Explain the investigation as a proof chain. Start with a repeatable workspace lifecycle. Take comparable snapshots after garbage collection. Find the detached objects that grow. Trace one retaining path to its live root. Separate legitimate bounded caches from accidental retention. Remove the exact bad reference. Repeat the same test and show that the targeted counts and retained size stay stable and that the leaking path is gone.
Interviewer may ask next
What if total heap size still grows after the retaining path is removed?
I would not treat total heap growth alone as proof that the workspace leak still exists. For the same repeated workspace open and close workload, I would compare detached DOM node counts, retained size for the previously suspicious object types, dominators, and retaining paths after equivalent garbage collection checkpoints. Total heap can still vary because of legitimate template caches, code, browser internals, allocation behavior, or fragmentation. If the targeted detached nodes stay stable and the previous application retaining path to Window is gone, I would investigate the remaining heap growth as a separate problem.
How would you protect against this leak returning when heap snapshots are too expensive to collect continuously?
I would keep heap snapshots as the controlled proof tool and add a cheaper automated regression guard around the same workspace open and close lifecycle. The test would repeat a fixed number of cycles and watch targeted memory signals such as detached node count or retained size when the test environment supports them. I would look for a sustained growth trend rather than total heap alone. The tradeoff is that automated memory checks can be noisy and browser dependent, so a failing guard should trigger a controlled heap snapshot investigation instead of being treated as final proof by itself.
98. How would you eliminate layout shifts caused by late page content?PerformanceMedium
i Question Details
A news page has a CLS of 0.31. Trace entries identify a header banner loaded after consent, image cards without intrinsic dimensions, and a promotional bar inserted above the article after an API response. Explain how you would map each shift to its source, distinguish expected user-triggered movement, reserve or relocate space, and validate the fix across narrow and wide viewports. Include a field-metric check rather than relying only on a visual inspection.
Short Interview Answer (30-60 seconds)
I would start from the CLS value of 0.31 and use the browser Performance panel and Layout Shift track to map each important shift to the element that moved. I would reserve space for the consent banner, give image cards intrinsic dimensions, and reserve or relocate the promotional area so it cannot push the article down after its API response arrives. I would separate shifts caused by recent user input from unexpected shifts. Then I would repeat the same checks on narrow and wide viewports and confirm the field CLS distribution, especially the 75th percentile.
Detailed Explanation
The page looks unstable because content appears late and pushes visible text or images to a new place. The starting CLS is 0.31. The goal is to find exactly which late elements create that movement and stop them from changing the page after it is visible. The three known causes are the consent banner, image cards that do not reserve space, and a promotion inserted above the article. The fix must work on both narrow and wide screens, and real visitor data must confirm that the page became stable.
Useful Questions to Ask the Interviewer
Should the header banner always have a known maximum height after consent?
Can the promotional content be shown below the article or inside a reserved area?
Which narrow and wide viewport sizes should we use for controlled checks?
Which field telemetry source is already available for CLS?
How to Explain It in an Interview
I would begin with the user visible symptom and baseline. This news page has a CLS of 0.31. I would reproduce the same page in a production build and record it with the browser Performance panel and Layout Shift track. For each important shift entry, I would inspect the affected elements and timing so the movement is tied to a measured source instead of guessed from visual inspection.
The trace already points to three causes. First, the header banner appears after consent and pushes the page down. I would reserve its final space before the banner content arrives. A placeholder or a container with a known minimum height or aspect ratio can keep the rest of the page in place while the real banner is swapped in.
Second, the image cards have no intrinsic dimensions. I would add width and height attributes or a stable CSS aspect ratio so the browser knows the image box size before the image finishes loading. The image can still use object fit for cropping, but the reserved box must remain stable while the image loads and decodes.
Third, the promotional bar arrives after an external API response and is inserted above the article. That creates unexpected movement because the article is already visible. I would either reserve a promotion slot from the start or move the promotion below the article or into another location where late arrival does not push existing content.
I would also distinguish expected movement from unexpected movement. CLS entries expose whether a shift had recent user input. A shift shortly after qualifying user input is not counted in CLS, while movement that appears later without such input is the problem I want to remove. I would still check keyboard navigation, focus behavior, and screen reader behavior so the layout change stays accessible.
For validation, I would retest the same route with the same production build and comparable device, network, and cache conditions. I would test at least one narrow viewport and one wide viewport because reserved space can behave differently at different widths. DevTools and Lighthouse are useful controlled diagnostic tools, but one lab run is not final proof.
After release, I would collect real user CLS through browser field telemetry using a Web Vitals library or PerformanceObserver where appropriate. I would compare the field distribution before and after the change, with special attention to the 75th percentile. I would also segment by viewport or device class so a good desktop result does not hide a narrow screen regression. CrUX or Search Console can provide additional Core Web Vitals field evidence when available.
The success target is field CLS below 0.1 at the 75th percentile across the important narrow and wide viewport groups, with no new regressions in correctness or accessibility. I would keep monitoring after release so a later banner, image, font, or promotion change does not bring the problem back.
Technical Approach
Start with the baseline CLS of 0.31 on the news page.
Reproduce the same page in a production build under controlled browser conditions.
Record the page with the Performance panel and Layout Shift track.
Map each important shift to the element that moved and the event that happened before it.
Check whether each shift had recent user input so expected movement is separated from unexpected movement.
Reserve the header banner space before consent finishes.
Give each image card stable width and height dimensions or a stable aspect ratio.
Reserve a promotional slot or relocate the promotion so the API response cannot push the article down.
Repeat the same checks on narrow and wide viewports under comparable conditions.
Verify visual behavior, keyboard behavior, focus behavior, and content correctness.
Compare real user CLS before and after the change, especially the 75th percentile.
Continue monitoring for regressions after release.
Practical Insights
The main cost is not algorithmic runtime. The browser work is small, but the page needs stable layout rules and careful testing across viewport sizes. Reserved space can leave some empty area when optional content does not appear. Moving a promotion can affect product or business placement. Field telemetry adds measurement and maintenance work. The important tradeoff is keeping the page stable without hiding content, breaking accessibility, or creating more empty space than the design can accept.
Why Interviewers Ask This
Interviewers want to see whether I can connect visible movement to measured browser evidence, separate expected movement from harmful movement, choose a targeted layout fix for each source, and prove the result with controlled browser checks plus real user data.
Common interview mistakes
Common mistakes are guessing the cause from visual inspection, using only one Lighthouse run, treating every movement as harmful, lazy loading images without reserving their dimensions, inserting a late promotion above visible content, comparing different viewport conditions before and after, and declaring success without field CLS data. Another mistake is reserving a size that works only for one viewport, which can create new shifts on narrow or wide screens. A team can also miss regressions by checking only an average instead of the field distribution and the 75th percentile.
Interview tip
Explain the answer as a measured sequence. Start from CLS 0.31, map each shift to one source, apply one matching layout change for that source, then prove the result on narrow and wide viewports with real user CLS data.
Interviewer may ask next
What if Lighthouse shows a good CLS after the fixes but field CLS is still poor?
I would trust the field result as evidence that the controlled test is missing an important real user condition. For this news page, I would segment field CLS by viewport, device class, page template, consent state, and other relevant client conditions, then reproduce the segment with the worst result. The hidden source could be a different banner size, image ratio, promotion timing, font change, or another late element that the lab run did not exercise. The tradeoff is that broader field analysis takes more time, but it prevents a narrow lab case from hiding a production problem.
What tradeoff would you consider if reserving space for optional banners leaves empty space for some users?
I would keep layout stability as the priority, but I would choose the smallest predictable slot that safely fits the real banner states on this news page. If the empty area is too costly, I would relocate the optional content to a place where late arrival does not push visible article content. I would test the choice on narrow and wide viewports and compare field CLS after release. The tradeoff is between visual stability and unused space, so the final choice should be based on measured layout behavior and product needs.
99. How would you reduce a long main-thread task without changing its output?PerformanceMedium
i Question Details
After a 2 MB JSON response arrives, a browser task spends 240 ms normalizing records, grouping them, and rendering summary rows; clicks during that interval feel delayed. Describe how you would profile scripting versus style and layout time, decide whether to reduce data, chunk work, schedule yielding, or move pure computation to a worker, and measure interaction improvement. Preserve record ordering and final DOM output, and account for cancellation if the user navigates away.
Short Interview Answer (30-60 seconds)
I would first record the slow interaction in the browser Performance panel and separate scripting time from style calculation, layout, and paint. If scripting dominates, I would remove unnecessary work first. Pure normalization and grouping can move to a Web Worker when they do not need the DOM. Work that must stay on the main thread can run in small batches with a yield between batches so clicks can run. I would preserve record order and the same final DOM, cancel obsolete work on navigation, then repeat the same workload and compare interaction latency and long tasks.
Detailed Explanation
A 2 MB set of information arrives, and the page spends about 240 milliseconds preparing it and showing summary rows. While that work is happening, a click can feel slow because the page cannot respond quickly. I would first find which part of the work consumes the time. Then I would remove work that is not needed, divide large work into smaller pieces, or move suitable calculations away from the busy page. Whatever choice I make, the records must stay in the same order and the final rows must stay exactly the same.
Useful Questions to Ask the Interviewer
Must every summary row appear together, or may rows be produced in small batches?
Can normalization and grouping run without reading from or changing the DOM?
Is all data in the 2 MB response required to produce the final summary rows?
Should navigation or a newer request cancel any unfinished processing?
How to Explain It in an Interview
I would begin with a controlled reproduction of the same 2 MB JSON workload. I would use the same page, production build, browser, device class, cache state, and interaction each time. In the browser Performance panel, I would record the delayed click and inspect the main thread. I would separate JavaScript execution from style calculation, layout, and paint. I would also follow the interaction from input arrival, through main thread waiting and handler work, to the next visible update.
The first decision comes from that evidence. If scripting takes most of the task, I would optimize the JavaScript path. If style calculation, layout, or paint is large, I would instead reduce DOM work, batch DOM changes, and avoid patterns that repeatedly force layout. I would not assume that the whole 240 milliseconds is computation without measuring it.
If some records or fields are not needed to produce the required summary rows, I would avoid processing that unnecessary data. This reduction is valid only when the final output remains identical. I would treat the remote data source as an external boundary rather than designing its internals.
If the remaining work must run on the main thread, I would process a small batch of records, save the progress and ordering information, yield control, and then continue with the next batch. Where supported, scheduler.yield() is a good way to let higher priority browser work run. A timer based yield can be used as a fallback. requestAnimationFrame is useful when the next step is tied to a visual update, but it does not make expensive computation free. The batch size should be measured rather than guessed because a batch that is still too large can remain a long task.
If normalization and grouping are pure computation and do not need the DOM, I would consider a Web Worker. The main thread sends the required data to the worker. The worker normalizes and groups the records while keeping their order. It sends the result back, and the main thread renders the summary rows. A worker uses a separate execution context, unlike a Promise, so CPU heavy work can stop blocking the main thread. The tradeoff is worker startup, message transfer, extra memory, cleanup, and more code. Large values may also be copied unless the chosen representation can be transferred.
DOM rendering still happens on the main thread. I would keep stable record keys and deterministic result ordering so chunking or worker processing cannot change the sequence of rows. I would compare the final grouping values and DOM output with the original implementation.
Cancellation is required because the work can become obsolete. I would create an AbortController for operations that support its signal. A chunk loop would check that signal between batches and stop when navigation or a newer request makes the work unnecessary. For a dedicated worker, I would terminate the worker when appropriate and ignore any result that belongs to an obsolete request. I would also remove related listeners and references during cleanup.
After the change, I would repeat exactly the same workload and interaction. I would compare interaction latency, the count and duration of long tasks, and the main thread trace before and after. PerformanceObserver can collect supported runtime entries such as long task or event timing data where the browser exposes them, but browser support must be checked. Field Web Vitals data can show whether real user interaction distributions improve. I would use several samples or percentiles rather than treating one local run as proof.
Finally, I would verify the same record ordering, grouping results, summary values, and final DOM output. I would also test keyboard use, screen reader behavior, navigation during processing, error cases, supported browsers, and memory behavior. The optimization succeeds only when the page becomes more responsive without changing the required result or moving the bottleneck somewhere else.
Technical Approach
Reproduce the delayed click with the same 2 MB JSON input and capture a baseline.
Record the interaction in the browser Performance panel.
Separate scripting from style calculation, layout, and paint.
Follow the interaction from input arrival through main thread waiting, handler work, rendering, and the next visible update.
If unnecessary data is being processed, remove only data that cannot affect the required final output.
If scripting dominates, remove repeated or unnecessary computation before adding concurrency.
If DOM related work dominates, batch DOM changes and reduce repeated style and layout work.
If work must stay on the main thread, process small batches and yield between them.
If normalization and grouping are pure computation, move that part to a Web Worker and keep DOM rendering on the main thread.
Keep deterministic record ordering and stable keys when combining batches or worker results.
Cancel obsolete work when navigation or a newer request occurs, and ignore late results.
Repeat the same workload and compare interaction latency and long task behavior.
Verify identical grouping, ordering, final DOM output, accessibility behavior, memory behavior, and error handling.
Practical Insights
If normalization and grouping visit each record once, their CPU cost usually grows with the number of records. Breaking that work into batches does not automatically reduce the total CPU work. Its main benefit is that the browser can handle input and rendering between batches. A Web Worker can keep suitable CPU heavy computation away from the main thread, but it adds startup, communication, memory, cleanup, browser support, and maintenance costs. Sending large data to a worker can also require copying. The best choice depends on measured computation time, rendering time, yield overhead, and worker communication cost.
Why Interviewers Ask This
Interviewers want to see whether I measure the browser delay before changing code, separate JavaScript work from rendering work, and choose an optimization that matches the measured bottleneck. They also want to see whether I understand when to reduce unnecessary work, when to divide work into smaller batches, when a Web Worker is appropriate, and how to prove that interaction improves without changing record order, final DOM output, cancellation behavior, or accessibility.
Common interview mistakes
A common mistake is optimizing before recording a trace. Another is assuming the entire 240 millisecond task is JavaScript without separating scripting from style calculation, layout, and paint. Using a Promise does not move CPU work away from the main thread. A Web Worker also cannot directly manipulate the DOM. Other mistakes include making chunks that are still too large, sending expensive copies to a worker without measuring communication cost, continuing obsolete work after navigation, allowing late results to update a newer page state, comparing different workloads before and after, trusting one local run as final proof, or improving responsiveness while changing record order or final DOM output.
Interview tip
Present this as a measurement driven decision. Start with the delayed click and the 240 millisecond task. Explain how you separate scripting from rendering work. Then choose data reduction, chunking with yielding, or a Web Worker based on that evidence. Finish with cancellation and the same before and after measurement, and state that ordering and final DOM output must remain identical.
Interviewer may ask next
What would you do if the Performance panel showed that style calculation and layout, rather than normalization and grouping, were the main source of the 240 millisecond delay?
I would optimize DOM and rendering work instead of moving the main optimization to a Web Worker. For the same 2 MB JSON interaction, I would inspect the main thread trace for repeated style calculation, layout, and DOM updates. I would batch DOM writes, avoid repeated read and write patterns that force layout, and reduce unnecessary row updates while keeping the final DOM identical. Then I would repeat the same workload and compare interaction latency and rendering work. The tradeoff is additional rendering logic, so I would verify ordering, visual behavior, accessibility, and correctness.
When would you choose main thread chunking instead of moving normalization and grouping to a Web Worker?
I would choose main thread chunking when the work needs DOM access, when the pure computation is not large enough to justify worker startup and message transfer, or when worker support and maintenance cost are not worthwhile. For the same 2 MB workload, I would process small batches and yield between them while keeping deterministic record order. I would compare this with the worker approach under the same measurement conditions. Chunking still consumes main thread CPU, while a worker adds communication, memory, startup, and cleanup cost.
100. How would you find and fix layout thrashing in a drag interaction?PerformanceMedium
i Question Details
During pointer movement, a widget loops through 300 elements, reads getBoundingClientRect(), writes style.transform, and repeats those operations in the same loop. The performance trace shows repeated forced layout warnings and dropped frames. Explain how to prove the read/write dependency, reorganize measurement and mutation phases, schedule updates, and test that hit detection remains correct after scrolling or resizing. Include teardown of listeners and pending animation callbacks.
Short Interview Answer (30-60 seconds)
I would first record the same drag in the browser Performance panel and inspect the pointermove work. I would look for repeated forced reflow warnings, layout activity, long main thread work, and dropped frames. Then I would prove the dependency in the loop: getBoundingClientRect reads geometry, style.transform writes visual state, and the next geometry read may force the browser to flush pending style and layout work. I would collect the required rectangles first, perform the transform writes afterward, and let pointermove only save the latest pointer position and schedule one requestAnimationFrame callback. I would retest the same drag, verify hit detection after scroll and resize, and remove listeners and cancel any pending animation frame during teardown.
The user sees a drag that feels slow or jumps while moving. The page checks the position of 300 items and changes their appearance again and again during the same movement. This can make the browser stop repeatedly to work out where things are before it can continue. I would first prove that this repeated checking and changing is causing the slow frames. Then I would group all checking together, group all changes together, update only when the screen is ready, and test that the correct item is still found after the page moves or changes size.
Useful Questions to Ask the Interviewer
Should hit detection use viewport coordinates throughout the interaction?
Can the 300 element rectangles stay cached during one drag, or can their geometry change while dragging?
Must scrolling while dragging be supported?
Can content changes or zoom change the target geometry during the drag?
How to Explain It in an Interview
I would begin with the visible symptom and a repeatable baseline. The drag drops frames, and the Performance trace shows repeated forced reflow warnings during pointermove. I would reproduce the same drag using the same browser, device class, production build, page state, and interaction path. On a 60 Hz display, a frame has about 16.7 milliseconds available, so repeated long work inside one frame can make the interaction visibly stutter.
Next, I would inspect one pointermove event in the Performance panel. The important pattern is read, write, read, write across the 300 elements. getBoundingClientRect asks the browser for current geometry. style.transform changes visual state. A transform normally avoids changing document layout itself, but a later geometry read that requires current information can still make the browser flush pending style and rendering work before returning the result. Repeating this dependency inside the loop is the layout thrashing pattern I want to remove.
I would reorganize the work into two phases. The measurement phase performs every required getBoundingClientRect call and stores the rectangles. No DOM style writes happen during that phase. The mutation phase then uses the stored values and performs the style.transform writes. No new geometry reads happen inside that write phase. This changes the pattern from alternating reads and writes to grouped reads followed by grouped writes.
I would also schedule the interaction carefully. pointermove can fire more often than the browser paints. The pointermove handler should only store the newest clientX and clientY values and request an animation frame when one is not already pending. The requestAnimationFrame callback performs the needed read phase and then the write phase. requestAnimationFrame does not make expensive work free. Its benefit here is that many pointer events can share one visual update before the next paint.
For hit detection, I would use one coordinate system. getBoundingClientRect returns viewport relative rectangles, so clientX and clientY can be compared directly with those rectangles. If the application instead converts rectangles to page coordinates, it must convert the pointer coordinates in the same way by using the current scroll offsets. Mixing page coordinates and viewport coordinates would produce incorrect targets.
Cached measurements need clear invalidation rules. At pointerdown I would collect the required rectangles. If scrolling, resizing, zooming, or relevant content changes can move the target geometry, I would mark the measurements stale and collect them again before the next hit test that needs fresh geometry. If the visual transforms themselves are meant to change the hit regions, I would also refresh the relevant rectangles before using them again. The exact cache lifetime depends on what the application considers a valid hit area.
After the change, I would repeat the same Performance recording with the same drag path. I would compare forced reflow warnings, layout activity, long main thread work, and frame timing. I would expect the alternating layout pattern to disappear or become much smaller, with reads grouped before writes. I would not claim an improvement percentage without measurement.
Correctness is part of the verification. I would drag while scrolling, resize the window, and test representative pointer positions to confirm that the expected target is still selected. I would also check that the drag remains visually correct and that the optimization did not move the bottleneck into another part of the rendering path.
Finally, I would tear down everything created for the interaction. I would remove pointer, scroll, and resize listeners, cancel a pending requestAnimationFrame callback, clear cached rectangles and drag state, and disconnect any observer that was created to invalidate geometry. This prevents orphan work and unnecessary retained references.
Key Insight / Why This Solution Works
Reproduce the exact drag while recording the browser Performance panel.
Keep the browser, device class, build, page state, and drag path the same for the baseline and retest.
Inspect pointermove and confirm repeated forced reflow warnings, layout activity, long main thread work, or dropped frames.
Trace the dependency across the 300 elements: read geometry, write transform, then read geometry again.
Move all required getBoundingClientRect calls into one measurement phase and store the results.
Move all style.transform changes into a later mutation phase that performs no geometry reads.
Make pointermove store only the newest pointer coordinates and request one animation frame when no callback is already pending.
In the animation callback, perform the required reads first and the writes second.
Keep hit testing in one coordinate system. Use viewport rectangles with clientX and clientY, or convert both rectangles and pointer coordinates consistently.
Mark cached rectangles stale when scrolling, resizing, zooming, content changes, or other relevant geometry changes occur.
Repeat the same performance recording and compare the same rendering evidence.
Test hit detection while scrolling and after resizing.
Remove all listeners, cancel a pending animation callback, clear cached state, and disconnect any observer during teardown.
Code
functioncreateDragController(elements, dragHandle, computeTransform) {
let pointerX = 0;
let pointerY = 0;
let dragging = false;
let scheduled = false;
let rafId = null;
// Cached viewport rectangles are reused until a relevant geometry change marks them stale.let rects = [];
let rectsDirty = true;
functionmeasureRects() {
// Read phase: collect every required DOM geometry value before any style mutation.
rects = elements.map((element) => element.getBoundingClientRect());
rectsDirty = false;
}
functionfindHitIndex(clientX, clientY) {
// DOMRect values and client coordinates are both relative to the viewport.for (let index = 0; index < rects.length; index += 1) {
const rect = rects[index];
if (
clientX >= rect.left &&
clientX <= rect.right &&
clientY >= rect.top &&
clientY <= rect.bottom
) {
return index;
}
}
returnnull;
}
functionupdate() {
// Clear scheduling state when this visual update begins.
scheduled = false;
rafId = null;
if (!dragging) {
return;
}
// Refresh measurements only when geometry may have changed.if (rectsDirty || rects.length !== elements.length) {
measureRects();
}
// Hit detection uses cached JavaScript data and causes no new DOM geometry read here.const hitIndex = findHitIndex(pointerX, pointerY);
// Prepare all transform strings before starting the DOM write phase.const transforms = elements.map((element, index) => {
returncomputeTransform({
element,
index,
rect: rects[index],
pointerX,
pointerY,
hitIndex,
});
});
// Write phase: apply styles only after every required geometry read is complete.
elements.forEach((element, index) => {
element.style.transform = transforms[index];
});
}
functionscheduleUpdate() {
// Allow at most one pending visual update even when many pointer events arrive.if (scheduled) {
return;
}
scheduled = true;
rafId = requestAnimationFrame(update);
}
functiononPointerDown(event) {
// Start the measurement window for a new drag and capture the first pointer position.
dragging = true;
pointerX = event.clientX;
pointerY = event.clientY;
rectsDirty = true;
scheduleUpdate();
}
functiononPointerMove(event) {
// Keep this handler lightweight by storing only the latest input state.if (!dragging) {
return;
}
pointerX = event.clientX;
pointerY = event.clientY;
scheduleUpdate();
}
functiononPointerUp() {
// Stop drag work and cancel a visual update that has not run yet.
dragging = false;
if (rafId !== null) {
cancelAnimationFrame(rafId);
rafId = null;
}
scheduled = false;
}
functiononGeometryChange() {
// Scroll or resize can invalidate viewport rectangles used for hit detection.
rectsDirty = true;
if (dragging) {
scheduleUpdate();
}
}
dragHandle.addEventListener('pointerdown', onPointerDown);
window.addEventListener('pointermove', onPointerMove);
window.addEventListener('pointerup', onPointerUp);
window.addEventListener('scroll', onGeometryChange, { passive: true });
window.addEventListener('resize', onGeometryChange);
returnfunctiondestroy() {
// Remove every listener installed by this controller.
dragHandle.removeEventListener('pointerdown', onPointerDown);
window.removeEventListener('pointermove', onPointerMove);
window.removeEventListener('pointerup', onPointerUp);
window.removeEventListener('scroll', onGeometryChange);
window.removeEventListener('resize', onGeometryChange);
// Cancel orphan animation work that may still be waiting for the next paint.if (rafId !== null) {
cancelAnimationFrame(rafId);
}
// Release cached references and reset interaction state.
rafId = null;
scheduled = false;
dragging = false;
rects = [];
rectsDirty = true;
};
}
Why Interviewers Ask This
Interviewers ask this to see whether I can prove a browser rendering problem before changing code. They want to know whether I understand the dependency between geometry reads and style writes, how repeated reads after pending writes can force synchronous browser work, and how to reorganize the interaction into measurement and mutation phases. They also want to see whether I can schedule visual work with requestAnimationFrame, keep hit detection correct after scrolling or resizing, compare the same workload before and after the change, and remove listeners and pending animation callbacks during teardown.
Common interview mistakes
One mistake is changing code before proving that repeated rendering synchronization is the real bottleneck. Another is moving the original mixed read and write loop into requestAnimationFrame and assuming the problem is solved. requestAnimationFrame controls scheduling, but it does not remove a read and write dependency inside the callback. Another mistake is caching rectangles without invalidating them after relevant scrolling, resizing, zooming, content changes, or visual changes that alter the intended hit areas. Mixing viewport coordinates from getBoundingClientRect with page coordinates also breaks hit detection. Comparing a different drag workload before and after weakens the evidence. Finally, leaving listeners or a pending animation callback active after teardown can retain references and perform unnecessary work.
Interview tip
Explain the evidence and dependency first. Show that the trace contains repeated rendering work around an alternating geometry read and style write pattern. Then state the targeted change: batch all reads, batch all writes, and schedule at most one visual update with requestAnimationFrame. Finish with the same before and after measurement, hit detection tests after scroll and resize, and complete listener and animation callback cleanup.
Interviewer may ask next
What would you check if forced reflow warnings fall but hit detection becomes wrong while scrolling during the drag?
I would treat that as a failed optimization because the exact workload includes correct hit detection during the same drag. getBoundingClientRect returns viewport relative rectangles, and clientX and clientY are also viewport relative. If cached rectangles become stale when scrolling changes the target positions, I would mark the cache stale on the relevant scroll event and refresh it before the next required hit test. If scrolling happens inside a nested scroll container, I would observe that container rather than relying only on window scrolling. The tradeoff is measurement frequency. More frequent measurement costs more main thread time, while stale measurements can select the wrong target.
Would a Web Worker be a better solution if the drag is still slow after the reads and writes are batched?
Not for the DOM measurement and style mutation part of this workload. getBoundingClientRect and style.transform require access to the browser document and must remain on the main thread. I would record the same drag again and identify the remaining cost before changing the concurrency model. If a separate pure JavaScript calculation becomes the measured bottleneck, that calculation may be suitable for a Web Worker. The tradeoff is worker startup, message transfer, extra memory, synchronization, and maintenance complexity. I would not move work to a worker unless the trace shows that independent computation is now the important bottleneck.
More questions load as you scroll
Disclaimer: This interview guide is for educational and informational purposes only. It is designed to help readers prepare, but it does not guarantee any interview result, hiring decision, offer, or outcome. Interview questions, hiring criteria, and preferred answers can vary by employer, interviewer, industry, location, and time. All answers, examples, and explanations in this guide are suggested examples for interview preparation, not definitive answers or instructions for professional practice. They are based on research and judgment, are provided without warranties of any kind, and should be adapted to the question, role, and applicable laws and professional requirements. Diagrams are simplified illustrations intended to highlight the main concepts and their relationships; actual situations, systems, and practices may be more complex. Alternative approaches may be equally valid or better suited to a particular question, context, or interviewer. To the fullest extent permitted by applicable law, the contributors and publisher are not liable for decisions made, actions taken, or losses incurred based on this guide.
State Laws and Professional Responsibilities: Laws and requirements governing an occupation vary by state and jurisdiction. You are responsible for checking the current laws, licensing requirements, and scope-of-practice rules that apply to your location and role, and for ensuring that your answers and actions comply with them. Adapt examples in this guide to those requirements. This guide is not legal advice.
Content Accuracy and Verification: To the fullest extent permitted by applicable law, we do not represent or warrant that interview guides, questions, answers, examples, or diagrams are accurate, complete, current, error-free, or suitable for any particular purpose. You are responsible for independently reviewing and verifying the information before relying on it.