This interview guide is for educational and informational purposes only. It is designed to help readers prepare, but it does not guarantee any interview result, hiring decision, offer, or outcome. Interview questions, hiring criteria, and preferred answers can vary by employer, interviewer, industry, location, and time. All answers, examples, and explanations in this guide are suggested examples for interview preparation, not definitive answers or instructions for professional practice. They are based on research and judgment, are provided without warranties of any kind, and should be adapted to the question, role, and applicable laws and professional requirements. Diagrams are simplified illustrations intended to highlight the main concepts and their relationships; actual situations, systems, and practices may be more complex. Alternative approaches may be equally valid or better suited to a particular question, context, or interviewer. To the fullest extent permitted by applicable law, the contributors and publisher are not liable for decisions made, actions taken, or losses incurred based on this guide.
State Laws and Professional Responsibilities
Laws and requirements governing an occupation vary by state and jurisdiction. You are responsible for checking the current laws, licensing requirements, and scope-of-practice rules that apply to your location and role, and for ensuring that your answers and actions comply with them. Adapt examples in this guide to those requirements. This guide is not legal advice.
Identity, Image, and Privacy Notice
To respect individual privacy, some names, profile photographs, avatars, biographical details, and other identifying information displayed in this guide may be replaced with pseudonyms, licensed stock images, illustrative avatars, composite images, or representative descriptions. Unless a person is expressly identified as an actual contributor, a displayed name, image, or profile should not be understood as depicting or identifying a specific candidate, interviewer, employee, or other real individual. These representations are provided for editorial and illustrative purposes only and do not imply endorsement, employment, participation, or affiliation with this guide or any company mentioned in it. Any resemblance to an actual person is coincidental.
Company Notice
This guide is an independent educational resource and is not affiliated with, endorsed by, sponsored by, or approved by the company named in this guide. Company names identify reported interview experiences or the employer context of clearly labeled original practice exercises. Interview practices can change without notice, and inclusion of company-specific content does not mean these questions are official, complete, or guaranteed to be asked. To the fullest extent permitted by law, the author, contributors, and publisher are not responsible for outcomes related to use of this material.
Content Accuracy and Verification
To the fullest extent permitted by applicable law, we do not represent or warrant that interview guides, questions, answers, examples, or diagrams are accurate, complete, current, error-free, or suitable for any particular purpose. You are responsible for independently reviewing and verifying the information before relying on it.
Questions or comments?
Contact us for general questions, or share feedback, technical corrections, and comments with the community.
11. How does structured data differ from unstructured data?Data AnalysisEasy
i Question Details
Contrast tabular records with text or images and explain how their organization affects analysis.
Short Interview Answer (30-60 seconds)
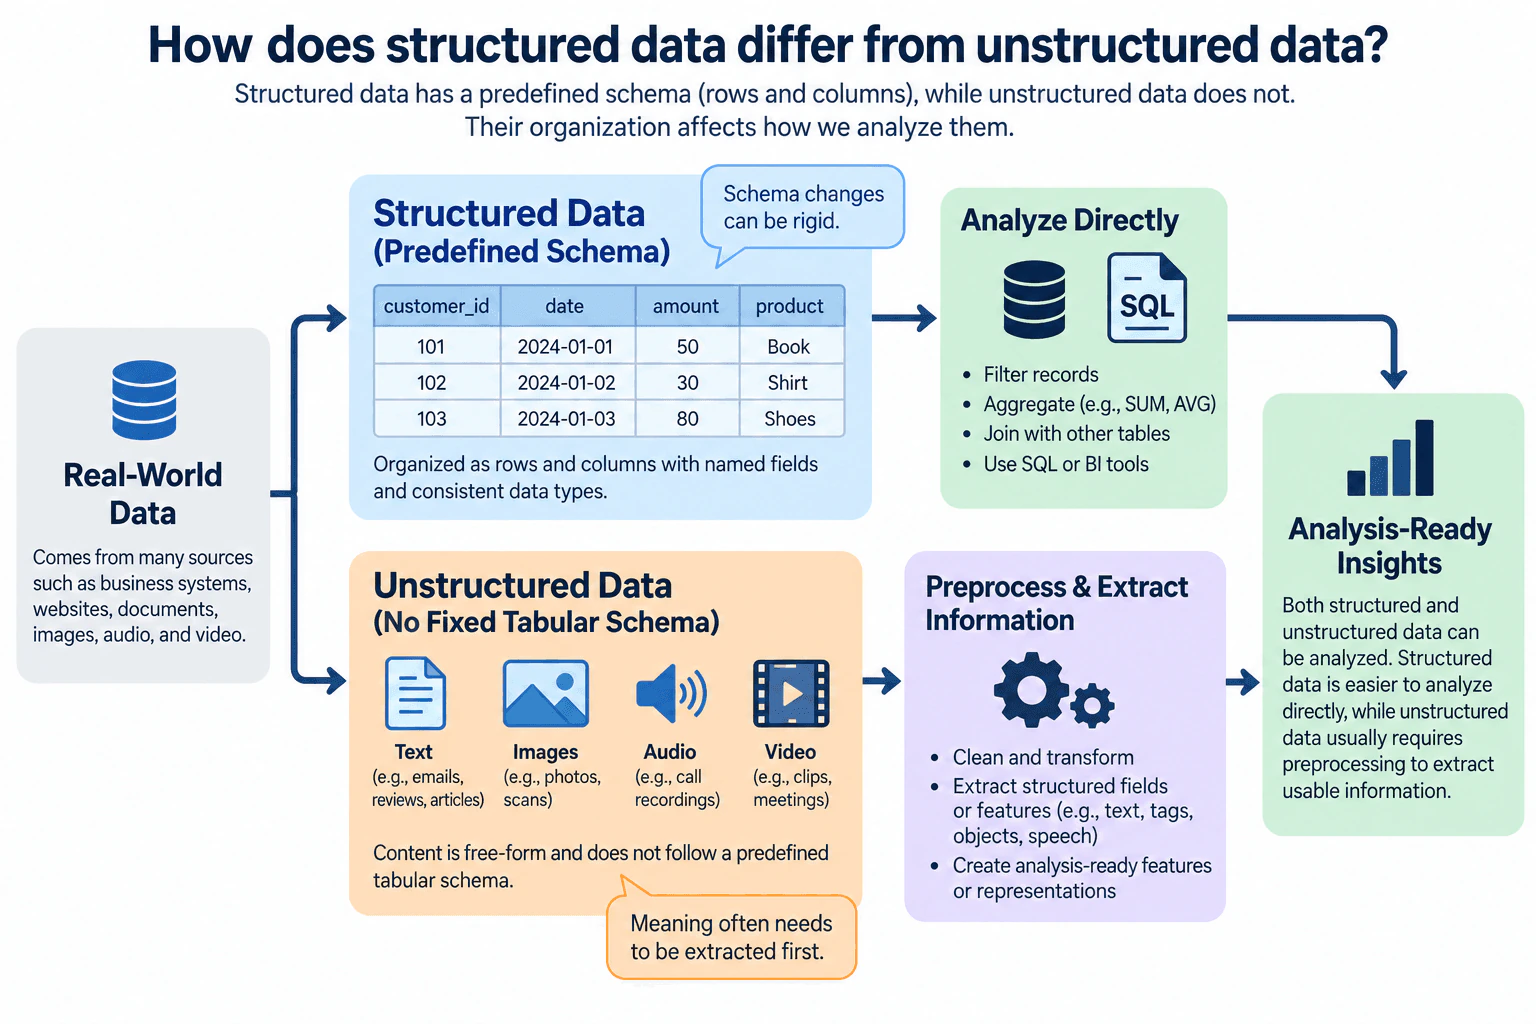
Structured data has a predefined organization, such as rows and columns with named fields and consistent data types. That makes it straightforward to filter, aggregate, join, and analyze directly with tools such as SQL. Unstructured data includes free-form content such as text, images, audio, and video. It does not follow a fixed tabular schema, so analysts usually preprocess it and extract useful fields, features, or representations first. Both can produce analysis-ready insights, but the path to analysis is different.
Detailed Explanation
Structured and unstructured data mainly differ in how their information is organized. Structured data follows a predefined schema, so each record has expected fields and data types. A table is a common example. This makes filtering, joining, and aggregation straightforward. Unstructured data contains free-form content such as text, images, audio, or video, so useful meaning is not already arranged into fixed columns. Analysts often clean or transform that content and extract useful fields, features, or representations before analysis. Both types can support decisions, but unstructured data usually requires more preparation.
Useful Questions to Ask the Interviewer
Are you asking mainly about the data format, or also how each type changes the analysis workflow?
Should I include examples of how analysts preprocess and extract information from unstructured data?
Do you want me to discuss semi-structured data as a related case, or focus only on structured and unstructured data?
How to Explain It in an Interview
Start with the organization of the data. Structured data has a predefined schema. Records are commonly represented with named fields, consistent data types, and a known row structure. In the diagram, the structured example is a table with fields such as customer_id, date, amount, and product. Because each field already has a defined role, an analyst can usually move to the Analyze Directly stage and perform operations such as filtering records, aggregating values with functions such as SUM or AVG, joining tables, and using SQL or BI tools.
Unstructured data does not have a fixed tabular schema. The diagram shows text, images, audio, and video as examples. The information exists inside the content, but the meaning needed for analysis may not already be stored in predefined fields. For example, useful information could be words in a document, objects in an image, or speech in an audio recording.
That difference changes the workflow. The unstructured-data path goes through Preprocess & Extract Information before reaching Analysis-Ready Insights. An analyst may clean and transform the source, extract fields or features such as text, tags, objects, or speech, and create analysis-ready features or representations. These representations do not always need to become a traditional relational table; they only need to expose the information required for the analytical task.
The important point is that neither type is automatically better. Structured data is easier to query consistently because its organization is defined in advance, although schema changes can be rigid and may require updates to pipelines or downstream analysis. Unstructured data is flexible enough to capture rich real-world content, but extracting reliable meaning usually requires additional processing, validation, computation, and sometimes specialized techniques.
Before using either type, I would validate the inputs. For structured data, I would check field definitions, data types, row grain, nulls, duplicates, and whether joins or aggregations preserve the intended population. For unstructured data, I would also validate whether preprocessing or feature extraction loses important context, produces inconsistent representations, or misinterprets the source content.
The final conclusion is the same as the diagram's flow: structured data can often move directly into analysis because its schema is predefined, while unstructured data usually needs preprocessing and information extraction first. Both paths can lead to Analysis-Ready Insights, but they have different preparation costs, risks, and validation needs.
Technical Approach
Identify whether the source follows a predefined schema with known fields and data types.
If it is structured, validate the row structure, field definitions, nulls, duplicates, and relationships before filtering, aggregating, joining, or querying it.
If it is unstructured, identify which information the business question requires from the text, image, audio, or video content.
Clean or transform the content as needed.
Extract relevant fields, features, or representations and validate them against the source.
Use the resulting analysis-ready information to produce insights.
Practical Insights
Structured data is usually faster and simpler to analyze because fields are already organized and can often be queried directly. Unstructured data usually adds preparation cost because text, images, audio, or video must be processed to expose useful information. The exact time and computing cost depend on the data volume, format, extraction method, and quality requirements. Structured data also has a tradeoff: changing an established schema can require updates to pipelines and downstream analysis.
Why Interviewers Ask This
Interviewers want to see whether you understand how data organization affects preparation, querying, analysis methods, validation, and the effort needed to turn raw information into useful insights.
Common interview mistakes
Common mistakes are saying that unstructured data has no organization at all, assuming it cannot be analyzed, claiming it must always be converted into a traditional table, or suggesting that structured data requires no cleaning. Another mistake is treating the distinction as only a storage issue; the important analytical difference is how much structure is available before analysis and what preparation is needed to produce reliable insights.
Interview tip
Lead with the schema difference, give one tabular example and one text-or-image example, then explain the workflow: structured data can usually be analyzed directly, while unstructured data generally needs preprocessing and information extraction first. Finish by noting that both can produce analysis-ready insights.
Interviewer may ask next
Can structured data still require significant preprocessing before analysis?
Yes. A predefined schema makes the data organized, but it does not guarantee quality. Structured data can still contain missing values, duplicates, incorrect data types, inconsistent definitions, stale records, invalid joins, or the wrong row grain. I would validate those issues before trusting the analysis.
What changes if most useful business information is stored as text, images, audio, or video instead of tables?
The workflow becomes more dependent on preprocessing and information extraction. I would first define exactly what information the decision requires, then clean or transform the source and extract suitable fields, features, or representations. I would validate those results against the original content because extraction errors can directly affect downstream findings. This usually adds more processing cost and uncertainty than working with already structured fields.
12. How is a monthly customer churn rate calculated?Data AnalysisEasy
i Question Details
Calculate monthly customer churn for a month beginning with 500 customers in which 25 customers leave.
Short Interview Answer (30-60 seconds)
Monthly customer churn rate is usually calculated as the number of customers who leave during the month divided by the number of customers at the beginning of the month, multiplied by 100. Here, 25 customers leave out of the 500 customers present at the start. So the churn rate is (25 / 500) × 100 = 5%. Assuming those 25 customers were part of the starting customer base and meet the agreed definition of churn, the monthly customer churn rate is 5%.
Detailed Explanation
Monthly customer churn measures the percentage of customers who were present at the beginning of a month and stopped being customers during that month. The standard calculation is customers lost during the month divided by customers at the beginning of the month, multiplied by 100. In this example, the business starts with 500 customers and 25 leave. Therefore, 25 ÷ 500 = 0.05, and 0.05 × 100 = 5%. The monthly customer churn rate is 5%, assuming all 25 departures came from the starting customer population and meet the agreed churn definition.
Useful Questions to Ask the Interviewer
What exactly counts as a churned customer: cancellation, expiration, inactivity, or another business rule?
Are all 25 customers who left part of the 500 customers present at the beginning of the month?
Should customers who join during the month be excluded from this churn calculation?
Are there any special cases, such as reactivated customers or temporary cancellations, that should be handled differently?
How to Explain It in an Interview
I would first define the metric because the numerator, denominator, and time window must be clear before calculating the KPI.
Monthly customer churn rate = (Customers lost during the month ÷ Customers at the beginning of the month) × 100
The numerator is 25 because 25 customers left during the month. The denominator is 500 because those are the customers present at the beginning of the measurement window and therefore the starting population at risk of churning.
The calculation is:
25 ÷ 500 = 0.05
0.05 × 100 = 5%
So the monthly customer churn rate is 5%.
A key assumption is that the 25 customers who left were members of the original group of 500. Customers acquired during the month are not added to the denominator for this standard beginning-of-period churn calculation because they were not part of the starting population. If a company uses a different churn definition, that definition should be documented and applied consistently.
I would validate the result by confirming that the 500 starting customers are unique eligible customers, that each of the 25 churn events belongs to that starting population, and that no customer is counted more than once. I would also verify month boundaries so a cancellation is assigned to the correct reporting period.
The 5% result is descriptive: it tells us what happened during the month. It does not tell us why customers left and does not prove that any particular business factor caused the churn. If the business wanted to investigate the reason, I could drill down by meaningful customer segments or cohorts and compare their churn rates.
To decide whether 5% is good or bad, I would compare it with a relevant baseline or target calculated using the same metric definition. For example, comparing the rate consistently across prior months can show whether churn is increasing, decreasing, or stable. Any retention action should be based on that comparison and further evidence rather than treating one month's 5% churn rate as automatically good or bad.
Technical Approach
Define exactly what counts as a churned customer during the month.
Identify the eligible customer population at the beginning of the month: 500 customers.
Confirm that the 25 customers who left came from that starting population.
Multiply by 100 to convert the result to a percentage: 5%.
Validate unique customer counts, churn rules, duplicates, and reporting-period boundaries before reporting the KPI.
Practical Insights
The arithmetic itself is constant-time because it only requires two counts: starting customers and churned customers. In a real dataset, most of the work is correctly identifying the starting population and churn events. If there are n customer records or events, processing them can take about O(n) time. The important tradeoff is not calculation speed but metric accuracy: inconsistent customer definitions, duplicate records, or incorrect date boundaries can produce a misleading churn rate.
Why Interviewers Ask This
Interviewers want to see whether the candidate can define a business metric correctly, choose the correct numerator and denominator, calculate it accurately, and explain what the result means without confusing customer churn with acquisition, retention, or revenue churn.
Common interview mistakes
Common mistakes include dividing by the ending customer count instead of the starting customer count, adding customers acquired during the month to the denominator without changing the metric definition, counting a customer more than once, including customers who were not part of the starting population, mixing customer churn with revenue churn, and applying inconsistent definitions of what qualifies as churn.
Interview tip
State the formula first, identify the numerator and denominator, calculate 25 ÷ 500 × 100 = 5%, and mention the key assumption that the 25 churned customers came from the 500 customers present at the start of the month.
Interviewer may ask next
What if 100 new customers joined during the same month? Should they be added to the denominator?
Not for the standard beginning-of-period churn calculation used here. The denominator remains the 500 customers present at the start of the month because that is the starting population at risk of churning. If 25 of those customers leave, the churn rate remains 25 ÷ 500 × 100 = 5%. The 100 new customers can be tracked separately as customer acquisition. If the business uses another churn formula, its numerator and denominator should be explicitly defined and used consistently.
Can we conclude from a 5% monthly churn rate that customer retention is poor?
No. The 5% value only describes the percentage of the starting customer population that churned during this month. To judge whether it is high or low, I would compare it with a relevant historical baseline or an agreed business target calculated using the same churn definition. I could also compare meaningful customer segments or cohorts. The overall 5% rate alone does not explain why customers churned or whether a particular retention action is needed.
13. What does customer lifetime value measure, and how would you estimate it?Data AnalysisEasy
i Question Details
Discuss the purchase-value, purchase-frequency, and customer-lifespan components of a customer lifetime value estimate.
Short Interview Answer (30-60 seconds)
Customer lifetime value measures the total value a customer is expected to generate over the relationship with the business. A simple estimate is average purchase value multiplied by purchase frequency and average customer lifespan. I would make sure those components use consistent time units and a clearly defined customer population. I would also check whether the business wants revenue-based or profit-based CLV, examine retention and cohort differences, validate the estimate against observed customer histories, and communicate that CLV is an estimate that depends on assumptions about future behavior.
Detailed Explanation
Customer lifetime value, or CLV, is an estimate of how much economic value a customer contributes during the full relationship with a business. A simple version combines three ideas: how much the customer spends in a typical purchase, how often the customer purchases, and how long the customer remains active. The basic estimate is average purchase value × purchase frequency × average customer lifespan. Before calculating it, I would define the customer population, time period, currency, and whether value means revenue or profit, because those choices materially change the result.
Useful Questions to Ask the Interviewer
Should CLV represent revenue, gross profit, or another definition of customer value?
What defines an active customer and when should a customer be considered inactive or churned?
What time unit should purchase frequency and customer lifespan use, such as months or years?
Should I estimate one overall CLV or compare meaningful customer segments or acquisition cohorts?
Do we have enough historical customer and transaction data to observe repeat purchases and customer lifespan reliably?
How to Explain It in an Interview
I would start with the business decision. CLV can support decisions such as comparing customer segments, evaluating acquisition economics, or understanding how retention affects long-term customer value. The exact use matters because it determines whether a simple historical estimate is enough or whether a more predictive model is needed.
First, I would define the metric before exploring the data. In a simple revenue-based form:
CLV = average purchase value × purchase frequency × average customer lifespan
Average purchase value describes the typical amount associated with a purchase. I would calculate it using a clearly defined numerator and denominator, such as eligible purchase revenue divided by the number of eligible purchases over the selected observation window. I would define how refunds, cancellations, taxes, discounts, and other adjustments are treated rather than silently mixing them into the metric.
Purchase frequency describes how often a customer purchases during a defined unit of time. The denominator and time unit need to be explicit. For example, frequency per year cannot be multiplied directly by a lifespan measured in months without converting one of the units. I would also make sure multiple rows belonging to the same transaction do not accidentally inflate the purchase count.
Customer lifespan describes how long customers remain economically active. For customers whose full relationship is observable, it can be measured from an agreed starting event to an agreed ending or inactivity event. For customers who are still active, the full lifespan is not yet observed, so a simple historical average can be biased. Retention or cohort analysis can provide a better view when many customer relationships are still ongoing.
Next, I would identify the required data. At minimum, I would need a stable customer identifier, transaction identifier, transaction date, and a value field that matches the chosen CLV definition. I would check missing customer IDs, duplicate transactions, invalid dates, refunds or reversals, incomplete historical periods, and unusually large purchases. These checks matter because all three CLV components can be distorted by bad transaction history.
I would calculate the components at a consistent grain. Transaction-level data can be aggregated to customer-level measures such as total eligible value, number of purchases, first purchase date, and last relevant activity date. Then I would summarize those measures using definitions that match the business question. I would avoid mixing customer-level and transaction-level denominators because that can produce a mathematically valid-looking but incorrect estimate.
I would also look at segmentation or cohort analysis when customer behavior is not uniform. Customers acquired in different periods or belonging to meaningful business segments may have different purchase values, purchase frequencies, and retention patterns. One overall average can hide those differences. I would report segment-level estimates only when the groups have enough data and when the segmentation is relevant to the decision.
The simple multiplication formula is descriptive and assumes historical behavior is a reasonable basis for estimating future behavior. That assumption should be stated clearly. Changes in pricing, customer mix, product strategy, seasonality, or retention can make past averages poor predictors of future CLV. A more advanced approach could model future purchases or retention directly, but I would only add that complexity when the decision requires it and the data supports it.
I would also clarify whether the business wants revenue CLV or profit CLV. Revenue CLV measures expected revenue, while a profitability-focused estimate should incorporate an appropriate margin definition. For longer horizons, discounting future value may also be relevant because value received far in the future is not necessarily equivalent to value received today. These refinements should be based on the requested business definition rather than added automatically.
For validation, I would compare the estimated components with independently calculated control totals and inspect customer-level examples. I could also calculate CLV using earlier customer history and compare the estimate with value observed in a later period. If estimates change substantially under reasonable alternative assumptions about lifespan or retention, I would present that sensitivity rather than giving a falsely precise number.
Finally, I would communicate CLV as an estimate, not a guaranteed amount. I would state the definition, population, observation window, assumptions, major limitations, and relevant segment differences. The business action should be proportional to that evidence. After an action is taken, I would continue measuring purchase value, purchase frequency, retention, and realized customer value to see whether the assumptions behind the CLV estimate remain valid.
Technical Approach
Define the business decision and whether CLV means revenue, gross profit, or another economic value.
Define the eligible customer population, observation window, currency, activity rules, and time unit.
Calculate average purchase value using a clearly defined eligible-value numerator and eligible-purchase denominator.
Calculate purchase frequency using a consistent customer population and time unit.
Estimate customer lifespan using an agreed start and end or inactivity definition, while recognizing that active customers may have incomplete lifespans.
Combine the components as average purchase value × purchase frequency × average customer lifespan.
Compare meaningful segments or cohorts when behavior differs materially.
Validate calculations with control totals, customer-level checks, historical holdout comparisons, or sensitivity analysis.
Report the CLV estimate together with its assumptions, uncertainty, limitations, and the business decision it supports.
Practical Insights
The simple CLV formula is inexpensive to calculate once clean transaction and customer data are available. The main cost is usually defining the metric correctly and preparing trustworthy customer histories. A simple average is easy to explain but can hide differences between customer groups and can be misleading when many customers are still active. Cohort, retention, or predictive approaches require more data and analysis but can better represent changing customer behavior. The analyst should choose the simplest method that is accurate enough for the business decision.
Why Interviewers Ask This
Interviewers want to see whether the candidate can define a business metric clearly, break it into measurable components, make assumptions explicit, use customer behavior data consistently, and explain how the estimate would support decisions without overstating its precision.
Common interview mistakes
Common mistakes include calling revenue CLV profit, mixing time units between purchase frequency and lifespan, counting transaction-line rows as separate purchases, using an unclear definition of an active customer, ignoring refunds or duplicate transactions, estimating lifespan only from customers whose relationships have already ended, applying one average to very different customer cohorts, treating historical averages as guaranteed future behavior, and reporting excessive precision without testing how sensitive the result is to assumptions.
Interview tip
Define CLV first, then explain the three components in the same order as the formula. Make the time units and revenue-versus-profit definition explicit, mention one or two important data-quality checks, and finish by explaining how you would validate the estimate and use it for a business decision.
Interviewer may ask next
How would you estimate customer lifespan if many customers are still active and have not yet churned?
I would avoid treating the current observed age of active customers as their completed lifespan. Their relationships are censored because the ending event has not happened yet. I would define an activity or churn rule, examine retention by customer age or acquisition cohort, and estimate how survival or retention changes over time. If the data is limited, I could use a simpler cohort-based assumption, but I would show how sensitive CLV is to that assumption and compare the estimate with later observed behavior when more history becomes available.
How would your approach change if the business cared about customer profitability rather than customer revenue?
I would change the value component so it represents the agreed economic contribution rather than raw revenue. For example, if the business defines value using gross profit, the purchase-value component should use the corresponding margin-adjusted value consistently. I would confirm which costs belong in that definition instead of inventing a margin rule. For a long forecast horizon, I would also ask whether future value should be discounted. The purchase-frequency and lifespan logic can remain similar, but the resulting CLV should be labeled clearly as profit-based rather than revenue-based.
14. What is the purpose of exploratory data analysis?Data AnalysisEasy
i Question Details
Explain how exploratory data analysis of distributions and relationships helps an analyst decide what to investigate next.
Short Interview Answer (30-60 seconds)
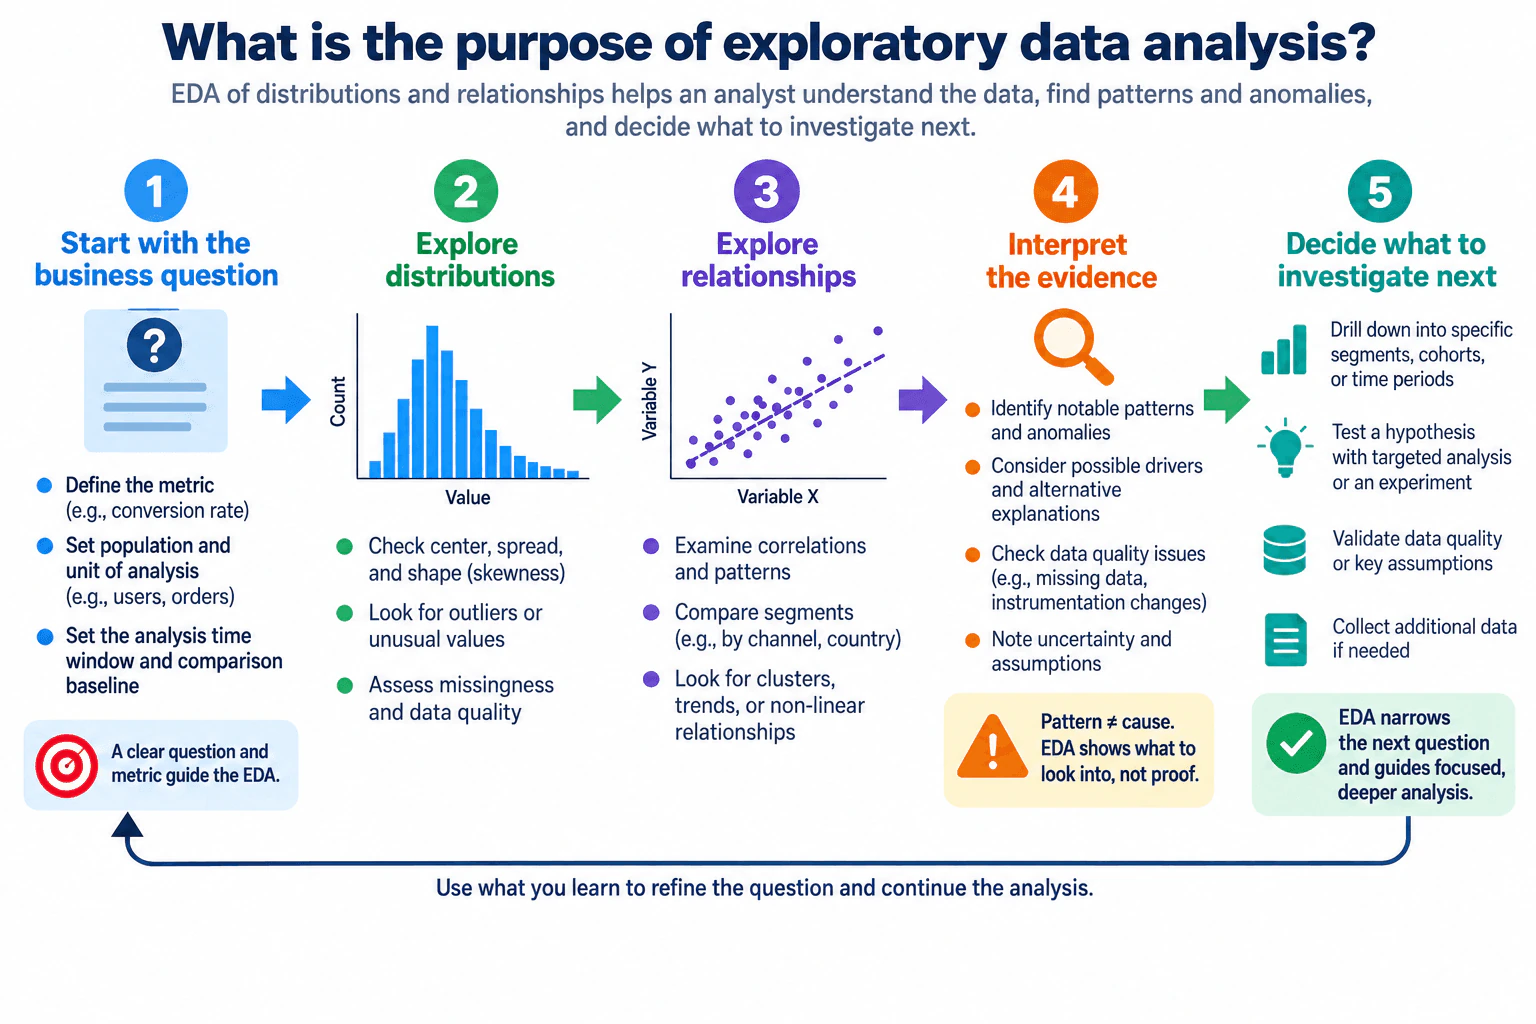
Exploratory data analysis helps me understand what is happening in the data and decide what to investigate next. I start with the business question and a clearly defined metric. Then I examine distributions for center, spread, skewness, missing values, and outliers, and relationships for correlations, clusters, segment differences, or nonlinear patterns. I interpret those observations carefully because correlation does not prove causation. The result of EDA is usually a more focused question, a hypothesis to test, a data-quality check, or a deeper analysis.
Detailed Explanation
Exploratory data analysis, or EDA, is the process of examining data before making strong conclusions. Its purpose is to understand what the data looks like, discover useful patterns, find unusual observations or data-quality problems, and decide what should be investigated next. An analyst typically studies distributions to understand center, spread, shape, missingness, and outliers, then studies relationships to see how variables or meaningful segments move together. These observations can suggest possible explanations and hypotheses, but they do not by themselves prove cause and effect. EDA therefore turns a broad business question into a more focused analysis.
Useful Questions to Ask the Interviewer
What business question or decision should this analysis support?
Which metric or KPI should I explore, and how is it defined?
What population and unit of analysis should I use?
What time window and comparison baseline matter for the decision?
Are there important segments, cohorts, or dimensions I should compare?
Are there known data-quality or instrumentation issues?
How to Explain It in an Interview
I would describe EDA as an iterative learning process.
First, I start with the business question rather than immediately choosing a tool or chart. I clarify the metric, population, unit of analysis, time window, and comparison baseline so I know what each observation represents. For a rate or KPI, I also confirm the numerator and denominator before interpreting it.
Second, I explore distributions of individual measures. A histogram or similar view helps reveal the typical range, center, spread, skewness, unusual values, and possible outliers. I also check missing values, duplicates, data freshness, and instrumentation issues because an apparent pattern can be caused by bad or incomplete data.
Third, I explore relationships between variables. A scatter plot can show whether two variables appear to move together, whether there are clusters, whether the relationship looks linear or nonlinear, and whether particular observations stand out. I can also compare meaningful segments, cohorts, or time periods when those comparisons are relevant to the business question.
Fourth, I separate observation from interpretation. For example, observing that two variables are associated is evidence of a pattern. Saying why they move together is a possible explanation that needs more evidence. EDA can suggest likely drivers and alternative explanations, but correlation alone does not establish causation. I also note uncertainty and assumptions before making a recommendation.
Finally, I use the findings to choose the next investigation. I may drill down into a segment, investigate an outlier, validate a data-quality assumption, collect additional data, perform a more focused root-cause analysis, or test a hypothesis with a targeted analysis or experiment. What I learn then feeds back into the original question, helping me refine it and continue the analysis.
The key idea is that EDA is not just about producing charts. It reduces uncertainty about the data, exposes issues and patterns worth studying, and helps an analyst focus deeper analytical work on the questions most likely to matter.
Technical Approach
Clarify the business question and decision.
Define the metric, population, unit of analysis, time window, and comparison baseline.
Validate data quality, including missingness, duplicates, freshness, instrumentation, and unusual values.
Explore distributions for center, spread, shape, skewness, and outliers.
Explore relationships and meaningful segment differences for correlations, clusters, trends, or nonlinear patterns.
Separate observed evidence from assumptions and possible causes.
Note uncertainty and alternative explanations.
Choose the next focused investigation, validation, drill-down, or hypothesis test.
Use the new evidence to refine the business question and continue the analysis.
Practical Insights
EDA usually trades speed for depth. Simple summaries and charts can quickly expose important patterns, while additional segment, cohort, or relationship checks require more computation and analyst time. The practical cost depends on the amount of data, number of variables, number of segments, and number of comparisons explored. More exploration can uncover useful issues, but too many unguided comparisons can waste time or surface misleading patterns, so the work should stay tied to the business question.
Why Interviewers Ask This
The interviewer wants to know whether you understand EDA as a decision-guiding process rather than simply a collection of charts. A strong answer should show that you can define the business question and metric, inspect distributions and relationships, recognize data-quality issues and uncertainty, avoid confusing correlation with causation, and use what you learn to choose the next analysis.
Common interview mistakes
Common mistakes are starting with charts before defining the business question or metric, ignoring the population or denominator behind a KPI, overlooking missing values, duplicates, freshness, or instrumentation issues, treating outliers as errors without investigating them, examining relationships without checking meaningful segments, confusing correlation with causation, inventing a root cause from an observed pattern, and stopping after describing the data instead of stating what should be investigated next.
Interview tip
Use a simple flow: business question -> define the metric and scope -> inspect distributions -> inspect relationships and segments -> check data quality and uncertainty -> decide the next investigation -> refine the question and continue. Explicitly say that EDA finds patterns and hypotheses, not proof of causation.
Interviewer may ask next
What would you do if an apparent relationship disappears after you segment the data?
I would treat that as evidence that the aggregate relationship may be hiding important differences between groups. I would verify that the segment definitions, sample sizes, metric definitions, and data quality are sound, then compare the relationship within each meaningful segment. I would not claim a cause from either the aggregate or segmented pattern. Instead, I would use the result to refine the hypothesis and investigate which variables or group differences could explain the change.
What is a limitation of exploratory data analysis when you examine many variables and relationships?
A major limitation is that exploring many combinations can produce patterns that look interesting simply by chance, especially when the analyst keeps searching until something appears unusual. EDA is therefore best for generating and prioritizing questions, not proving them. I would record the exploratory finding, consider alternative explanations and data-quality issues, and validate important hypotheses with an independent analysis, additional data, or an appropriately designed statistical test or experiment.
15. How can cohort analysis help explain customer retention problems?Data AnalysisMedium
Short Interview Answer (30-60 seconds)
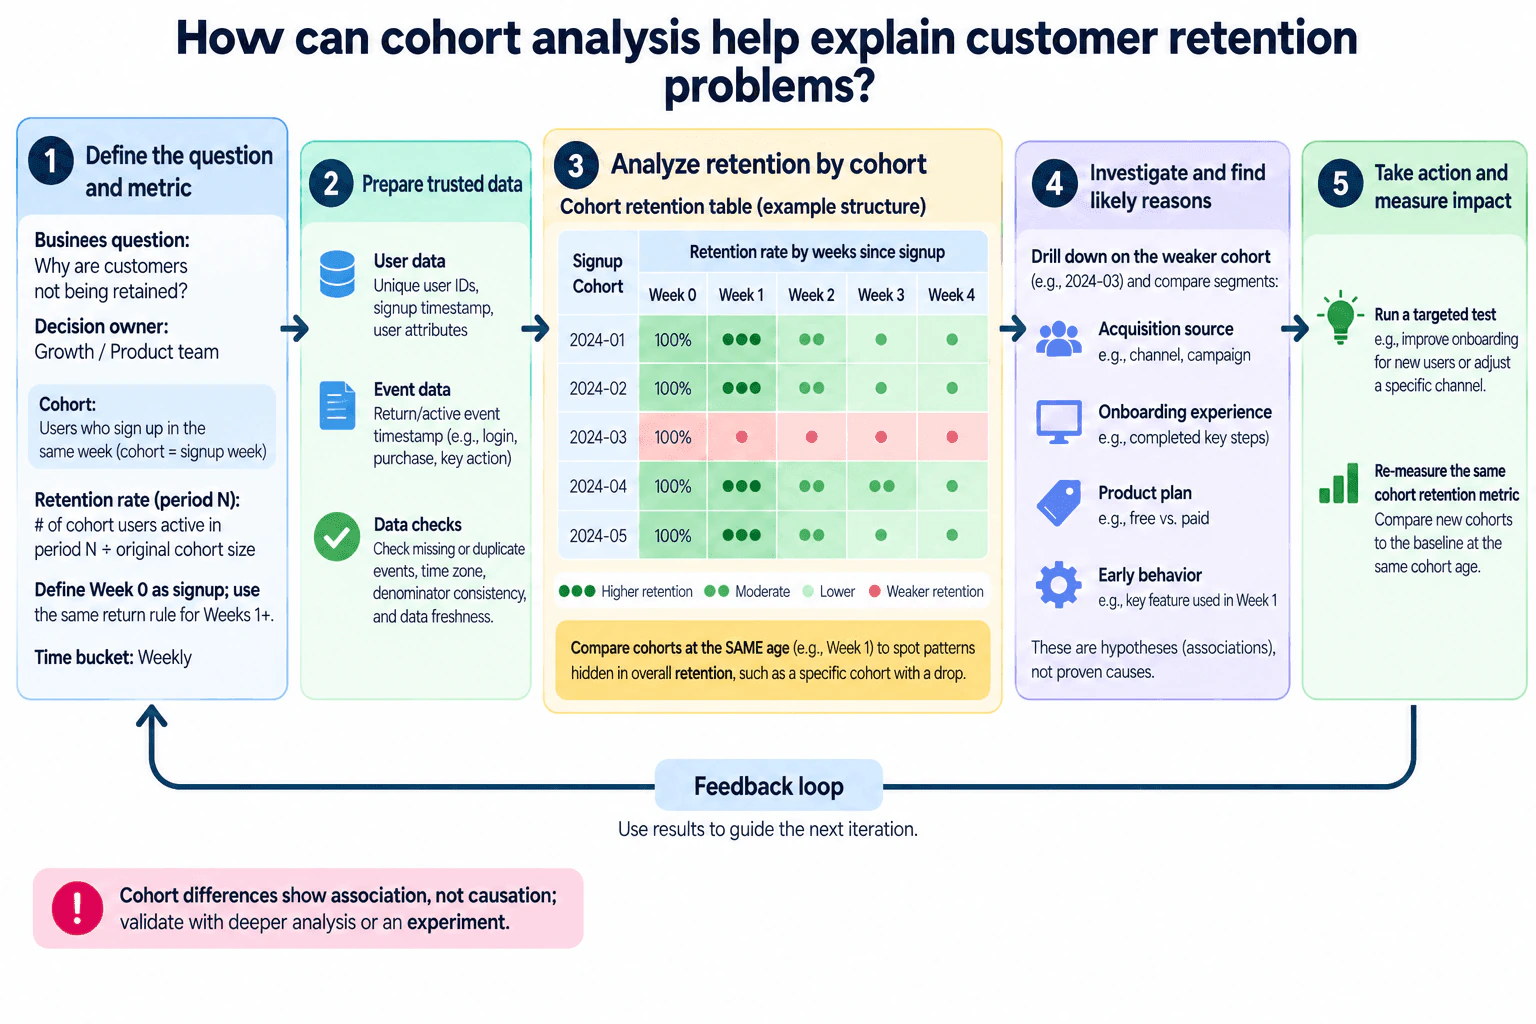
Cohort analysis helps explain retention problems by grouping customers who signed up in the same period and comparing their retention at the same age, such as Week 1 or Week 4. I would first define the retention metric and cohort rule, validate user and event data, then build a cohort retention table. If one signup cohort is weaker, I would drill down by acquisition source, onboarding experience, plan type, or early behavior. Those differences are associations, not proof of cause, so I would validate the hypothesis with deeper analysis or a targeted test and then re-measure the same retention KPI.
Detailed Explanation
Cohort analysis helps separate a general retention problem into specific customer groups and points in time. Instead of looking only at one overall retention rate, I group customers by the period when they signed up and compare each group at the same age, such as Week 1 or Week 4. This can reveal whether one cohort is weaker than others and when the drop appears. I then investigate relevant segments and behaviors, treat those patterns as hypotheses rather than causes, test an appropriate action, and measure whether retention improves for comparable new cohorts.
Useful Questions to Ask the Interviewer
What business decision should this analysis support, and who owns that decision?
How do we define an eligible customer and the signup event that assigns the cohort?
What counts as being retained in a given week: login, purchase, another key action, or any activity?
Should retention be measured weekly, and which time zone defines the week boundaries?
Which dimensions are available for investigation, such as acquisition source, plan type, region, onboarding completion, or early product behavior?
Are there known tracking changes, missing events, duplicate events, or data freshness issues during the analysis window?
How to Explain It in an Interview
I would start from the business question: why are customers not being retained, and what decision will the analysis support? The first step is to define the metric before exploring the data.
For a weekly signup cohort, each customer belongs to the week in which they signed up. Week 0 is the signup period. For Weeks 1 and later, I would use one consistent return rule. The retention rate for period N is:
retention rate = number of cohort users active in period N ÷ original cohort size
The denominator stays tied to the original cohort so that each period is comparable. I would also define the eligible population, customer-level grain, weekly time bucket, and time zone before calculating anything.
Next, I would prepare trusted inputs. I need a unique customer identifier, signup timestamp, activity-event timestamp, and any dimensions used for drill-down. Before interpreting the result, I would check missing or duplicate events, denominator consistency, time-zone handling, event freshness, and whether instrumentation changed during the period. A tracking problem can look like a retention problem, so these checks matter.
Then I would build a cohort retention table. Rows represent signup cohorts and columns represent weeks since signup. Week 0 is the starting cohort, and later columns show the share of that original cohort that satisfies the defined activity rule. The important comparison is between cohorts at the same age. For example, I should compare one cohort's Week 1 retention with another cohort's Week 1 retention rather than comparing a new cohort's Week 1 with an older cohort's Week 4.
This is where cohort analysis becomes useful. An overall retention KPI can hide a localized problem. If one signup cohort is much weaker than neighboring cohorts at the same age, I know the issue may be associated with something that changed around that cohort. If several recent cohorts are consistently weaker, the pattern may indicate a broader change in customer mix, onboarding, product experience, plan mix, acquisition strategy, or instrumentation.
After finding the weaker cohort, I would drill down only on meaningful dimensions. Examples include acquisition source, onboarding experience or completion, plan type, region, or early product behavior. I would ask whether the weaker cohort has an unusual mix of those dimensions and whether retention remains weaker after comparing like-for-like groups.
I would clearly separate observation from interpretation. The descriptive finding might be that a particular cohort has lower retention at the same lifecycle age. The diagnostic hypothesis might be that acquisition mix, onboarding friction, plan mix, or early product behavior contributed to the difference. Cohort analysis alone does not prove that any of those factors caused the drop. Changes can be correlated with retention without being causal, and other explanations such as seasonality, customer mix, product changes, or data-quality issues may exist.
I would validate the hypothesis with deeper analysis and, when appropriate, a targeted test. For example, if onboarding appears related to the weak cohort, the team could test an onboarding improvement for eligible new customers. I would then re-measure the same cohort retention metric and compare new cohorts with an appropriate baseline at the same cohort age.
The final recommendation should be proportional to the evidence. I would present the weak cohort, the lifecycle period where the gap appears, the most supported associations, the main limitations, the action to test, and the KPI used to judge impact. If later cohorts do not improve, I would revise the hypothesis and continue the feedback loop rather than treating the first explanation as final.
Technical Approach
Define the business decision, eligible population, customer grain, cohort rule, retention event, denominator, weekly window, time zone, and comparison baseline.
Validate unique customer IDs, signup timestamps, activity events, missingness, duplicates, instrumentation consistency, denominator consistency, and data freshness.
Assign each customer to a signup-week cohort and define Week 0 as signup.
Calculate retention for Weeks 1+ as cohort users active in the period divided by the original cohort size.
Compare cohorts at the same age to identify weaker cohorts and the point where the retention gap appears.
Drill down the weaker cohort by meaningful dimensions such as acquisition source, onboarding experience, plan type, region, or early behavior.
Separate observed associations from causal claims and check alternative explanations.
Form a testable hypothesis, run deeper analysis or a targeted test when appropriate, and re-measure the same retention KPI for comparable new cohorts.
Use the result as feedback to revise the action or investigation.
Practical Insights
The main cost is usually proportional to the number of customer and event records that must be processed. A simple cohort table is straightforward once the data is clean, but repeated segmentation can increase compute time and make interpretation harder. More dimensions can help locate a problem, but they also create smaller groups, more noise, and a greater risk of finding misleading patterns. The practical tradeoff is to start with a small set of business-relevant segments, validate the main pattern, and drill down further only when it changes the decision.
Why Interviewers Ask This
Interviewers want to see whether you can turn a broad retention problem into a well-defined cohort analysis, compare customers at the same lifecycle age, identify where retention differs, investigate plausible explanations without claiming causation, and recommend a measurable next action.
Common interview mistakes
Common mistakes include using an unclear retention definition, changing the denominator across periods, comparing cohorts at different lifecycle ages, mixing calendar time with time-since-signup, ignoring time-zone boundaries, overlooking missing or duplicate events, using dimensions with very small cohort sizes, treating a cohort-table pattern as proof of root cause, over-segmenting until a convenient pattern appears, and measuring the effect of an action with a different KPI or cohort definition than the original analysis.
Interview tip
Explain the analysis as a decision flow: define retention, validate the data, compare cohorts at the same age, drill into the weak cohort, separate association from causation, test the most plausible explanation, and re-measure the same KPI. That shows both analytical discipline and business judgment.
Interviewer may ask next
How would you handle a cohort that looks unusually weak but has very few customers?
I would avoid making a strong conclusion from the rate alone because a small denominator makes the estimate unstable. I would first verify the cohort size and data quality, then compare the pattern with neighboring cohorts and relevant segments. If the group is too sparse, I might combine adjacent periods only if that keeps the business meaning intact, or wait for more observations. I would communicate the uncertainty explicitly and avoid recommending a large intervention unless the pattern is supported by additional evidence.
What would you do if retention is lower for customers from one acquisition channel, but you cannot run an experiment?
I would treat the channel difference as an association, not a causal result. I would compare customers at the same cohort age and control the comparison through meaningful segmentation, such as plan, region, onboarding completion, or early behavior, if those fields are available and relevant. I would also check whether campaign mix, tracking changes, or customer composition changed over time. If the channel gap remains after those checks, I would present it as a stronger diagnostic hypothesis, recommend a proportional action such as deeper qualitative or behavioral analysis, and define what future evidence would confirm or reject the explanation.
16. Which metrics would you choose to evaluate a newly launched feature?Data AnalysisMedium
Short Interview Answer (30-60 seconds)
I would start with the goal of the feature because the right metrics depend on what success means. I would usually choose one primary outcome metric, such as successful completion of the intended action, then supporting adoption and engagement metrics plus guardrail metrics. I would define each numerator, denominator, eligible population, unit of analysis, time window, and baseline before analyzing the data. I would also compare meaningful segments and cohorts, verify instrumentation and data quality, and check whether the feature improves its intended outcome without harming broader measures such as retention, conversion, reliability, or customer experience.
Detailed Explanation
A newly launched feature should not be judged by one attractive number such as clicks. I would first understand what customer or business problem the feature is meant to solve and what decision the team needs to make. Then I would define a small set of metrics that show whether eligible users discover the feature, use it successfully, receive the intended value, and experience any negative side effects. I would compare those measures with an appropriate baseline, inspect meaningful segments and cohorts, verify the tracking data, and avoid claiming the feature caused a change unless the evaluation design supports that conclusion.
Useful Questions to Ask the Interviewer
What customer or business problem is this feature intended to solve?
What user action or outcome would indicate that the feature is successful?
Who is eligible to see or use the feature?
Was the feature launched to everyone, gradually rolled out, or tested against a control group?
What baseline or benchmark should we compare against?
How quickly would we expect the feature to create value: immediately or over a longer period?
Are there important guardrails such as retention, conversion, reliability, support issues, or customer satisfaction?
How to Explain It in an Interview
I would organize the analysis around the business decision instead of starting with a dashboard or tool.
First, I would define the intended outcome of the feature. A KPI is a measurable indicator tied to an important objective. If a feature is designed to help users complete a task, for example, the primary KPI should represent successful completion of that task rather than simply feature views. I would not choose the exact KPI until I understand what value the feature is supposed to create.
Next, I would define every metric before exploring the data. For a rate, I would specify the eligible population, numerator, denominator, unit of analysis, reporting window, and time zone. For example, an adoption rate could be defined conceptually as the number of eligible users who use the feature divided by the number of eligible users who had a genuine opportunity to use it during the same window. The exact definition would depend on how exposure and eligibility are tracked. This prevents two analysts from calculating a metric with the same name but different populations or denominators.
I would usually choose metrics in layers. The primary outcome metric answers whether the feature is delivering its intended value. Adoption metrics show whether eligible users discover and use it. Funnel metrics can show how users move from exposure to first use and then to successful completion. Engagement metrics can measure frequency or repeat use when repeat use is actually expected. Cohort analysis can show whether behavior persists for groups of users who first encountered the feature at different times.
I would also choose guardrail metrics. A guardrail is a measure that should not become materially worse while the primary outcome improves. The exact guardrails depend on the product, but examples could include broader conversion, retention, customer experience, reliability, or another important business outcome. I would not conclude that the feature is successful simply because feature usage increased if a more important measure became worse.
The comparison method matters as much as the metric. If there is a valid randomized control group, I would compare treatment and control because randomization can provide stronger evidence about causal impact. If there is no experiment, I might compare pre-launch and post-launch trends, comparable populations, or another defensible baseline. However, I would describe those results as associations unless the design supports a causal conclusion. Seasonality, marketing activity, concurrent product changes, or changes in user composition could also explain an observed difference.
I would perform segmentation analysis where it could change the decision. Segmentation means comparing the same metric across meaningful groups rather than relying only on an overall average. A feature might work well for one group while creating friction for another. I would choose dimensions that are relevant to the business question and avoid slicing the data into many tiny groups because sparse groups can create unstable or misleading patterns.
I would also use cohort analysis when timing matters. A cohort is a group of users who share a relevant starting point, such as first feature exposure during the same period. Comparing cohorts can help distinguish short-lived launch excitement from sustained behavior. I would keep the observation window consistent so newer cohorts are not unfairly compared with older cohorts that have had more time to act.
Before interpreting any result, I would validate the data. I would confirm that feature exposure, usage, and outcome events are being recorded correctly; inspect missing values and duplicate events; check freshness and time boundaries; reconcile important event or user counts with independent control totals where possible; and investigate unusual outliers. A feature launch can introduce instrumentation changes, so an apparent KPI movement could come from tracking rather than actual customer behavior.
I would then separate different types of analysis. Descriptive analysis tells me what happened, such as whether adoption or the intended outcome changed. Diagnostic analysis investigates where the change occurred and which factors are associated with it using segments, funnels, cohorts, and drill-downs. Prescriptive analysis recommends what the team should do next. I would only make a predictive claim if the business question actually required forecasting future behavior.
I would also distinguish correlation from causation. If users who adopt the feature have higher retention or conversion, that relationship alone does not prove that the feature caused the improvement. Those users may already be more engaged. A valid randomized experiment or another credible causal design would provide stronger evidence. Without that evidence, I would report the relationship as an association and explain plausible alternative causes.
Finally, I would communicate the result as a decision. I would state what the primary metric shows, what supporting metrics explain, whether guardrails changed, what limitations or uncertainty remain, and what action the evidence supports. The action might be to continue the rollout, investigate a weak segment, improve part of the funnel, collect more data, or run a stronger experiment. I would also define how the same primary and guardrail metrics should be monitored afterward so the team can verify whether the decision produces the intended impact.
Technical Approach
Clarify the feature's customer or business objective and the decision the analysis must support.
Define the eligible population, unit of analysis, reporting window, time zone, and comparison baseline.
Select one primary outcome KPI directly tied to the feature's intended value.
Define supporting adoption, funnel, engagement, or cohort metrics only where they help explain the primary outcome.
Select guardrail metrics that can detect important negative side effects.
Write an explicit numerator, denominator, eligible population, unit, and time definition for every rate or KPI.
Validate instrumentation, missingness, duplicates, freshness, boundary dates, and outliers before interpreting changes.
Compare the launch with the strongest defensible baseline, preferring a valid randomized control when one exists.
Segment results across meaningful groups or cohorts where differences could change the decision.
Separate descriptive findings from diagnostic explanations and causal claims.
Assess uncertainty, sample limitations, and alternative explanations before recommending action.
Recommend a proportional next step and specify which primary and guardrail metrics should be monitored afterward.
Practical Insights
The main cost is usually not the arithmetic; it is defining trustworthy metrics and processing enough event or user-level data to compare populations, periods, funnels, cohorts, and segments. More segmentation gives more detail but can create noisy results when groups are small. Longer observation windows can better capture retention or repeat behavior but delay decisions. Randomized experiments can provide stronger causal evidence when designed correctly, while simple before-and-after comparisons are faster but more vulnerable to seasonality, concurrent changes, and shifts in the user population.
Why Interviewers Ask This
Interviewers want to see whether I can connect a feature launch to the business decision, define meaningful KPIs correctly, protect against misleading conclusions, and recommend action based on evidence rather than simply listing popular metrics.
Common interview mistakes
Common mistakes include choosing metrics before understanding the feature's objective, treating clicks or raw usage as proof of value, failing to define the eligible population or denominator, comparing periods with inconsistent windows, ignoring guardrail metrics, overlooking broken instrumentation or duplicate events, using only an overall average when segments behave differently, comparing cohorts with unequal observation time, over-interpreting sparse groups, and claiming that the launch caused an observed change when the analysis only shows correlation.
Interview tip
Do not answer with a long list of generic metrics. Start with the feature's goal, name a primary KPI, supporting metrics, and guardrails, then explain metric definitions, the comparison baseline, segmentation, data-quality checks, and how the result would drive a decision.
Interviewer may ask next
What would you do if feature adoption increased strongly, but the primary business outcome did not improve?
I would not call the feature successful based on adoption alone. I would first verify the adoption and outcome metric definitions and tracking. Then I would examine the funnel from feature exposure through use to the intended outcome, and compare meaningful segments and cohorts to see whether the feature creates value only for certain populations or whether users are trying it without completing the valuable action. I would also check whether the observation window is long enough for the expected outcome. If the data is valid and sufficient, the evidence would suggest that usage is not translating into the intended value, so I would investigate the user experience or value proposition before expanding the rollout.
How would your evaluation change if there were no randomized control group?
I would still use the same well-defined primary, supporting, and guardrail metrics, but I would weaken the causal interpretation. I could compare post-launch performance with a carefully selected historical baseline, examine time trends, compare similar unaffected or later-exposed populations when defensible, and perform segmentation and sensitivity checks. I would explicitly consider alternative explanations such as seasonality, concurrent product changes, marketing activity, and shifts in user composition. I would report the result as an observed association rather than claiming the feature caused the change, and if the decision is important enough, I would recommend a future experiment or another stronger evaluation design.
17. Which north-star metric would you select for a food-delivery app?Data AnalysisMedium
i Question Details
Break the food-delivery north-star metric into drivers and connect them to product decisions.
Short Interview Answer (30-60 seconds)
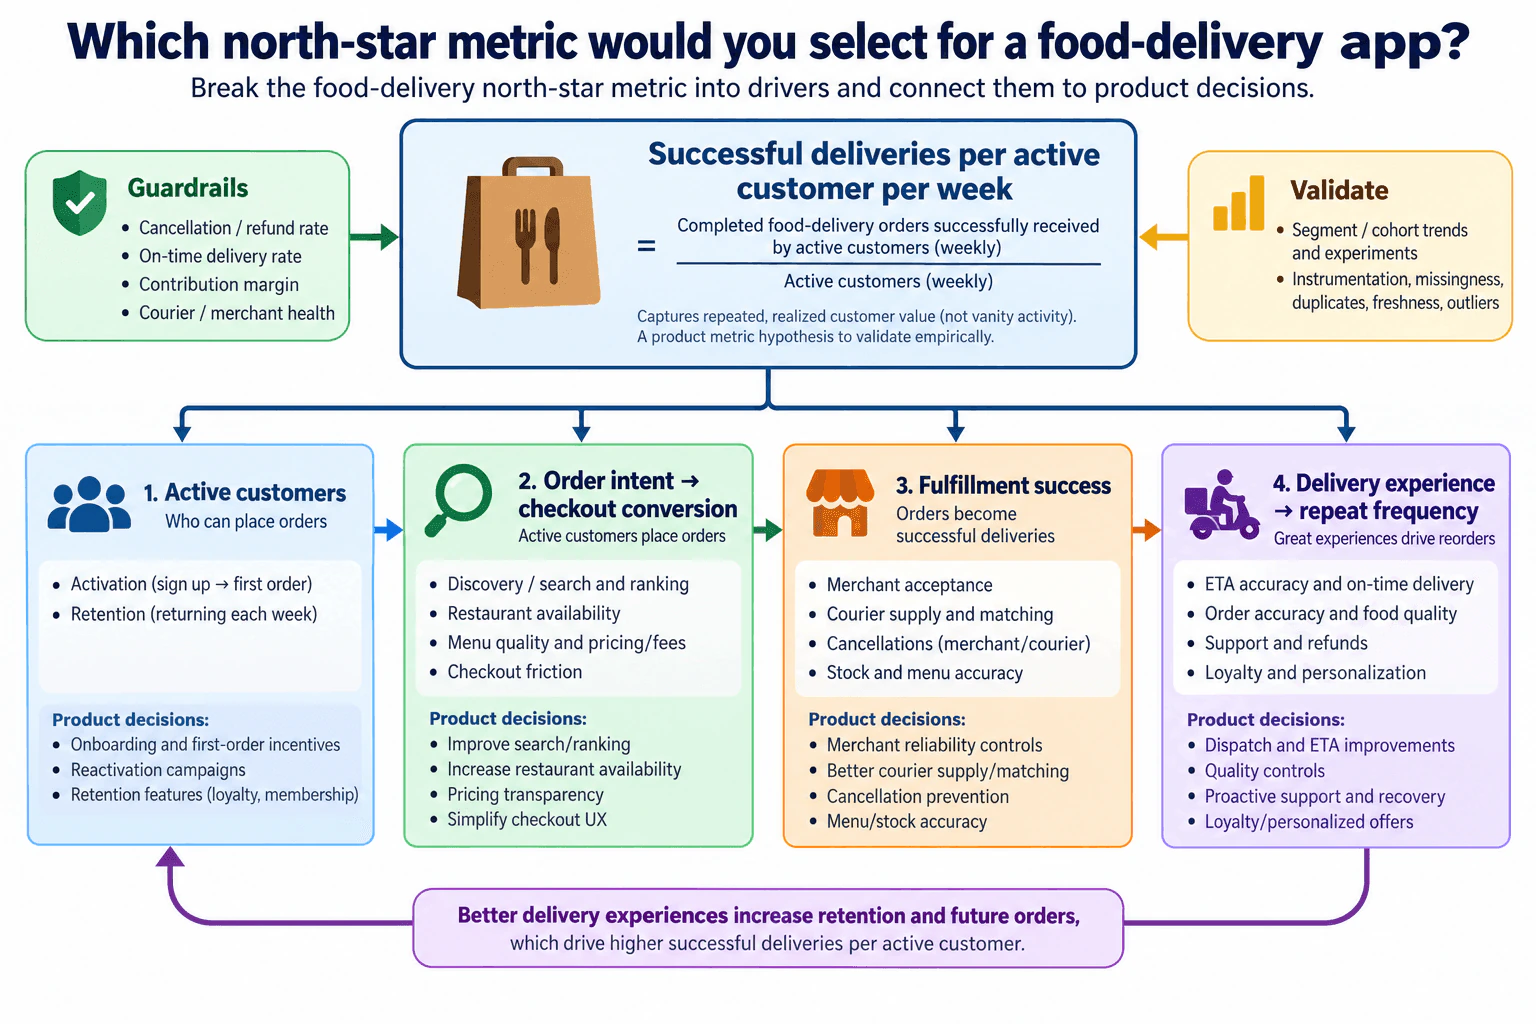
I would choose successful deliveries per active customer per week. The numerator is successfully completed food-delivery orders received during the week, and the denominator is weekly active customers. I like it because it measures realized and repeated customer value rather than simple app activity. I would examine active customers, checkout conversion, fulfillment success, and delivery experience that drives repeat ordering. Then I would connect each area to product actions and monitor guardrails such as cancellations, refunds, on-time delivery, contribution margin, and courier and merchant health.
Detailed Explanation
The business decision is how to measure whether the food-delivery product is creating repeated customer value. I would choose successful deliveries per active customer per week. The numerator is successfully completed food-delivery orders received by customers during the week, and the denominator is weekly active customers. Before analyzing it, I would agree on the exact active-customer definition, reporting week, and time zone. Then I would examine customer activity, checkout conversion, fulfillment success, and delivery experience. These areas connect the metric to specific product decisions while guardrails protect service quality, marketplace health, and economics.
Useful Questions to Ask the Interviewer
How does the company define an active customer: app activity, ordering activity, or another eligibility rule?
What event marks an order as successfully delivered, and how are cancellations, refunds, or failed deliveries classified?
Is the main decision about acquisition, conversion, fulfillment reliability, retention, or overall marketplace growth?
Should the metric be compared globally, by market, or across specific customer cohorts and segments?
Which guardrails matter most for the business: on-time delivery, cancellations and refunds, contribution margin, or courier and merchant health?
How to Explain It in an Interview
I would start by defining the north-star metric before looking at trends:
Successful deliveries per active customer per week = successfully completed food-delivery orders received during the week / weekly active customers.
The reporting window is one week. The numerator counts realized deliveries, not merely orders started or placed. The denominator uses the agreed weekly active-customer definition and must remain consistent across comparisons. The resulting unit is successful deliveries per active customer per week.
The first area I would inspect is active customers. This provides important context for how many customers are available to generate orders and helps explain changes in the numerator and denominator. Useful diagnostics include activation from signup to first order and weekly retention. Product decisions could include onboarding and first-order incentives, reactivation campaigns, or retention features such as loyalty or membership. Because active customers are also the denominator of the north-star ratio, I would always inspect the customer count separately rather than assuming that more active customers mechanically increase the ratio.
The second driver is order intent to checkout conversion. Customers may be active but fail to place an order. I would examine the funnel through discovery, search and ranking, restaurant availability, menu quality, pricing and fees, and checkout friction. Product decisions could include improving search and ranking, increasing restaurant availability, making pricing more transparent, or simplifying checkout. Conversion must use a clearly defined eligible population and denominator so an instrumentation change does not appear to be a product improvement.
The third driver is fulfillment success. Placed orders create customer value only when they become successful deliveries. I would examine merchant acceptance, courier supply and matching, merchant or courier cancellations, and menu or stock accuracy. Product decisions could include merchant reliability controls, better courier supply and matching, cancellation prevention, and improvements to menu or stock accuracy.
The fourth driver is delivery experience and repeat frequency. A completed delivery can still create a poor experience, so I would examine ETA accuracy, on-time delivery, order accuracy and food quality, support and refunds, and loyalty or personalization. Product decisions could include dispatch and ETA improvements, quality controls, proactive support and recovery, or loyalty and personalized offers. The key feedback relationship is that better delivery experiences may improve retention and future ordering, which can increase future successful deliveries per active customer. I would test that relationship rather than assume it is causal.
I would use descriptive analysis first to show the north-star trend and its driver trends. Then I would use segmentation and cohort analysis to see whether changes are concentrated among new versus returning customers, markets, customer cohorts, or other meaningful groups available in the data. Funnel analysis is useful for the order-intent-to-checkout path. If the north-star metric changes, I would drill down into these areas rather than immediately assigning a cause.
Before interpreting movement, I would validate instrumentation, missing records, duplicate events or orders, freshness, outliers, and the classification of cancellations, refunds, and failed deliveries. I would preserve the same active-customer population, weekly window, and time zone across comparisons. I would also compare the metric with a suitable prior baseline while considering changes in customer mix or operating conditions. A rising ratio can be misleading if the active-customer denominator falls, so I would inspect the numerator and denominator alongside the ratio.
I would separate observation from explanation. For example, seeing higher successful deliveries per active customer at the same time as better on-time delivery is correlation. It does not prove that the delivery improvement caused the increase. Alternative explanations could include changes in customer mix, restaurant availability, promotions, courier supply, or other operating conditions. Where a product intervention can be randomized, I would use a controlled experiment to estimate causal impact and compare both the north-star metric and relevant driver metrics.
Finally, I would monitor the diagram's guardrails: cancellation and refund rate, on-time delivery rate, contribution margin, and courier and merchant health. A product change should not be called successful simply because the north-star metric rises while service quality, economics, or marketplace health deteriorates. I would identify the weakest or highest-opportunity driver, make a targeted product change, measure its effect against a baseline or controlled experiment, inspect segment and cohort behavior, and keep, revise, or stop the change based on the north-star result plus the guardrails.
Technical Approach
Define the business decision and agree on the weekly active-customer population, successful-delivery event, reporting week, and time zone.
Calculate successful deliveries per active customer per week using a consistent numerator and denominator.
Track the numerator and denominator separately so ratio changes remain interpretable.
Examine active customers, order-intent-to-checkout conversion, fulfillment success, and delivery experience that influences repeat frequency.
Map each area to product decisions that can reasonably influence it.
Analyze trends, funnel stages, meaningful segments, and customer cohorts to locate where movement occurs.
Validate instrumentation, missingness, duplicates, freshness, outliers, and classification of cancelled, refunded, or failed orders.
Separate observed correlations from causal claims and use controlled experiments when an intervention can be randomized.
Check cancellation/refund rate, on-time delivery, contribution margin, and courier/merchant health as guardrails.
Recommend a proportional product action and measure whether the north-star metric and guardrails move as intended.
Practical Insights
The formula itself is simple, but the difficult part is keeping definitions trustworthy and diagnosing why the ratio moves. The analysis needs customer activity, order funnel, fulfillment, delivery-quality, and marketplace-health data at compatible grains and time windows. More segmentation and cohort analysis provides better diagnostic detail but creates more processing and validation work and can produce noisy results for small groups. Controlled experiments usually require more time and coordination than trend comparisons, but they provide stronger evidence about whether a product change caused an observed effect.
Why Interviewers Ask This
The interviewer is testing whether the candidate can choose a meaningful product KPI, define its numerator, denominator, population, and time window, break the business outcome into actionable drivers, connect those drivers to product decisions, and avoid optimizing one metric while damaging customer experience, economics, or marketplace health.
Common interview mistakes
Choosing app opens, gross order value, or total orders without explaining why the metric represents realized customer value; failing to define the numerator, denominator, active-customer population, weekly window, or time zone; treating active customers as a simple positive mathematical driver even though they are also the denominator; ignoring conversion or fulfillment; assuming correlation proves that delivery quality caused repeat ordering; celebrating a rising ratio while the active-customer denominator is shrinking; ignoring cancellations, refunds, service quality, contribution margin, or marketplace health; comparing segments with inconsistent definitions; and recommending product changes before checking instrumentation and data quality.
Interview tip
State the north-star metric and formula first, then explain the four areas shown in the diagram: active customers, checkout conversion, fulfillment success, and delivery experience leading to repeat frequency. Connect each to product decisions, mention the guardrails, and finish by explaining how segmentation, cohorts, data-quality checks, and experiments would tell you whether the action truly improved the metric.
Interviewer may ask next
What would you check if successful deliveries per active customer increased but total successful deliveries fell?
I would inspect the numerator and denominator separately. The ratio can rise because weekly active customers fell faster than successful deliveries, which would not necessarily represent healthy growth. I would check the active-customer definition, activation, retention, customer mix, and whether instrumentation changed. Then I would segment the movement by meaningful cohorts or markets and review the guardrails. I would not call the change positive until I understood whether the remaining customers genuinely completed more successful deliveries per customer or the denominator simply shrank.
How would your decision change if a feature increased successful deliveries per active customer but worsened contribution margin or courier health?
I would not optimize the north-star metric in isolation. Contribution margin and courier health are guardrails because the marketplace must remain economically and operationally sustainable. I would identify where the harm occurs, segment the impact, and test whether the feature can be redesigned or targeted so customer value improves without unacceptable marketplace damage. If the guardrail deterioration is material and persistent, I would not recommend a broad rollout even if the north-star metric increases.
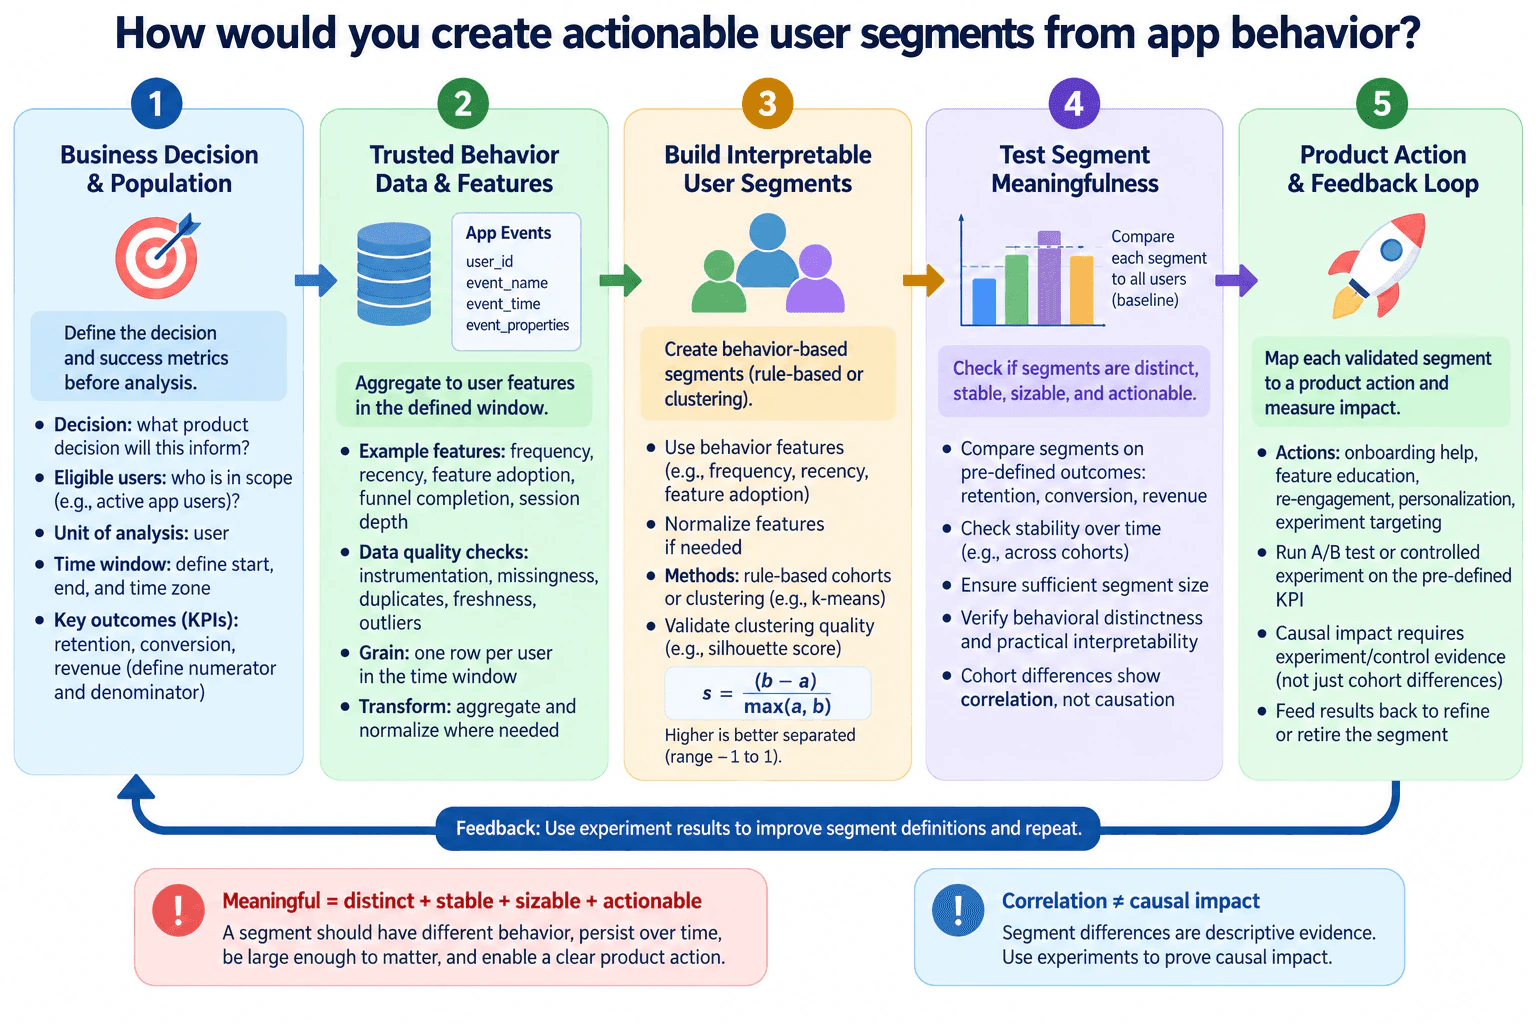
18. How would you create actionable user segments from app behavior?Data AnalysisMedium
i Question Details
Explain how you would test the segments’ meaningfulness and translate them into product actions.
Short Interview Answer (30-60 seconds)
I would start with the product decision, define the eligible users, user-level grain, observation window, time zone, and success KPIs, then build behavior features such as frequency, recency, feature adoption, funnel completion, and session depth. I would create interpretable segments using business rules or clustering and test whether they are distinct, stable, large enough, and actionable. Finally, I would map each validated segment to a proportional product action, test that action with an A/B or controlled experiment when feasible, measure the predefined KPI, and use the results to refine or retire the segment.
Detailed Explanation
The goal is not simply to divide users into groups. The goal is to find groups with different behavior that can support a real product decision. I would first define who is included, the user-level analysis grain, the observation window, time zone, and the KPIs we care about. Then I would turn app events into behavioral features, create understandable segments, and test whether those segments are distinct, stable, large enough, and useful. Only after that would I connect them to product actions and measure whether those actions actually improve outcomes.
Useful Questions to Ask the Interviewer
What product decision should these segments help us make?
Which users are eligible for the analysis, and what observation window and time zone should we use?
Which outcomes matter most, such as retention, conversion, revenue, or feature adoption?
Are there existing business-defined segments that need to remain interpretable to product teams?
Can we run controlled experiments on the resulting segments?
How to Explain It in an Interview
I would use a five-step analysis plan that follows the same flow as the diagram.
Start with the business decision and define the population. Before choosing a segmentation method, I would clarify what decision the product team wants to make. The decision might involve onboarding help, feature education, re-engagement, personalization, or experiment targeting. I would define the eligible users, use the user as the unit of analysis, choose a clear observation window and time zone, and define each KPI before exploring patterns. For a rate such as retention or conversion, I would explicitly define its numerator and denominator so every segment is compared using the same measurement logic.
Build trusted behavioral features. The raw inputs would be app events with fields such as user ID, event name, event time, and event properties. I would first check instrumentation, missing events, duplicate records, freshness, and unusual outliers. Then I would aggregate those events to one row per user for the defined observation window. Useful behavioral features could include usage frequency, recency, feature adoption, funnel completion, and session depth. I would normalize features when differences in scale could distort a clustering method.
This step is important because bad instrumentation, duplicate events, missing data, or inconsistent windows can create artificial segments. I would also avoid using information from after the observation window when defining the segments because that could leak future information into the analysis.
Create interpretable user segments. If the business already has clear definitions, rule-based segmentation can be easier to explain and maintain. If I need to discover natural behavioral groups, I could use an appropriate clustering method such as k-means on suitable normalized features. I would not assume that clusters are useful just because an algorithm produced them.
For clustering, I could evaluate separation with a metric such as the silhouette score, which compares how close a user is to its own cluster versus neighboring clusters. Its standard range is -1 to 1, with higher values generally indicating better-separated clusters. But a good score alone is not enough. Product teams still need to understand what distinguishes each segment, such as frequency, recency, or feature adoption, so the groups should remain practically interpretable.
Test whether the segments are meaningful. I would compare each segment with the overall eligible-user baseline and with the other segments on predefined outcomes such as retention, conversion, or revenue. These comparisons are descriptive evidence: they show that groups behave differently, but they do not by themselves prove why.
I would test four main properties. First, distinctness: do the segments have meaningfully different behavioral profiles or outcomes? Second, stability: do similar patterns remain when I repeat the analysis across different periods or comparable cohorts? Third, size: is each segment large enough to matter and support reliable decisions? Fourth, interpretability and actionability: can a product owner explain the segment and identify a reasonable action for it?
For clustering, I would also test sensitivity to the selected features, normalization, initialization, and number of clusters. A segment that disappears after a small analytical change may be too fragile to operationalize.
I would explicitly separate correlation from causation. If one segment has lower retention, that is an observed association. It does not prove that the behaviors defining the segment caused the lower retention. Alternative explanations could include acquisition source, user tenure, device differences, incomplete tracking, seasonality, or other confounding factors.
Translate validated segments into product actions and measure impact. Once a segment is distinct, stable, sizable, and actionable, I would map it to a proportional product response. Depending on the observed behavior, possible actions could include onboarding assistance, feature education, re-engagement, personalization, or experiment targeting. I would avoid making a recommendation stronger than the evidence supports.
To determine whether the action causes an improvement, I would run an A/B test or another suitable controlled experiment within the relevant segment when feasible. I would measure the effect using the KPI defined before the analysis and compare it with the appropriate control or baseline. Segment differences remain descriptive evidence; experimental evidence is what supports a causal product-impact claim.
Finally, I would create a feedback loop. I would use experiment results to improve the segment definitions and repeat the process. If a segment continues to be distinct, stable, sizable, and useful, I would keep monitoring it. If it stops being meaningful, becomes too small, changes as the product evolves, or fails to support a useful action, I would refine or retire it.
Technical Approach
Define the product decision, decision owner, eligible user population, user-level grain, observation window, time zone, and KPIs.
Validate app-event instrumentation and check missingness, duplicates, freshness, and outliers.
Aggregate app events into one row per user with behavioral features such as frequency, recency, feature adoption, funnel completion, and session depth.
Normalize features when required and create interpretable segments using business rules or an appropriate clustering method.
Evaluate clustering separation when applicable and describe the behavior that distinguishes each segment.
Compare each segment with the overall baseline and other segments on predefined outcomes.
Test distinctness, stability across periods or cohorts, sufficient size, interpretability, and actionability.
Run sensitivity checks and examine alternative explanations for observed differences.
Map validated segments to proportional product actions.
Use controlled experiments when feasible to measure causal impact on the predefined KPI, then feed the results back into the segmentation process and refine or retire segments as needed.
Practical Insights
The main cost is usually preparing and aggregating behavioral event data because an app can generate many events per user. Rule-based segments are easier to compute, explain, and maintain, but they may miss patterns that were not anticipated. Clustering can reveal additional structure, but it requires feature preparation, scaling, model selection, stability testing, and interpretation. More features and more candidate segment definitions also increase validation work. I would therefore prefer the simplest segmentation that remains distinct, stable, sizable, interpretable, and actionable.
Why Interviewers Ask This
This tests whether the candidate can turn raw app behavior into interpretable user groups, verify that those groups are meaningful rather than arbitrary, and connect the analysis to measurable product decisions without confusing correlation with causation.
Common interview mistakes
Common mistakes are starting with a clustering algorithm instead of a product decision, using poorly defined KPIs, mixing different populations or observation windows, ignoring missing or duplicated events, failing to check instrumentation and freshness, using raw features with incompatible scales in a distance-based method, accepting clusters without checking stability or interpretability, keeping segments that are too small to support decisions, treating outcome differences as proof of causation, and launching targeted actions without measuring impact against an appropriate control or baseline.
Interview tip
Present the answer as a decision loop: define the decision and KPI, build trustworthy user-level features, create interpretable segments, test whether they are distinct, stable, sizable, and actionable, connect them to an action, and measure that action. Explicitly distinguishing descriptive segment differences from causal experimental evidence makes the reasoning stronger.
Interviewer may ask next
What would you do if the clustering algorithm produces clear groups but the segments change significantly each month?
I would treat that as a stability problem rather than immediately operationalizing the clusters. I would first check whether the change comes from instrumentation, data freshness, seasonality, changes in the eligible population, feature scaling, or genuine changes in user behavior. Then I would repeat the segmentation across comparable cohorts or observation windows and test sensitivity to feature choices, normalization, initialization, and the number of clusters. If the groups remain unstable, I would simplify the feature set, consider more interpretable rule-based segments, or avoid using the clusters for targeting until their definitions become reproducible.
What if a segment has much lower retention than the others, but an experiment targeting it shows no improvement?
I would separate the descriptive finding from the intervention result. The lower retention still shows that the segment is associated with a different outcome, but the failed experiment means the tested action did not demonstrate an improvement. I would check whether the intervention addressed the likely problem, whether eligibility and KPI definitions were correct, and whether alternative explanations such as acquisition mix, tenure, device differences, or product friction better explain the observed difference. I would then test a better-supported action, refine the segment if necessary, or retire it if it does not lead to a useful product decision.
19. A key metric falls 15% overnight. How would you investigate?Data AnalysisHard
i Question Details
For the overnight 15% decline, separate measurement changes from business changes, narrow the affected population, and evaluate possible causes.
Short Interview Answer (30-60 seconds)
I would start by confirming what the KPI means and whether the 15% decline is measured correctly. I would verify its numerator, denominator, population, unit, overnight window, time zone, and baseline, then check instrumentation, freshness, missing data, duplicates, schema changes, filters, joins, pipeline issues, and outliers. If the data is trustworthy, I would narrow the decline by platform, geography, channel, customer segment, funnel step, and cohort. Then I would test likely business causes, separate correlation from causation, take an action proportional to the evidence, and monitor the KPI to verify recovery.
Detailed Explanation
The first goal is not to explain the decline immediately. It is to determine whether the 15% change is a real business change or a measurement problem, identify which population is affected, and decide what action is justified. I would move from metric definition to measurement validation, segmentation, root cause analysis, and action. At every step, I would preserve the same eligible population, unit of analysis, time window, time zone, and comparison baseline. I would also keep uncertainty visible because one overnight decline alone does not prove a lasting problem or a specific cause.
Useful Questions to Ask the Interviewer
What exact KPI fell, and how are its numerator and denominator defined?
What eligible population and unit of analysis does the KPI represent, such as users, orders, or sessions?
What does "overnight" mean for the reporting window and time zone?
What comparison baseline produced the 15% decline: the previous day, the same weekday last week, or another benchmark?
Who owns the business decision that may follow from this investigation?
Were there recent releases, configuration changes, tracking changes, pricing changes, promotions, campaigns, or operational incidents?
Are there known reporting delays, data-freshness problems, or pipeline issues?
How to Explain It in an Interview
I would use a five-step investigation that matches the decision flow in the diagram.
Define and verify the KPI. Before interpreting the decline, I would write down the metric name and business purpose, numerator and denominator when relevant, eligible population, unit of analysis, reporting window, time zone, and comparison baseline. I would not compare periods until I know they use the same definition and scope. The supplied fact is only that the metric is down 15% compared with its baseline; the cause is still unknown.
Validate measurement and data quality. I would first rule out measurement or data problems. I would review recent instrumentation or metric-definition changes, deployments or configuration changes, whether expected events arrived, data freshness and latency, missing records or schema changes, duplicates, abnormal spikes or drops, filters, joins, pipeline issues, and outliers in the raw data. I would validate using checks such as row counts, control totals, expected event volumes, source freshness, or an independent source when one exists. If a measurement issue is found, I would fix or annotate it and recompute the KPI before continuing. If measurement is sound, I would move to the business investigation.
Narrow the affected population. I would confirm the timing of the drop and then perform segmentation analysis. Segmentation means comparing meaningful groups to see where the decline is concentrated. I would break the KPI down by dimensions such as platform or app version, geography or region, acquisition channel, new versus existing customers, funnel step, and cohort such as signup date. I would compare affected groups with unaffected groups using the same metric definition and baseline. Funnel analysis helps when the KPI depends on sequential steps because it can show where conversion changed. Cohort analysis helps when behavior differs by when customers entered the product. I would also watch for sparse groups, missing dimension values, and denominator changes that can make percentage differences misleading.
Evaluate likely causes. Once I know where the decline is concentrated, I would compare evidence and test hypotheses. I would align the timing with releases or configuration changes, marketing, pricing or promotion changes, traffic or demand changes, operational incidents such as outages, seasonality, weekday effects, holidays, and funnel-conversion changes. This is diagnostic analysis: it moves from describing where the metric changed to evaluating plausible explanations. I would distinguish evidence from assumptions and correlation from causation. A change that happened at the same time as the KPI decline is a useful hypothesis, but not proof of cause. I would consider alternative explanations and quantify uncertainty where the data supports doing so.
Turn the finding into action and measure impact. I would summarize the strongest supported finding together with its evidence and uncertainty. If the issue is a confirmed measurement failure, I would repair or annotate the measurement and recompute the KPI. If evidence points to a business change, I would take a proportional action, such as mitigating the affected area or running a targeted experiment, depending on confidence and risk. Then I would monitor the KPI and related measures against the same baseline, set an appropriate alert and review timeline, and confirm whether recovery occurs. If new evidence changes the conclusion or the drop persists, I would revisit the analysis and test alternative hypotheses through the feedback loop.
The key distinction is between observation, interpretation, and recommendation. The observation is the supplied 15% overnight decline. The interpretation comes only after measurement validation and diagnostic analysis. The recommendation should be no stronger than the evidence. A single overnight decline is not proof of a lasting business problem, so the conclusion must remain open to revision as more data arrives.
Technical Approach
Define the business decision and decision owner.
Define the KPI: purpose, numerator, denominator, eligible population, unit of analysis, reporting window, time zone, and comparison baseline.
Confirm that the 15% decline is calculated using the same metric definition and scope.
Check recent instrumentation and metric-definition changes, deployments, configuration changes, event arrival, data freshness, missingness, schema changes, duplicates, abnormal spikes or drops, filters, joins, pipeline issues, and outliers.
If a measurement issue is found, fix or annotate it and recompute the KPI.
If measurement is sound, confirm the timing of the decline and segment by platform or app version, geography, acquisition channel, customer segment, funnel step, and cohort.
Compare affected groups with unaffected groups to localize the problem.
Test plausible causes against timing and supporting evidence, including releases, configuration changes, marketing, pricing, promotions, traffic or demand changes, operational incidents, seasonality, and funnel-conversion changes.
Separate evidence from assumptions, distinguish correlation from causal evidence, consider alternatives, and communicate uncertainty.
State the supported finding, take an action proportional to confidence, monitor the KPI and related metrics, and revisit the analysis if new evidence changes the conclusion.
Practical Insights
The main cost is analyst time and the amount of data scanned across periods and segments. A quick metric-definition, freshness, and instrumentation check is usually cheaper than immediately running a wide root cause analysis, so it should come first. Segmentation becomes more expensive as the number of dimensions and combinations grows, and very small groups can create noisy percentage changes. The tradeoff is speed versus confidence: investigate the highest-impact and most plausible checks first, while keeping the metric definition, population, denominator, window, time zone, and baseline consistent.
Why Interviewers Ask This
This tests whether the candidate can respond to an unexpected KPI change systematically instead of immediately guessing a business cause. The interviewer is looking for judgment around metric definition, data-quality validation, segmentation, root cause analysis, uncertainty, causal reasoning, and turning evidence into a measurable business action.
Common interview mistakes
Common mistakes are jumping directly to a business explanation before validating the KPI; changing the population, denominator, time zone, window, or baseline during the investigation; checking only the overall trend instead of affected segments; assuming a correlated release, campaign, or outage caused the decline; ignoring instrumentation, freshness, missing records, duplicates, joins, filters, schema changes, pipeline issues, or outliers; overreacting to a single overnight observation; and recommending action without stating uncertainty or how recovery will be measured.
Interview tip
Present the answer as a clear flow: define the KPI, validate measurement, localize the decline, test likely causes, then act and monitor. Explicitly say that the 15% decline is an observation, not yet a root cause, and that your recommendation will be proportional to the strength of the evidence.
Interviewer may ask next
What would you do if the overall KPI is down 15%, but only one small customer segment shows a very large decline?
I would first verify that the segment uses the same KPI definition, eligible population, unit, time window, time zone, and baseline as the overall metric. Then I would check its denominator and number of observations because a small segment can show a large percentage swing from relatively few records. I would quantify how much that segment contributes to the overall decline and compare it with unaffected groups. If it explains little of the total change, I would continue searching for other contributors. If it explains a meaningful share and the data is valid, I would investigate causes specific to that segment while clearly communicating the added uncertainty from its smaller size.
How would your response change if you needed to make a business decision within 30 minutes?
I would prioritize reversible, high-information checks. First I would confirm the KPI definition, comparison baseline, data freshness, expected event arrival, and major pipeline or instrumentation failures. Then I would segment using a few high-value dimensions such as platform, geography, channel, customer segment, and funnel step rather than exploring every possible combination. I would check recent releases, configuration changes, promotions, demand shifts, and operational incidents that align with the timing. If evidence remains uncertain, I would recommend a low-risk or reversible mitigation instead of claiming a definitive cause, while continuing deeper analysis and monitoring afterward.
20. How would you define a business metric that discourages gaming?Data AnalysisHard
i Question Details
Explain how a business metric’s definition and accompanying counter-metrics would distinguish genuine improvement from manipulation.
Short Interview Answer (30-60 seconds)
I would start with the business outcome we actually want and define a primary metric whose improvement should represent progress toward that outcome. I would lock down the eligible population, unit of analysis, numerator, denominator, time window, and exclusions before reviewing results. Then I would ask how someone could improve the KPI without improving the business and create counter-metrics for those failure modes. Finally, I would monitor the KPI and guardrails across time, segments, and cohorts and investigate whether changes come from real outcomes, population mix, instrumentation, or behavior designed only to improve the reported number.
Detailed Explanation
The goal is to create a metric that rewards real business improvement instead of rewarding a number that can be made to look better. I would first define the business decision and the underlying outcome we care about. Then I would define exactly who is included, what one observation represents, the numerator, denominator, reporting window, and exclusions. Next, I would ask how someone could improve the metric without improving the desired outcome. Those possible shortcuts become the basis for counter-metrics, validation checks, segment analysis, and ongoing monitoring before the KPI is used for important decisions.
Useful Questions to Ask the Interviewer
What business decision will this metric influence, and who owns that decision?
What underlying business or customer outcome should improve when this KPI improves?
Who can influence the metric, and how could their behavior change once the KPI becomes a target?
What population and unit of analysis should the metric cover?
What should the numerator, denominator, reporting window, and comparison baseline represent?
Which important outcomes must not deteriorate while the primary KPI improves?
Which segments or cohorts could behave differently and therefore need separate monitoring?
Are there known instrumentation, missing-data, duplicate-data, or reporting limitations?
How to Explain It in an Interview
I would treat metric design as both an analytics problem and an incentive-design problem.
First, I would start with the business decision and the true outcome. A KPI should represent something the business genuinely wants to improve. I would avoid choosing a metric only because it is easy to measure. A mathematically precise metric can still create bad incentives if it is only a weak proxy for the real objective.
Second, I would define the metric before exploring the results. I would document the eligible population, unit of analysis, numerator, denominator, time window, time-zone convention when relevant, inclusion and exclusion rules, and comparison baseline. This makes the definition reproducible and reduces the opportunity to change it after seeing which version produces the preferred result.
Third, I would perform a gaming analysis by asking: how could someone make this KPI improve without improving the intended business outcome? Possible mechanisms include changing which cases enter the denominator, moving activity between reporting periods, generating repeated low-quality events, focusing only on easier cases, or optimizing an immediate action while damaging a later outcome. These are possible failure modes to test, not assumptions that manipulation is already happening.
Fourth, I would pair the primary KPI with counter-metrics or guardrails. A counter-metric measures an important outcome that should remain healthy when the primary KPI improves for the right reason. For example, if the primary metric captures an immediate action, an appropriate downstream quality or persistence measure may reveal whether that apparent improvement has lasting value. The exact guardrails must come from the business objective and available evidence rather than from generic rules.
I would usually keep the primary KPI understandable instead of combining every measure into one complicated score. A simple primary metric with a small number of clearly defined guardrails makes it easier to see what changed. A composite score can hide deterioration in one component and may create additional ways to optimize the score without improving the underlying outcome.
Fifth, I would compare the primary KPI and counter-metrics over time against an appropriate baseline. A KPI that rises while an important guardrail deteriorates is a warning that the apparent improvement may not represent the desired outcome. However, that pattern alone does not prove intentional gaming. It could also come from seasonality, population changes, instrumentation changes, or another business factor.
Sixth, I would use segmentation analysis where it can reveal hidden changes. An overall KPI can improve because the mix of the population changed even when performance within comparable groups did not improve. I would therefore compare meaningful dimensions supported by the data. When lifecycle timing matters, cohort analysis can compare groups that entered at similar times rather than mixing newer and more mature populations.
Seventh, I would validate the data before interpreting behavioral changes. I would check missing values, duplicate records, data freshness, denominator changes, missing periods, outliers, instrumentation changes, and boundary-date behavior where relevant. I would also reconcile row counts and control totals when possible. Otherwise, a tracking or pipeline change could incorrectly appear to be genuine business improvement or manipulation.
Eighth, I would separate descriptive and diagnostic findings from causal claims. Descriptive analysis can show that the KPI changed. Diagnostic analysis can identify which segments, cohorts, funnel stages, or time periods contributed to the change. Neither automatically proves why the change occurred. If the decision requires causal confidence, I would look for stronger evidence such as a controlled experiment or another defensible comparison design rather than treating correlation as causation.
Ninth, I would define how the KPI and guardrails affect decisions before attaching strong incentives to them. The primary KPI might need to improve while important counter-metrics remain within business-approved boundaries. I would not invent numerical thresholds. Those should come from business risk tolerance, historical variation, experiments, service requirements, or other validated evidence.
Finally, I would continue monitoring after the metric becomes a target. People and systems can adapt once they understand how a KPI is calculated. I would periodically review denominator composition, segment distributions, unusual trend breaks, and the relationship between the primary metric and its downstream guardrails. If the KPI becomes easier to improve without producing the intended outcome, I would revise the metric definition, guardrails, or incentive structure. A good metric therefore does not merely make gaming difficult; it makes genuine improvement easier to distinguish from manipulation.
Technical Approach
Define the business decision and the true outcome the metric is intended to represent.
Specify the eligible population, unit of analysis, numerator, denominator, time window, comparison baseline, and inclusion or exclusion rules before reviewing results.
Identify plausible ways the KPI could improve without the underlying business outcome improving.
Map the important failure modes to a small set of counter-metrics or guardrails.
Compare the primary KPI and counter-metrics over time against an appropriate baseline.
Use segmentation or cohort analysis when population mix or lifecycle differences could hide misleading aggregate changes.
Drill down into suspicious movements while keeping descriptive evidence separate from causal conclusions.
Establish business-defined decision rules for interpreting the primary KPI together with its guardrails.
Monitor the metric after launch and revise its definition or safeguards if new gaming opportunities or unintended incentives appear.
Practical Insights
The formula may be simple, but designing a trustworthy metric can require substantial analysis. More counter-metrics and segment checks provide better protection against misleading improvements, but they also increase data requirements, monitoring effort, and interpretation complexity. A very complicated composite metric can become difficult to explain and may hide which component actually changed. A simpler primary KPI with a few meaningful guardrails is often easier to understand and govern. Analysis cost also increases as more time periods, segments, cohorts, and validation checks are evaluated.
Why Interviewers Ask This
This tests whether the analyst can design a KPI that measures the real business outcome instead of rewarding an easy-to-manipulate proxy. The interviewer wants to see whether the candidate can define the metric precisely, anticipate how people might optimize the number without improving the underlying outcome, add meaningful counter-metrics, detect population or reporting changes, and distinguish genuine improvement from manipulation.
Common interview mistakes
Common mistakes include choosing an easy-to-measure proxy without defining the real business outcome; leaving the population, denominator, time window, or exclusions ambiguous; changing the definition after seeing results; relying on one KPI without counter-metrics; combining too many measures into an opaque score; looking only at an aggregate value and missing segment or cohort changes; confusing instrumentation changes with business changes; assuming suspicious correlation proves intentional manipulation; inventing arbitrary guardrail thresholds; and rewarding short-term KPI movement while ignoring important downstream outcomes.
Interview tip
Present the metric as an incentive system, not just a formula. Start with the real business outcome, define the KPI precisely, explain how someone could improve it without creating real value, pair the important failure modes with counter-metrics, and finish with how you would validate and monitor the metric over time.
Interviewer may ask next
How would you determine whether an improvement in the primary KPI is genuine if the counter-metrics remain unchanged?
I would not conclude that the improvement is genuine from that pattern alone. First, I would confirm that the KPI and counter-metrics have stable definitions and reliable instrumentation. Then I would compare the change with an appropriate baseline and examine meaningful segments or cohorts to see whether population mix explains it. I would also check whether the selected counter-metrics actually cover the important gaming mechanisms, because an unchanged guardrail provides limited reassurance if it measures the wrong side effect. If the decision requires knowing whether a particular intervention caused the improvement, I would seek stronger causal evidence such as a controlled experiment or another defensible comparison design.
What would you do if adding enough counter-metrics to discourage gaming made the KPI too complicated for business teams to use?
I would keep the primary KPI simple and maintain the most important safeguards as separate guardrails rather than combining everything into an opaque composite score. I would prioritize counter-metrics according to the most consequential business risks and the most plausible gaming mechanisms. I would clearly document which KPI drives the main decision and which guardrails can qualify or block that decision. If a safeguard adds little decision value or cannot be measured reliably, I would reconsider it. The objective is not maximum complexity; it is enough protection against harmful optimization while keeping the measurement system understandable, maintainable, and actionable.
More questions load as you scroll
Disclaimer: This interview guide is for educational and informational purposes only. It is designed to help readers prepare, but it does not guarantee any interview result, hiring decision, offer, or outcome. Interview questions, hiring criteria, and preferred answers can vary by employer, interviewer, industry, location, and time. All answers, examples, and explanations in this guide are suggested examples for interview preparation, not definitive answers or instructions for professional practice. They are based on research and judgment, are provided without warranties of any kind, and should be adapted to the question, role, and applicable laws and professional requirements. Diagrams are simplified illustrations intended to highlight the main concepts and their relationships; actual situations, systems, and practices may be more complex. Alternative approaches may be equally valid or better suited to a particular question, context, or interviewer. To the fullest extent permitted by applicable law, the contributors and publisher are not liable for decisions made, actions taken, or losses incurred based on this guide.
State Laws and Professional Responsibilities: Laws and requirements governing an occupation vary by state and jurisdiction. You are responsible for checking the current laws, licensing requirements, and scope-of-practice rules that apply to your location and role, and for ensuring that your answers and actions comply with them. Adapt examples in this guide to those requirements. This guide is not legal advice.
Content Accuracy and Verification: To the fullest extent permitted by applicable law, we do not represent or warrant that interview guides, questions, answers, examples, or diagrams are accurate, complete, current, error-free, or suitable for any particular purpose. You are responsible for independently reviewing and verifying the information before relying on it.