156 Data Analyst Interview Questions & Answers

88 top • 10 Accenture • 10 Bank of America • 10 Capital One • 9 Deloitte • 9 JPMorgan Chase • 10 Target • 10 Walmart

Data Analyst icon

Questions with Detailed ExplanationsWith Detailed Explanations

(Last Updated: September 13, 2026)

21. How would you evaluate a new subscription tier during its first 90 days?Data AnalysisHard

Question Details

Include adoption and the possibility that customers switch away from more valuable existing tiers.

Short Interview Answer (30-60 seconds)

I would evaluate the tier using both adoption and incremental business value. First, I would define the eligible customer population and measure adoption, retention, cancellations, and movement between subscription tiers. The key risk is cannibalization, so I would track how many adopters came from more valuable existing tiers and evaluate the resulting subscription revenue change rather than treating every adopter as incremental growth. I would compare cohorts and meaningful customer segments throughout the 90 days, validate the underlying data, and use the strongest available baseline or experiment. I would support expansion only if adoption and the overall customer and revenue impact justify it.

Detailed Explanation

The goal is not simply to ask whether customers choose the new subscription tier. I need to determine whether introducing it improves the subscription business during its first 90 days. A tier can show strong adoption while still reducing value if many existing customers move from a more valuable tier to the new one. I would therefore evaluate customer movement, retention, cancellations, and subscription revenue together. Because 90 days is an early observation window, I would separate what the data directly shows from longer-term outcomes that are still uncertain.

Useful Questions to Ask the Interviewer
  1. What decision will be made after the first 90 days: keep the tier, modify it, expand it, or reconsider it?
  2. Which customers are eligible for the new tier, and did eligibility or availability change during the 90-day window?
  3. What are the existing subscription tiers, and which of them does the business consider more valuable?
  4. How should upgrades, downgrades, cancellations, reactivations, and repeated tier switches be classified?
  5. Is there a randomized holdout, phased rollout, historical baseline, or another credible comparison group?
  6. Which subscription revenue measure should be used for the business decision?
  7. Were there promotions, pricing changes, product changes, or acquisition campaigns during the evaluation period that could affect customer behavior?
How to Explain It in an Interview

I would start with the business question and decision. The real question is whether the new tier should continue, change, expand, or be reconsidered after 90 days. Starting there prevents me from treating a visible metric such as sign-ups as the final definition of success.

Next, I would define the population and grain. The population should contain customers who were genuinely eligible for the new tier. The main analytical grain would be the customer subscription history because I need to know each customer's state before and after the tier became available. I would define the 90-day window, reporting interval, and time-zone convention consistently so customers and events near the boundaries are handled correctly.

Then I would define each KPI before looking at results. Adoption rate would be the number of eligible customers who enter the new tier divided by the number of eligible customers who had a meaningful opportunity to choose it. The exact denominator matters. Including customers who could never see or purchase the tier would make the rate misleading.

I would next determine where adoption comes from. New-tier adopters should be separated into groups supported by the available subscription history, such as new subscribers, customers moving from less valuable tiers, and customers moving from more valuable tiers. This segmentation is important because the same adoption count can have very different business implications.

The most important guardrail is cannibalization. In this context, cannibalization means customers choosing the new tier instead of a more valuable existing tier. I would measure both the count and share of new-tier adopters who previously belonged to those tiers and evaluate the associated change in the agreed subscription revenue measure. Revenue from a customer who downgraded should not be treated as entirely incremental because some or all of it replaces revenue the business previously received from that customer.

I would build a customer-level tier-transition view that shows the state before the new tier and the subsequent state during the evaluation window. This lets me distinguish new subscriptions, upgrades, downgrades, continued subscriptions, cancellations, and reactivations where the data supports those states. I would also handle repeated switching carefully so one customer who changes tiers several times is not counted as several independent acquisition successes.

Retention is another key KPI. For customers who enter the new tier, I would create cohorts based on when they joined and measure whether they remain subscribed after comparable amounts of time. Cohort analysis means comparing customers who began at similar times or giving them equal follow-up windows. A customer who joins near day 90 has much less observation time than one who joins near day 1, so later cohorts must be marked as immature rather than interpreted as complete 90-day outcomes.

I would also use trend analysis across the launch period. I would examine adoption, tier movement, retention indicators, cancellations, and subscription revenue over a consistent reporting interval. This helps determine whether the launch pattern is stable, improving, or deteriorating instead of relying only on one cumulative number at day 90.

I would drill down into meaningful dimensions such as prior subscription tier, new versus existing subscriber status, and join cohort, plus other business-approved segments if available. Segmentation analysis means examining groups separately because an overall average can hide an important problem. Strong adoption from genuinely new subscribers can have a different implication from strong adoption driven primarily by customers leaving more valuable tiers.

A funnel analysis can help if the necessary events are reliably instrumented. For example, if the data records eligibility, exposure, initiation of a tier-selection process, and successful subscription, I could calculate conversion between those stages. Each conversion rate would have a clearly defined numerator and denominator. I would not invent funnel stages or assume exposure data exists if it was not actually captured.

For revenue analysis, I would compare the observed subscription revenue after launch with the strongest credible baseline available. A randomized holdout would provide the cleanest causal comparison if one exists. A phased rollout could also provide useful comparison customers. If neither exists, I could consider historical or matched comparisons, but I would explicitly describe those results as observational because other factors may differ between groups or periods.

This is where I would separate descriptive, diagnostic, predictive, and prescriptive analysis. Descriptive analysis tells me what happened: adoption, transitions, cancellations, retention patterns, and revenue movement. Diagnostic analysis investigates possible explanations by examining segments, timing, and related business changes. Predictive analysis would estimate future behavior only if the decision requires a forecast and the early data can reasonably support one. Prescriptive analysis turns the evidence into a recommendation about what the business should do next.

I would be careful not to turn correlation into causation. If adoption or revenue changes after the launch, the new tier may be related to that change, but promotions, pricing changes, seasonality, acquisition mix, other product changes, or differences in customer eligibility could also explain it. Without a credible experimental or quasi-experimental comparison, I would not claim the tier caused the observed difference.

Before trusting the analysis, I would validate the inputs. I would check for missing subscription events, duplicate records, missing or invalid tier identifiers, inconsistent timestamps, impossible transition sequences, late-arriving data, and unusual outliers. I would compare customer counts and revenue totals with trusted control totals when available. I would also verify that a customer's subscription state is assigned consistently when several events occur near a reporting boundary.

I would test how sensitive the conclusion is to important analytical choices. For example, I could repeat the analysis under reasonable alternative definitions of customer state at launch, adoption timing, cohort maturity, or comparison population. If the recommendation changes materially under reasonable definitions, I would report that as uncertainty rather than hiding it.

At the end, I would present a balanced scorecard rather than one success metric. It would include adoption, the source of adoption, retention, cancellations, movement between tiers, subscription revenue impact, and the main uncertainty or limitations. The critical distinction is how much apparent adoption represents new or improved business versus substitution away from more valuable existing tiers.

The recommendation should be no stronger than the evidence. If adoption is healthy, retention is reasonable, and the overall revenue and customer effects remain favorable without concerning cannibalization, I could recommend continuing or expanding the tier. If adoption is mostly driven by movement away from more valuable tiers and that movement weakens business value, I would recommend examining pricing, positioning, eligibility, or benefits before expanding. If the evidence remains immature or mixed after 90 days, continued measurement may be the better decision.

Finally, I would define how the recommendation will be verified. I would continue using the same KPI definitions and cohort logic after day 90 so the business can see whether early adoption becomes durable retention and whether cannibalization increases, decreases, or remains stable. I would also state explicitly what future evidence would change my recommendation, such as materially different retention, revenue impact, tier-switching behavior, or stronger causal evidence.

Technical Approach
  1. Define the business decision that the 90-day evaluation must support.
  2. Define the eligible population, customer-level subscription grain, reporting window, time zone, prior subscription state, and valid tier-transition rules.
  3. Validate instrumentation and data quality, including missing records, duplicates, timestamps, tier identifiers, repeated switching, freshness, and available control totals.
  4. Define adoption with an explicit numerator and denominator based on customers who had a meaningful opportunity to choose the new tier.
  5. Classify adopters by source, including new subscribers and movements from existing tiers where supported by the data.
  6. Measure cannibalization by identifying movement from more valuable existing tiers and evaluate the associated subscription revenue change.
  7. Measure retention using cohorts with comparable observation windows and clearly identify immature cohorts.
  8. Analyze adoption, retention, cancellations, tier transitions, and subscription revenue trends throughout the 90-day period.
  9. Segment results by meaningful dimensions such as prior tier, customer status, and join cohort while treating sparse groups cautiously.
  10. Compare results with the strongest available baseline, preferring randomized or phased controls and describing uncontrolled comparisons as observational.
  11. Investigate alternative explanations and perform sensitivity checks on important population, metric, and timing definitions.
  12. Present adoption together with cannibalization, retention, revenue impact, limitations, and uncertainty, then recommend an action and state what evidence would change it.
Practical Insights

The main challenge is analytical rather than computational. Subscription histories can contain multiple upgrades, downgrades, cancellations, and reactivations, so customer states and transitions must be reconstructed consistently. Cohort analysis also requires fair observation windows because customers joining near day 90 have less follow-up time. Basic descriptive metrics are relatively straightforward, but estimating incremental impact is harder because it requires a credible baseline or experiment. More segmentation can reveal hidden patterns, but very small groups create noisy estimates. The 90-day window also trades faster decision-making for less certainty about long-term retention and customer value.

Why Interviewers Ask This

This tests whether the analyst can evaluate a product launch beyond simple adoption, define appropriate KPIs and comparison groups, detect cannibalization of more valuable existing tiers, separate observed behavior from causal claims, and turn limited early evidence into a defensible business recommendation.

Common interview mistakes

Common mistakes include treating every new-tier subscriber as incremental growth, ignoring customers who moved from more valuable tiers, using the wrong adoption denominator, comparing cohorts with unequal observation windows, double-counting customers who switch repeatedly, focusing on adoption without retention or revenue, treating 90-day outcomes as proven long-term customer value, ignoring concurrent promotions or pricing changes, skipping instrumentation and data-quality checks, and making causal claims from an uncontrolled before-and-after comparison.

Interview tip

Center the answer on one important tension: adoption can look strong while overall business value gets worse. Define adoption carefully, identify where adopters came from, measure movement away from more valuable tiers, evaluate retention and revenue, validate the comparison, and finish with a proportional recommendation plus the evidence that would change it.
Interviewer may ask next
How would you evaluate the tier if it launched to everyone at once and there was no randomized control group?

I would still measure adoption, retention, tier transitions, cancellations, and subscription revenue, but I would be more cautious about causal claims. I would look for the strongest defensible comparison available, such as historical cohorts or comparable customer groups, and check whether seasonality, promotions, pricing, acquisition mix, or product changes make those comparisons unreliable. Matching or time-based methods could help if their assumptions are reasonable, but the estimated incremental effect would remain observational. I would also compare results across multiple reasonable baselines. If the conclusion changes substantially depending on the baseline, I would report that uncertainty and recommend collecting stronger causal evidence before making a large irreversible decision.

What would you do if the new tier has very high adoption but many adopters are downgrading from a more valuable tier?

I would not treat high adoption as success by itself. I would quantify the count and share of adopters coming from more valuable tiers, measure the associated subscription revenue change, and compare retention, cancellations, and other agreed customer outcomes with the strongest available baseline. I would segment the downgrade pattern by prior tier and cohort to understand where it is concentrated and investigate whether pricing, positioning, eligibility, or benefit design may be encouraging substitution. If the evidence shows that cannibalization materially weakens overall business value, I would recommend revising the tier before wider expansion. If possible longer-term retention benefits are still unobserved after 90 days, I would state that uncertainty rather than assuming they will offset the near-term effect.

22. Why might improved offline recommendation quality fail to increase engagement in an A/B test?Data AnalysisHard

Question Details

Consider a case where NDCG improved but the online engagement metric did not.

Short Interview Answer (30-60 seconds)

Improved offline NDCG does not guarantee higher engagement because NDCG measures ranking quality against offline relevance labels, while engagement measures what real users actually do. The labels or evaluation population may not represent live behavior, the ranking gains may occur where users rarely notice them, treatment users may not receive meaningfully different recommendations, or the A/B test may be too noisy to detect a useful effect. I would validate the experiment and metric definitions first, confirm treatment exposure and ranking changes, inspect the recommendation funnel and meaningful segments, and then judge the online effect with its uncertainty.

Detailed Explanation

The task is to explain why better offline recommendation quality may not produce higher engagement in a real A/B test. NDCG measures how well relevant items are ranked in an offline evaluation set, with more credit when useful items appear near the top. Engagement measures what real users actually do after recommendations are shown. These metrics are related, but they are not the same outcome. I would verify the experiment, define the engagement KPI precisely, confirm users actually received changed recommendations, inspect the user funnel, compare meaningful segments, and decide whether the online effect is truly small or simply uncertain.

Useful Questions to Ask the Interviewer
  1. How is the online engagement metric defined, including its numerator, denominator, eligible population, unit of analysis, and measurement window?
  2. How was NDCG calculated, and what relevance labels or user behaviors were used in the offline evaluation set?
  3. Were users randomized correctly, and did treatment users actually receive recommendations from the new model?
  4. Did the new model materially change the ranked recommendations that users saw?
  5. Did the experiment run long enough and include enough observations to distinguish a business-relevant engagement effect from random variation?
  6. Can we compare results across meaningful, preferably pre-specified segments such as user activity level or recommendation surface?
How to Explain It in an Interview

I would start with the business decision: should the new recommendation system be adopted because its offline NDCG improved? The decision should depend on whether the system improves the online outcome the business cares about, not on NDCG alone.

First, I would define both metrics. NDCG is an offline ranking metric that rewards putting more relevant items closer to the top of a ranked list. It depends on the relevance labels and evaluation population used to calculate it. The online engagement KPI must also be defined precisely, including what action counts as engagement, who is eligible for the metric, the numerator and denominator where applicable, the unit of analysis, and the experiment window. Without consistent metric definitions, the comparison can be misleading.

Second, I would validate the A/B test before diagnosing the model. I would confirm random assignment, eligibility rules, treatment exposure, logging completeness, missing or duplicate events, metric calculations, and experiment duration. I would also verify that treatment users actually received output from the new recommender. If the new model was assigned but a fallback, cache, downstream rule, or serving problem caused users to see nearly the same rankings as control, the experiment did not create enough treatment contrast to test the model's potential effect.

Third, I would compare the offline objective with the online business objective. Higher NDCG only means the ranking became better according to the offline relevance definition. Those relevance labels may be an imperfect proxy for the behavior measured online. Historical labels can reflect previous ranking policies, position bias, selection effects, or user actions that are related to but not identical to the engagement KPI. The offline evaluation population may also differ from live traffic. Therefore, an authentic offline gain can still have little online business impact.

Fourth, I would check where the NDCG improvement occurred. An average NDCG gain could be concentrated in low-traffic cases, users who rarely engage, items below the visible portion of the ranking, or positions where changing order has little behavioral effect. The existing model may also already place strong choices in the most influential positions, so further offline improvements may have diminishing online value. These possibilities should be tested with exposure and ranking-change data rather than assumed.

Next, I would trace the recommendation funnel. Conceptually, I would examine eligible user -> recommendation served -> recommendation viewed -> recommendation interaction -> downstream engagement, using only stages that are supported by the product's actual event definitions. If the ranking changes but users do not view the affected positions, the break occurs before interaction. If recommendation interactions improve but the final engagement KPI does not, the issue is farther downstream. Funnel analysis helps locate where the offline improvement stops translating into behavior.

I would then perform segmentation analysis. This means comparing treatment effects across meaningful, preferably pre-specified groups rather than looking only at the overall average. The model might help one group and hurt another, making the aggregate result close to zero. I would examine segment estimates with their uncertainty and avoid treating small or post-hoc segment differences as real effects without additional validation.

I would also consider product-level constraints that can weaken the relationship between ranking quality and engagement. For example, recommendation visibility, serving latency, surrounding interface elements, candidate availability, or downstream business rules may limit the impact of ranking improvements. These are diagnostic hypotheses, not conclusions, until the relevant data supports them.

Finally, I would separate a statistically inconclusive result from evidence of no meaningful effect. I would inspect the treatment-control estimate, its uncertainty, and whether the experiment was capable of detecting a change large enough to matter to the business. A result that is not statistically distinguishable from zero does not automatically prove the true effect is exactly zero. The effect may be small, the metric may be noisy, or the experiment may have insufficient information.

My recommendation would follow the diagnosis. If the experiment is valid, treatment meaningfully changed recommendations, and the online result rules out an effect large enough to matter, I would not ship solely because NDCG increased. I would reconsider whether the offline objective is sufficiently aligned with the business KPI. If exposure, logging, or serving is defective, I would correct that issue and rerun the experiment. If credible segment differences appear, I would validate them in a pre-specified follow-up test before targeted deployment. Offline metrics should guide model development, while a valid online experiment measures causal business impact.

Technical Approach
  1. Define the business decision: determine whether the new recommendation system should be adopted based on online user impact.
  2. Define NDCG and the online engagement KPI separately, including population, unit of analysis, numerator, denominator, and measurement window where applicable.
  3. Validate randomization, eligibility, treatment exposure, logging, missing or duplicate events, metric calculations, and experiment duration.
  4. Confirm that treatment materially changed the recommendations users actually saw rather than only changing an offline score.
  5. Compare the offline evaluation population and relevance labels with live traffic and the online business objective.
  6. Identify where the NDCG gain occurs, including positions, traffic groups, and recommendation cases that users actually encounter.
  7. Trace the recommendation funnel to locate where ranking changes stop translating into behavior.
  8. Compare meaningful, preferably pre-specified segments and evaluate segment differences with appropriate uncertainty.
  9. Evaluate the overall treatment effect and its uncertainty relative to a business-relevant effect size.
  10. Investigate supported alternative explanations such as objective mismatch, weak treatment contrast, product constraints, serving behavior, or instrumentation problems.
  11. Make a proportional decision: ship, revise the offline objective, repair the experiment, or rerun the test based on the evidence, and continue measuring the online KPI.
Practical Insights

The main cost is analytical rather than algorithmic. The analyst may need to process experiment assignments, recommendation impressions, ranked outputs, exposure events, and engagement events at the correct grain. Funnel and segment analysis can require large joins and repeated aggregations over event data. More segmentation can reveal hidden effects, but it also creates smaller groups, greater uncertainty, and a higher risk of finding random patterns. Longer experiments can provide more information but delay decisions. Offline metrics are faster and cheaper for model iteration, but they are proxies and cannot replace a controlled online test of user behavior.

Why Interviewers Ask This

This tests whether the candidate understands that an offline ranking metric and an online business KPI measure different things. A strong analyst should verify metric definitions, experimental validity, treatment exposure, funnel behavior, segment differences, and statistical uncertainty before concluding that a better offline recommender should increase engagement.

Common interview mistakes

Common mistakes are assuming that higher NDCG must cause higher engagement; treating offline relevance labels as identical to user value; failing to define the online KPI before interpreting it; ignoring whether treatment users were actually exposed to materially different rankings; overlooking randomization, instrumentation, missing events, or serving failures; treating a statistically inconclusive result as proof of zero effect; relying only on the aggregate result when meaningful segments may differ; and searching many post-hoc segments and presenting random variation as causal evidence.

Interview tip

Frame this as an offline-to-online translation problem. Define both metrics, validate the experiment and treatment exposure, confirm rankings actually changed, trace the funnel, inspect meaningful segments, evaluate uncertainty, and finish with the business decision the evidence supports rather than treating NDCG as the final success metric.

Interviewer may ask next
What would you check if NDCG improved strongly offline but treatment and control users received almost identical recommendation lists online?

I would first verify assignment and serving to confirm that treatment users actually reached the new model. Then I would compare the ranked outputs served to treatment and control at the appropriate request or user grain using a suitable measure of item and ranking overlap. If the lists are nearly identical, the experiment has weak treatment contrast, so a null engagement result does not strongly test whether a materially different ranking could change behavior. I would investigate supported causes such as fallback behavior, caching, candidate-generation constraints, downstream business rules, or serving configuration, fix the identified issue, and rerun the experiment if necessary.

What would you do if the overall engagement effect were near zero but some user segments appeared to improve while others declined?

I would check whether the segments were defined before examining the results, whether each segment has enough observations, whether metric definitions and exposure are consistent, and whether the apparent treatment-effect differences are credible relative to their uncertainty. I would be cautious with post-hoc segmentation because examining many groups can create random positive and negative patterns. If the heterogeneity remains credible and has a supported explanation, I would validate it with a pre-specified follow-up experiment before making a targeted deployment decision.

23. How would you standardize inconsistent category labels?Data Quality And ValidationEasy

Question Details

Standardize category spelling, capitalization, whitespace, and controlled mappings without merging genuinely different categories.

Short Interview Answer (30-60 seconds)

I would first profile the category field to find distinct values, frequencies, nulls, whitespace differences, capitalization differences, and unexpected labels. Then I would separate safe normalization, such as trimming whitespace and standardizing capitalization, from business mappings that require an approved reference list. I would never merge labels only because they look similar. I would preserve the original value, map only confirmed variants to a canonical label, route unknown or ambiguous values to an exception process, and validate row counts and category distributions before and after the transformation. Finally, I would document the rules, owners, and regression checks so the standardization stays auditable.

Detailed Explanation

The task is to make category labels consistent without changing what the categories actually mean. Differences caused only by extra spaces or capitalization can often be standardized safely, but similar-looking labels may still represent different business concepts. I would first inspect the existing values, then apply simple text cleanup, followed by an approved mapping to canonical labels. I would preserve the original label for traceability, flag unknown or ambiguous values instead of guessing, and compare row counts and category distributions before and after the transformation to confirm that no records or legitimate categories were accidentally changed.

Useful Questions to Ask the Interviewer
  1. Is there an approved list of valid category labels or a source system that should be treated as the source of truth?
  2. Which differences are considered formatting differences, and which categories must remain distinct?
  3. Should unknown or unmapped labels be rejected, quarantined, or allowed through with a warning?
  4. Do we need to preserve the original category value for auditing or debugging?
  5. Who owns approval of new mappings when previously unseen labels appear?
How to Explain It in an Interview

I would treat this mainly as a consistency and validity problem. Consistency means the same category should be represented the same way across records. Validity means the standardized label should belong to the approved set of allowed categories. I would not assume that two labels with similar text mean the same thing.

First, I would define the expected category domain and source of truth. That may be an approved reference list, business-owned mapping table, or authoritative source field. If no trusted definition exists, I would identify that as a limitation and avoid making semantic mappings until the business meaning is confirmed.

Second, I would profile the category field. I would list distinct values and their counts, check nulls, inspect leading or trailing whitespace, compare capitalization, and identify unexpected labels. This is data profiling: examining the values and patterns in a field before changing them. It shows whether the issue is simple formatting inconsistency or a deeper source-data problem.

Third, I would apply deterministic normalization only where the rule cannot reasonably change business meaning. Examples include trimming leading and trailing whitespace and applying a consistent capitalization rule when capitalization is not meaningful. If repeated internal spaces are known to be accidental formatting, I could normalize those too. These rules should be explicit and reproducible rather than manual edits.

Fourth, I would use a controlled mapping for confirmed aliases. Each observed variant should map to one approved canonical category only when its meaning has been verified. The mapping should come from authoritative business definitions, approved reference data, or a responsible data owner. I would not use fuzzy matching as an automatic merge rule because similar strings can represent genuinely different categories.

Fifth, I would preserve the original category value alongside the standardized value, or otherwise maintain an audit trail. This lets an analyst trace a standardized value back to what arrived from the source and makes mapping errors easier to investigate.

Sixth, I would handle unknown or ambiguous values safely. A value that does not match a safe normalization rule or an approved mapping should not be silently overwritten, dropped, or guessed. I would route it to an exception report or quarantine path with the original value and the reason it could not be mapped. The responsible owner can then decide whether it is a new valid category, a source defect, or a new alias that should be added to the mapping.

Seventh, I would validate the transformation. I would compare row counts before and after because standardizing a category field should not unexpectedly add or remove records. I would compare distinct-category counts and value distributions, review the number of source labels mapping to each canonical category, and verify that every standardized non-null value belongs to the approved category set. I would also reconcile important grouped counts when category changes feed reporting, because an incorrect merge can move records between groups even when the total row count remains unchanged.

I would distinguish source defects from transformation defects. If an invalid label already exists in the source, the standardization layer should record and handle that fact rather than hiding it. If the transformation itself produces an unexpected value or wrong mapping, I would trace the rule and data lineage back through the processing steps to find where it was introduced.

Finally, I would make the solution preventive. I would keep the mapping as a governed rule, assign an owner, version or otherwise record mapping changes, add regression checks for unexpected categories, and define safe failure behavior when a new value appears. The tradeoff is that strict controls require some review and maintenance, but they reduce the risk of silently merging distinct categories and producing misleading downstream analysis.

Technical Approach
  1. Define the authoritative category domain, source of truth, and ownership.
  2. Profile distinct labels, counts, nulls, whitespace, capitalization, and unexpected values.
  3. Separate safe text normalization from semantic category mapping.
  4. Apply only deterministic normalization rules that do not change business meaning.
  5. Map confirmed aliases to canonical labels using an approved mapping rule or reference table.
  6. Preserve the original label and mapping evidence for traceability.
  7. Route unmapped or ambiguous labels to an exception process instead of guessing, dropping, or overwriting them.
  8. Validate row counts, allowed-value validity, distinct-category counts, distributions, and relevant grouped totals before and after.
  9. Investigate whether any defect originated in the source or in the transformation.
  10. Document mappings, owners, safe-failure behavior, and regression checks so the process remains auditable and maintainable.
Practical Insights

For each data refresh, the processing cost is mainly proportional to the number of records being standardized. Lookup-based mappings are normally efficient, even when the mapping list grows. The larger cost is governance: reviewing ambiguous labels, approving new mappings, recording changes, and maintaining regression checks. Simple formatting cleanup is fast, while stricter exception handling adds operational work but lowers the risk of silently combining different categories.

Why Interviewers Ask This

Interviewers want to see whether I can improve category consistency without changing the underlying business meaning. The key judgment is separating safe formatting cleanup from semantic mappings that require an approved source of truth, while making the process traceable, testable, and safe for downstream reporting.

Common interview mistakes

Common mistakes include normalizing every label without confirming business meaning, automatically merging similar strings with fuzzy matching, overwriting the raw source value, silently dropping unknown categories, inventing mappings when no source of truth exists, and validating only total row counts. Another mistake is hard-coding mappings without an owner, audit trail, or regression check for new category values.

Interview tip

Clearly separate formatting normalization from semantic mapping. Emphasize that you would preserve the raw value, never merge genuinely different categories just because their text is similar, route uncertain values to an exception process, and validate both row counts and category-level distributions before trusting the result.

Interviewer may ask next
What would you do if two category labels look almost identical but you are not sure whether they mean the same thing?

I would not merge them automatically. I would keep the original labels separate, inspect the authoritative category definition and source lineage, and ask the responsible data or business owner to confirm whether they are aliases or genuinely different categories. Until that is confirmed, I would treat the uncertain value as an exception. This prevents a false merge from changing grouped counts or downstream analysis.

How would your approach change if new category labels appeared frequently?

I would keep safe normalization rules stable and manage semantic mappings through a governed reference table or equivalent controlled rule set with ownership and change history. New unmapped labels would fail safely into an exception process rather than being guessed. I would add a recurring validation rule for unexpected categories and require review before approving a new alias or canonical category. This creates more governance work, but it makes category drift visible and keeps the transformation auditable.

24. How would you clean dates and numbers stored in inconsistent formats?Data Quality And ValidationEasy

Question Details

When cleaning dates and numbers, consider ambiguous date conventions, numeric separators, and failed conversions.

Short Interview Answer (30-60 seconds)

I would first profile the raw date and numeric values instead of converting everything immediately. For dates, I would identify the formats present and resolve ambiguous day-month versus month-day conventions using reliable source metadata or documented business rules. For numbers, I would determine what commas, periods, spaces, signs, and symbols mean before changing them. I would then apply explicit conversion rules, preserve the raw values, quarantine failed or ambiguous conversions with a reason, and validate row counts, nulls, ranges, and applicable control totals before using the cleaned fields.

Detailed Explanation

Cleaning inconsistent dates and numbers means converting different representations into reliable standard types without changing their meaning. The main risk is guessing. An ambiguous date can represent different calendar dates depending on the source convention, while a numeric separator can mean either a decimal mark or a thousands separator. I would therefore inspect the raw patterns first, confirm the expected conventions from reliable source information or documented rules, convert only values covered by clear rules, preserve the original value, and flag anything ambiguous or invalid instead of silently repairing it. This protects accuracy, consistency, validity, and traceability.

Useful Questions to Ask the Interviewer
  1. What date formats and regional conventions are expected from each source?
  2. Is there source metadata, locale information, or a file specification that can resolve ambiguous dates or numeric separators?
  3. What numeric units, scales, and decimal conventions should each field use?
  4. Should invalid or ambiguous records be rejected, quarantined, or returned to the source owner for correction?
  5. Which row counts or control totals should remain unchanged after cleaning?
How to Explain It in an Interview

I would treat this as a controlled data-quality process rather than a simple find-and-replace operation.

First, I would preserve the raw columns and profile the values. For date fields, I would identify the distinct patterns and determine which are clearly interpretable and which are ambiguous. For numeric fields, I would inspect decimal marks, thousands separators, spaces, signs, symbols, null-like strings, and other unexpected characters. Data profiling helps me define rules from observed patterns instead of assuming one format applies everywhere.

Next, I would define the expected target schema. Dates should become the required date or timestamp type using an explicitly understood convention. Numbers should become the required numeric type while preserving their intended units and scale. If time zones, currencies, percentages, or measurement units matter, I would confirm those meanings before normalizing the values.

For dates, I would use explicit parsing rules instead of relying on automatic format guessing. Unambiguous formats can be parsed according to their known pattern. Ambiguous values should be resolved only when reliable metadata or a documented rule establishes the intended convention. If the evidence is insufficient, I would flag the value as ambiguous rather than choosing an interpretation.

For numbers, I would first determine what each separator and symbol means. A comma or period can have different meanings under different regional conventions, so removing characters without understanding the source can change the value. I would normalize only the characters covered by the documented source convention and then convert the result to the required numeric type.

I would use safe conversion behavior so malformed or unsupported values become exceptions rather than silently incorrect values. Each failed or ambiguous conversion should retain its raw value and a reason, such as an unsupported format, an unresolved convention, or a conversion failure. Those records can be quarantined or included in an exception report for review.

After conversion, I would validate the output. I would compare row counts before and after the transformation to confirm that cleaning did not accidentally remove records. I would compare null and failed-conversion counts, check resulting date and numeric ranges for unexpected values, and reconcile applicable numeric control totals to the source when those totals should remain unchanged. A control total is an expected aggregate, such as a count or sum, used to verify that processing preserved the intended data.

I would also inspect representative source-to-cleaned mappings and investigate unexpected clusters of failures. If a rule suddenly creates many invalid values, I would trace those records through the data lineage to determine whether the defect came from the source data, a schema change, or the transformation itself.

The most relevant data-quality dimensions are validity, accuracy, consistency, and completeness. Validity asks whether a value follows the allowed representation or type. Accuracy asks whether the cleaned value still represents the intended source value. Consistency means the same documented convention is applied predictably. Completeness checks whether usable information was unintentionally lost during cleaning.

Finally, I would document the accepted formats, assumptions, conversion rules, exception reasons, and known limitations. For recurring data, I would turn the confirmed rules into automated validation checks with clear ownership and safe failure behavior. If a new format or separator convention appears, the pipeline should surface an exception or alert rather than silently applying an unsafe conversion. The goal is not simply to make every value parse; it is to produce standardized fields whose meaning can be trusted, reproduced, and audited.

Technical Approach
  1. Preserve the original date and numeric values.
  2. Profile observed formats, separators, symbols, nulls, failures, and ranges.
  3. Define the target data types, units, scale, and accepted source conventions.
  4. Resolve date conventions using reliable source metadata or documented rules.
  5. Define source-aware numeric rules for decimal marks, thousands separators, signs, symbols, and units.
  6. Convert values using explicit parsing rules rather than uncontrolled guessing.
  7. Quarantine ambiguous or failed conversions and record a reason while preserving the raw value.
  8. Compare row counts and null counts before and after transformation.
  9. Validate output ranges and reconcile applicable control totals to the source.
  10. Review exceptions, document assumptions and limitations, and convert confirmed rules into repeatable validation checks.
Practical Insights

The main processing cost is scanning and parsing each value, so the work generally grows with the number of records. Supporting several source conventions also increases rule and maintenance complexity. Explicit rules require more setup than automatic guessing, but they reduce the risk of silently misinterpreting dates or numbers. Preserving raw values and exception records uses some additional storage, but it improves traceability, debugging, and recovery.

Why Interviewers Ask This

Interviewers want to see whether I can standardize inconsistent values without guessing, especially when date conventions are ambiguous or numeric separators can change a value's meaning. They are testing whether I preserve source data, define explicit parsing rules, isolate failures, and verify that cleaning does not silently corrupt valid information.

Common interview mistakes

Common mistakes include allowing a tool to guess ambiguous date formats, assuming one regional convention applies to every source, removing commas or periods without knowing whether they represent decimals or thousands, overwriting the raw value, converting failures to null without recording why, ignoring units or scale, silently dropping failed records, and skipping row-count, range, or control-total validation after transformation.

Interview tip

Present the process in a clear order: profile first, confirm source conventions, define explicit conversion rules, preserve the raw values, quarantine ambiguity or failures, and validate the cleaned output. Stress that you would not guess when a format has more than one valid interpretation.

Interviewer may ask next
What would you do if an all-numeric date could validly follow more than one date convention?

I would not infer the meaning from the ambiguous value alone. I would check reliable evidence such as the source specification, locale metadata, upstream system configuration, or a documented business rule. If that evidence establishes one convention, I would apply and document it consistently. If the convention still cannot be determined, I would preserve the raw value and flag the record as ambiguous rather than creating a potentially incorrect date.

What would you change if several source systems use different numeric conventions?

I would make the parsing rules source-specific rather than applying one global cleanup rule. Each source would have a documented convention for decimal marks, thousands separators, units, scale, and permitted symbols. I would normalize each source into the common target type only after interpreting its original convention correctly. I would then validate failure counts, ranges, row counts, and applicable control totals by source so a format or schema change in one system can be detected without corrupting data from the others.

25. What validation checks would you apply during data cleaning?Data Quality And ValidationEasy

Question Details

During data cleaning, discuss validation of values, formats, permissible ranges, and relationships that should hold.

Short Interview Answer (30-60 seconds)

During data cleaning, I would first confirm the expected schema and row grain, then validate required fields, data types, and formats. I would check nulls, duplicates, allowed categories, and permissible ranges, and verify key relationships such as referential integrity. After transformations, I would compare row counts and important control totals with the source so I can detect lost, duplicated, or changed data. I would flag or quarantine invalid records instead of silently fixing them, trace unexpected results through data lineage, and document the rules, exceptions, assumptions, and known limitations.

Detailed Explanation

Data cleaning is not only about changing incorrect values. I also need to prove that the cleaned data still represents the intended records correctly. I would define what each field should contain, which values are required, what formats and ranges are permissible, and which relationships must hold. Then I would compare the cleaned result with the source using row counts and important control totals. Any failed check should be visible, explained, and traceable instead of being silently removed or overwritten. This protects the accuracy and reliability of later analysis and decisions.

Useful Questions to Ask the Interviewer
  1. What is the expected row grain, and which fields uniquely identify a record?
  2. Which fields are mandatory, and when are null values acceptable?
  3. Are there approved value lists, formats, units, or permissible ranges for important fields?
  4. Which relationships between records or datasets must always hold?
  5. What source system should be treated as the source of truth for reconciliation?
  6. Which row counts, totals, or other control values should remain unchanged after cleaning?
  7. Should invalid records be rejected, quarantined, corrected by a defined rule, or sent for review?
  8. Are there known data limitations, timing expectations, or accepted exceptions that should not be treated as errors?
How to Explain It in an Interview

I would organize validation from the structure of the data through individual values and relationships, and then reconcile the cleaned output back to the source.

First, I would confirm the expected schema, population, and row grain. The schema describes which fields should exist and their expected types or formats. The row grain describes what one row represents. I would check for missing or unexpected columns, changed types, unexpected schema changes, and transformations that accidentally change the intended grain. This is important because a dataset can contain valid-looking values while still being structurally wrong.

Next, I would consider the main data quality dimensions. Completeness means required information is present. Accuracy means values correctly represent the underlying source or reality as far as the available evidence can establish. Consistency means the same information follows compatible definitions and rules across the data. Validity means values satisfy defined formats, domains, and business rules. Uniqueness means records that should occur once are not duplicated at the required grain. Timeliness means the data is current enough for its intended use. I would select checks from these dimensions according to the actual data requirements rather than treating them as a generic checklist.

For completeness, I would profile null values and determine whether each missing value is permitted. A null check should be based on a defined requirement because a missing value can be either a legitimate state or a data defect. I would not automatically fill nulls, because imputation can create false information unless there is a justified, documented, and auditable rule.

For formats and permissible values, I would verify that fields conform to their expected representation and domain. For example, a field expected to contain dates should be parseable according to the agreed format, and categorical fields should use approved values when an authoritative list exists. Unexpected categories should be reported rather than silently mapped unless a documented mapping rule exists. A value can be correctly formatted but still be inaccurate, so format validation alone is not enough.

I would also apply range checks. A range check verifies that a value lies inside an allowed or logically permissible boundary. The range must come from an authoritative rule, metadata, or business input rather than an invented threshold. I would test boundary conditions carefully so valid minimum or maximum values are not rejected accidentally. Values outside the rule should be treated as exceptions until their cause is understood.

Next, I would test uniqueness. If the expected grain requires one row per key, I would check whether that key is unique. I would not simply delete duplicates because two apparently similar rows may represent valid repeated observations if the real grain includes another field or time dimension. Duplicate handling therefore starts with confirming what makes a record unique.

I would then validate relationships between records. Referential integrity means that a reference to another entity should have a corresponding valid record when that relationship is required. Broken references can result from missing source records, transformation defects, incorrect joins, or timing differences between datasets. I would report these exceptions and determine their cause rather than silently dropping unmatched rows.

After value-level validation, I would reconcile the cleaned data with the source system. Reconciliation means comparing independent counts or totals to make sure the transformation preserved what it was supposed to preserve. I would record row counts before and after important transformations and explain every expected difference. I would also compare relevant control totals with the source when such totals are available. A control total is an independently checked aggregate, such as a count or sum, used to detect unintended changes. Matching row counts alone is insufficient because values can change incorrectly without changing the number of rows, while matching an aggregate alone can hide offsetting errors.

I would also distinguish source defects from transformation defects. If a questionable value already exists in the source, I would confirm the appropriate handling rule rather than assuming the cleaning process should change it. If the source is valid but the output becomes wrong, I would use data lineage to trace the affected field or metric through each transformation. Data lineage is the path showing where data originated and how it changed before reaching the final dataset or report.

For failed checks, I would use safe exception handling. Invalid records should be flagged or quarantined with the failed quality rule and reason when possible. I would avoid silently deleting, overwriting, imputing, or repairing records because that removes evidence and can introduce unsupported assumptions. An exception report allows the issue to be reviewed, assigned to an owner, and resolved without contaminating trusted downstream output.

I would also assess impact. A failed rule affecting a field that drives a reported result may require the downstream output to be blocked or clearly marked unsafe, while a lower-impact issue may be documented and monitored. The decision should depend on the agreed quality requirement and downstream use, not on an invented universal threshold.

Finally, I would document assumptions, rules, failed checks, known limitations, ownership, and resolution evidence. This creates an audit trail showing what was tested and what remains uncertain. For recurring data, I would turn important rules into repeatable regression checks and alerts. That helps detect schema changes, unexpected categories, null increases, duplicates, broken references, reconciliation failures, or delayed data before the problem reaches a report or decision maker.

Technical Approach
  1. Define the source of truth, expected population, schema, row grain, required fields, valid formats, permissible values, ranges, keys, relationships, and timeliness requirements.
  2. Profile the input for nulls, duplicates, ranges, unexpected categories, and schema changes.
  3. Validate required values, field types, formats, and allowed categories.
  4. Apply authoritative range and boundary checks.
  5. Check uniqueness at the expected row grain.
  6. Validate keys and referential integrity where relationships are required.
  7. Record row counts before and after important transformations and explain expected differences.
  8. Reconcile relevant control totals with the source system when authoritative comparison values are available.
  9. Separate source defects from transformation defects and trace unexpected results through data lineage.
  10. Flag or quarantine invalid records with reasons instead of silently deleting, overwriting, imputing, or repairing them.
  11. Assess downstream impact and use safe failure when a defect makes the output unreliable.
  12. Document assumptions, exceptions, known limitations, ownership, and resolution evidence in an audit trail.
  13. Add repeatable quality rules, alerts, and regression checks for future runs.
Practical Insights

Most validation checks require reading the relevant data, so their work generally grows with the number of rows and fields being checked. Duplicate and relationship checks can require extra grouping, sorting, indexing, or lookups. Reconciliation can also require reading the source and cleaned outputs. More rules can increase confidence, but they also increase processing and maintenance costs. The important tradeoff is to use rules that materially protect the intended analysis while keeping them understandable, maintainable, auditable, and based on authoritative requirements.

Why Interviewers Ask This

The interviewer wants to know whether the analyst can clean data without accidentally introducing new errors. The exact judgment is whether the analyst can choose checks for completeness, accuracy, consistency, validity, uniqueness, timeliness, and relationships, then prove that transformations did not lose, duplicate, or incorrectly alter data.

Common interview mistakes

Common mistakes include checking only for nulls, assuming a correctly formatted value is accurate, treating every unusual value as invalid, deleting duplicates without confirming the row grain, inventing permissible ranges, ignoring broken relationships, and checking only the final output without reconciling it with the source. Other mistakes are relying only on row counts, silently dropping or overwriting failed records, automatically imputing missing values without justification, confusing source defects with transformation defects, and failing to document rules, exceptions, assumptions, ownership, and known limitations.

Interview tip

Present the checks in layers: schema and grain, completeness, formats and permissible values, ranges, uniqueness, relationships, then source reconciliation. Emphasize that validation rules need an authoritative basis, every transformation should be checkable, and failed records should remain traceable through exceptions and an audit trail.

Interviewer may ask next
How would you validate a field when you do not know the correct permissible range in advance?

I would not invent a threshold. I would first look for an authoritative business rule, source-system constraint, data dictionary, contract, or subject-matter owner. Until the rule is confirmed, I could profile the observed distribution and flag unusual values for investigation, but I would clearly treat that as exploratory evidence rather than a formal validity rule. Once the permissible range is confirmed, I would test normal values, boundary values, null behavior where relevant, and values just outside the boundary, then document the rule and its source.

What would you do if the cleaned dataset passes row-count checks but an important control total no longer matches the source?

I would treat that as a failed reconciliation because equal row counts do not prove that values were preserved correctly. I would compare the control total before and after each relevant transformation, identify which records or values changed, and trace the affected field through data lineage. Possible causes include incorrect conversions, calculations, joins, mappings, or unsupported cleaning changes. I would not publish a result that depends on the unexplained discrepancy. I would preserve the exception, determine whether the defect came from the source or the transformation, document the resolution, and add a regression check so the same failure is detected in future runs.

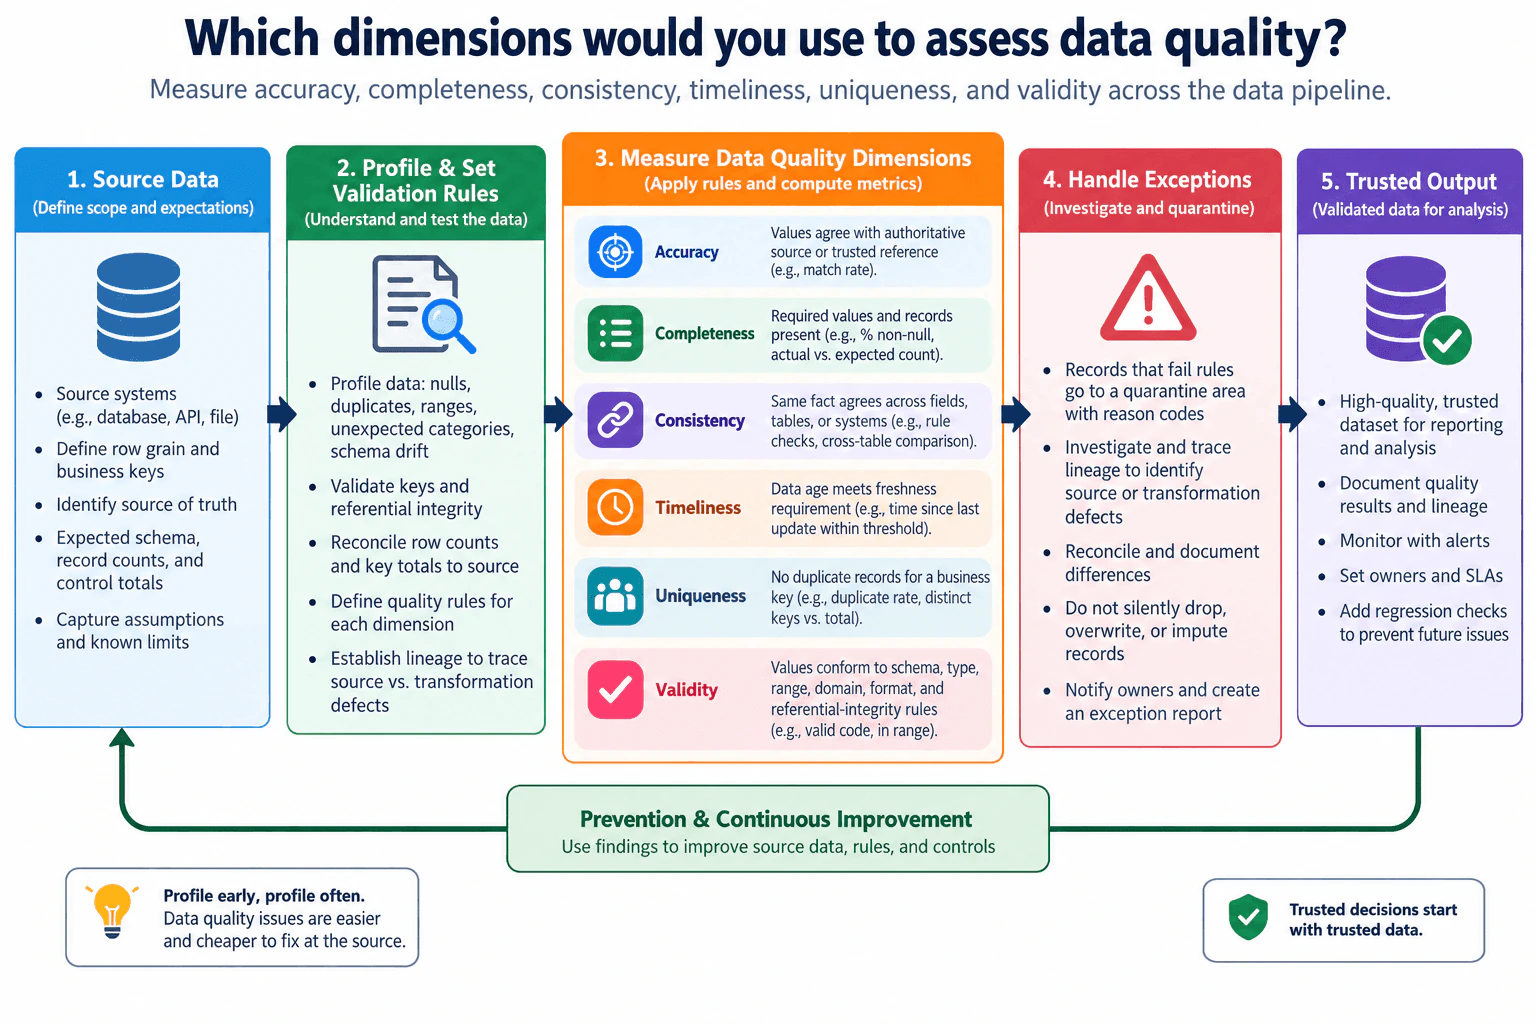
26. Which dimensions would you use to assess data quality?Data Quality And ValidationEasy

Question Details

Explain how you would measure data accuracy, completeness, consistency, timeliness, uniqueness, and validity.

Short Interview Answer (30-60 seconds)

I would use six core dimensions: accuracy, completeness, consistency, timeliness, uniqueness, and validity. I would first define the row grain, source of truth, expected schema, business keys, and quality rules. Then I would measure accuracy against a trusted reference, completeness with required-record and non-null checks, consistency across fields or systems, timeliness against freshness requirements, uniqueness with duplicate-key checks, and validity against type, range, domain, format, and referential-integrity rules. I would also reconcile row counts and key totals, quarantine failures with reasons, trace lineage, document exceptions and ownership, and add monitoring and regression checks.

Detailed Explanation

Data quality means checking whether data is trustworthy enough for the decision it will support. I would not rely on one score. I would measure six dimensions: accuracy, completeness, consistency, timeliness, uniqueness, and validity. Before measuring them, I would define the expected schema, row grain, business keys, source of truth, and freshness expectations. Then I would profile the data, apply explicit quality rules, reconcile counts and key totals to the source, and route failed records to an exception process. The goal is trusted output with clear evidence, ownership, lineage, monitoring, and prevention.

Useful Questions to Ask the Interviewer
  1. What is the row grain, and which source or system is the source of truth?
  2. Which fields, business keys, totals, and relationships are critical for the downstream decision?
  3. What freshness requirement or reporting window defines acceptable timeliness?
  4. What should happen when a record fails a rule: quarantine it, stop the pipeline, or continue with a documented exception?
  5. Who owns each quality rule and approves any repair, exclusion, or threshold change?
Which dimensions would you use to assess data quality? diagram
How to Explain It in an Interview

I would start with the data contract: expected schema, row grain, source of truth, business keys, quality rules, reconciliation boundary, and freshness expectations. That gives every check a clear meaning and denominator.

For accuracy, I would ask whether values agree with an authoritative source or trusted reference. A practical measure can be the share of comparable values that match the reference, using any business-approved tolerance where exact equality is not appropriate. Accuracy is different from validity: a value can follow the correct format and still be factually wrong.

For completeness, I would check whether required records and required values are present. At field level, a common measure is non-null required values / expected required values. At dataset level, I would also compare actual versus expected record counts when the expected population is known. I would not treat every null as an error because some fields may legitimately be optional.

For consistency, I would test whether the same fact agrees across fields, tables, systems, and time where those values are expected to match. This can include cross-field business rules, cross-table comparisons, and relationship checks. I would establish the authoritative representation before labeling a difference as a defect.

For timeliness, I would check whether the data is available and current within the required freshness window. A practical measure is data age, such as elapsed time since the relevant source update, compared with the agreed freshness threshold. I would use the correct timestamps, time zone, reporting interval, and update definition so the result is meaningful.

For uniqueness, I would check whether the declared business key appears only once when the row grain requires one record per key. I would count duplicate keys and calculate the duplicate rate against the defined population. Repeated values are not automatically defects if the intended grain legitimately permits them, so the grain and business key must be established first.

For validity, I would check whether values conform to defined schema and business rules: data type, range, allowed domain or category, format, key rules, and referential integrity. A valid record follows the stated rules, but validity alone does not prove that the value is accurate.

Before and after transformations, I would profile nulls, duplicates, ranges, unexpected categories, and schema drift. I would also compare row counts and reconcile important key or control totals to the source system. Reconciliation helps reveal missing, duplicated, filtered, or incorrectly transformed data even when individual field checks appear to pass.

If a rule fails, I would not silently drop, overwrite, or impute the record. I would quarantine the invalid record or otherwise fail safely according to the agreed rule, attach a reason code, create an exception report, and retain the evidence in an audit trail. I would then trace the affected metric through data lineage to determine whether the defect originated in the source or in a transformation.

Finally, I would assess the downstream decision impact, notify the appropriate owner, and document assumptions and known limitations. I would add monitoring, alerts, regression checks, and recovery evidence so the same issue is detected earlier next time. The dataset should be treated as trusted only after the required validation and reconciliation checks pass or an explicitly approved exception is documented.

Technical Approach
  1. Define the expected schema, row grain, business keys, source of truth, freshness requirement, quality rules, and reconciliation boundary.
  2. Profile nulls, duplicates, ranges, unexpected categories, and schema drift.
  3. Validate keys and referential integrity.
  4. Measure accuracy, completeness, consistency, timeliness, uniqueness, and validity using explicit rules with defined populations and denominators.
  5. Reconcile row counts and key control totals to the source before and after transformations.
  6. Route failures to a safe exception path with reason codes rather than silently changing records.
  7. Trace lineage to separate source defects from transformation defects and assess downstream impact.
  8. Document assumptions, evidence, ownership, exceptions, and known limits.
  9. Add alerts, monitoring, regression checks, and a prevention loop.
Practical Insights

The cost depends mainly on the data volume, the number of validation rules, and how many source-to-target comparisons are required. Simple null, range, validity, and duplicate checks usually require scanning the relevant data. Cross-system reconciliation and lineage investigation can cost more because data must be compared across sources and transformation stages. More rules improve coverage but also add runtime, maintenance, and false-positive risk. The practical tradeoff is to prioritize checks that protect important decisions, automate repeatable controls, and keep thresholds, denominators, and ownership explicit.

Why Interviewers Ask This

Interviewers want to see whether the analyst can turn the idea of good data into measurable, auditable checks before data is used for reporting or decisions. They are testing whether the analyst can define the six quality dimensions correctly, choose practical validation rules, reconcile results to the source, handle failures safely, trace defects through lineage, and prevent the same problem from recurring.

Common interview mistakes

Common mistakes are treating data quality as only a null check; confusing validity with accuracy; measuring duplicates without first defining the business key and row grain; assuming every null or repeated value is invalid; skipping source-to-target reconciliation; using freshness timestamps without a defined window or time zone; silently dropping, overwriting, or imputing failed records; ignoring schema drift and referential integrity; and reporting a quality percentage without defining its population, denominator, rule, threshold, and business impact.

Interview tip

Name the six dimensions first, then give one measurable check for each. After that, explain the end-to-end flow: define the source of truth and grain, profile and validate, reconcile counts and totals, quarantine failures with reasons, trace lineage, document ownership and limitations, and add monitoring and regression checks. This makes the answer practical rather than just a list of definitions.

Interviewer may ask next
What would you do if a field has many nulls but the business says the field is optional?

I would not label those nulls as defects automatically. I would first confirm the rule and the population for which the field is actually required. Completeness should be measured only against values that are expected to be present. If the field is conditionally required, I would segment the check by that condition, document the assumption, and validate the rule with the data owner. Nulls that are allowed can still be profiled and monitored for unexpected changes, but they should not reduce the completeness measure unless they violate the agreed requirement.

What if all six dimension checks pass but a report total still does not match the source?

I would treat the reconciliation failure as a real data-quality signal and would not call the output trusted until the difference is explained. I would compare row counts and control totals at transformation boundaries, then trace lineage to locate where records or values changed. The cause could be filtering, joins, aggregation, duplication, missing records, or another transformation defect that field-level rules did not catch. I would quarantine or hold the affected output according to the safe-failure rule, document the difference and downstream impact, assign an owner, correct the cause through an auditable process, rerun validation and reconciliation, and add a regression check for that failure mode.

27. How would you profile a dataset you have not encountered before?Data Quality And ValidationEasy

Question Details

For an unfamiliar dataset, describe the structural, column-level, and relationship checks in your initial profiling.

Short Interview Answer (30-60 seconds)

I would start by understanding where the dataset came from, what one row represents, and what each column is supposed to mean. Then I would inspect the schema, row count, data types, keys, and time coverage. At the column level, I would profile nulls, distinct values, duplicates, ranges, distributions, and unexpected categories. If multiple tables or related fields exist, I would test key uniqueness and referential integrity. Finally, I would reconcile important counts or totals to the source when possible, document assumptions and exceptions, and avoid using the data for important decisions until material quality issues are understood.

Detailed Explanation

When I receive a dataset I have never seen before, my first goal is to understand what the data represents before analyzing it. I want to know what one row means, what columns exist, which fields may identify records, and whether the data appears complete and internally consistent. I then profile each relevant column for missing values, unusual values, duplicates, categories, and ranges. If relationships exist between tables or fields, I validate those too. The result is a clear picture of the dataset's structure, quality risks, assumptions, limitations, and whether it is reliable enough for the intended analysis.

Useful Questions to Ask the Interviewer
  1. What business question or decision will this dataset support?
  2. What does one row represent, and are there expected primary or business keys?
  3. Is there a data dictionary, schema definition, or source-system documentation available?
  4. What time period should the dataset cover, and how fresh is it expected to be?
  5. Are there known quality rules, acceptable ranges, required fields, or valid categories?
  6. Are there other tables that this dataset should relate or join to?
  7. Is there a source system or control total I can use for reconciliation?
  8. Are any missing values, duplicates, special codes, or exceptional records expected by design?
How to Explain It in an Interview

I would profile the dataset in layers so that each check builds on the previous one.

First, I would understand the purpose and source. I would identify what decision or deliverable the data will support, where the data originated, how it was produced, and whether transformations have already occurred. I would also confirm the relevant population, expected time window, units, reporting interval, and source of truth when those details matter. This prevents me from analyzing technically valid data under the wrong business interpretation.

Next, I would establish the row grain. Grain means what one row represents. I would not assume that each row is a unique entity, event, or transaction without evidence. I would look for candidate keys and test whether they are unique. If a supposed key appears multiple times, I would investigate whether those rows are actual duplicates or whether the real grain is more detailed than expected.

Then I would inspect the structural profile. I would record the row count, column count, column names, data types, and available metadata. I would compare the observed schema with any expected schema and look for missing, new, renamed, or unexpectedly typed fields. These differences can indicate schema change or an incorrect extract. If transformation stages are available, I would compare row counts before and after transformations. A row-count change is not automatically wrong, but it should have an explainable cause.

At the column level, I would profile fields according to their meaning. For completeness, I would measure whether required data is present by checking null or missing-value counts and rates. For uniqueness, I would inspect distinct counts and duplicate patterns, especially for identifiers. For validity, I would test whether values follow expected formats, categories, ranges, and date rules. For consistency, I would look for the same concept represented with incompatible labels, formats, or units. For timeliness, I would inspect relevant timestamps or dates to determine whether the data is current enough for its intended use. Accuracy means whether values correctly represent the real-world or authoritative source, so I would validate accuracy against a trusted source when one exists rather than claiming it from profiling alone.

I would also inspect distributions rather than relying only on minimum and maximum values. Numeric fields can contain extreme or unusual values even when they pass a broad range check. Categorical fields can reveal unexpected labels, spelling variations, rare categories, placeholders, or inconsistent capitalization. Date fields can reveal unexpected gaps, future dates, missing periods, or boundary problems. I would treat unusual values as exceptions to investigate rather than automatically deleting or correcting them.

If the dataset contains related tables, I would validate the relationships. I would identify the intended join keys, test uniqueness on the expected parent side, inspect null keys, and check referential integrity. Referential integrity means that a child record that references a parent should have a matching parent key when the relationship requires one. I would also check join cardinality because an unexpected many-to-many relationship can multiply rows and distort downstream metrics.

Where an authoritative source is available, I would perform reconciliation. Reconciliation means comparing important counts or control totals between the dataset and a trusted source or processing checkpoint. I might compare row counts, counts by a defined period, or another explicitly defined total. Before comparing, I would make sure both sides use the same population, grain, filters, units, and time window. A mismatch would lead me to investigate missing records, duplication, transformation logic, filtering, timing differences, or scope differences instead of immediately assuming one side is wrong.

I would organize the main quality findings using six dimensions. Completeness asks whether required data is present. Accuracy asks whether values correctly represent reality or an authoritative source. Consistency asks whether equivalent concepts use compatible definitions, formats, and units. Validity asks whether values follow defined rules. Uniqueness asks whether records or keys that should be unique really are. Timeliness asks whether the data is available and current enough for its intended use.

For every material issue, I would separate observation from interpretation. Finding duplicate values is an observation; calling those rows incorrect requires evidence about the expected grain and key. Likewise, a null is not necessarily a defect because a field may legitimately be optional. I would verify important assumptions using documentation, source owners, business rules, reconciliation evidence, or data lineage when available.

If records fail a confirmed quality rule, I would not silently delete, overwrite, impute, or repair them. When appropriate, I would quarantine the invalid records and preserve the reason for failure in an exception report or audit trail. I would document the failed rule, affected data, possible downstream impact, known limitations, and ownership for resolution. Safe failure is more important than allowing questionable records to silently influence a report or decision.

If a bad metric appears downstream, I would use data lineage to trace it backward through transformations toward the source. This helps distinguish a source defect from a transformation defect. I would compare row counts and control totals at relevant boundaries and inspect where the discrepancy first appears.

Finally, I would summarize whether the dataset is fit for the intended use. I would clearly state confirmed findings, unresolved risks, assumptions, and checks that still require evidence. I would make the conclusion no stronger than the validation supports. For recurring data, I would convert important findings into repeatable quality rules, regression checks, alerts, ownership, and recovery evidence so future failures can be detected and investigated consistently.

Technical Approach
  1. Clarify the dataset's purpose, source, intended decision, population, time window, units, and available documentation.
  2. Establish the row grain and identify candidate primary or business keys without assuming uniqueness.
  3. Inspect the structural profile: row count, column count, column names, data types, schema, and available metadata.
  4. Compare the observed structure with expectations and investigate missing, new, renamed, or differently typed fields.
  5. Profile relevant columns for nulls, distinct values, duplicates, ranges, distributions, formats, dates, and unexpected categories.
  6. Evaluate completeness, accuracy where independently verifiable, consistency, validity, uniqueness, and timeliness.
  7. Validate keys and relationships, including uniqueness, null keys, referential integrity, and expected join cardinality.
  8. Reconcile important counts or control totals to an authoritative source when available, using matching scope, grain, units, filters, and time windows.
  9. Investigate exceptions without silently deleting, overwriting, imputing, or repairing records; trace lineage when the source of a defect is unclear.
  10. Document assumptions, known limitations, exceptions, downstream impact, ownership, and the evidence required for resolution.
  11. Conclude whether the data is fit for the intended use and define repeatable quality rules, alerts, regression checks, safe-failure behavior, and recovery evidence for future runs.
Practical Insights

The cost depends mainly on the number of rows, columns, distinct values, and relationships. Basic row counts, null checks, range checks, and many duplicate checks require scanning the relevant data, so larger datasets take more processing time. Exact distinct counts, sorting, and relationship checks can also become expensive at large scale. I would begin with inexpensive structural checks and then run deeper checks where they matter most. Sampling can make initial exploration faster, but it can miss rare defects, so important final quality checks should use the full relevant population when feasible.

Why Interviewers Ask This

The interviewer wants to see whether I can examine unfamiliar data systematically, understand its structure and grain, identify data-quality risks, validate important relationships, and determine whether the data is suitable for analysis before drawing conclusions.

Common interview mistakes

Common mistakes include starting analysis before establishing the row grain; assuming a field is a unique key without testing it; checking only nulls while ignoring duplicates, ranges, distributions, categories, timeliness, and relationships; treating every null or outlier as an error; trusting declared data types without checking values; joining tables without validating cardinality and referential integrity; reconciling totals whose populations, filters, units, or time windows differ; silently deleting or repairing suspicious records; and claiming that data is accurate when no authoritative evidence supports that conclusion.

Interview tip

Present the process in a clear order: understand the purpose and grain, inspect the structure, profile columns, validate keys and relationships, reconcile to a trusted source, investigate exceptions, and document whether the data is fit for use. Emphasize that profiling identifies suspicious conditions, while confirmed business rules and source evidence determine whether those conditions are actual defects.

Interviewer may ask next
What would you do if a column that is expected to be unique contains duplicate values?

I would first confirm that uniqueness is truly required by the documented grain or business rule. Then I would group by the candidate key and inspect the duplicate records to determine whether they are exact duplicates, legitimate records at a finer grain, or conflicting records. I would use documentation, lineage, source evidence, or the data owner to test the assumption. I would not automatically deduplicate the data. If the records violate a confirmed uniqueness rule, I would flag or quarantine them with the failure reason, assess their downstream impact, preserve an audit trail, and route the issue to the appropriate owner.

How would your profiling approach change if the dataset were too large to examine interactively in full?

I would keep the same validation goals but stage the checks by cost and risk. I would first inspect schema and metadata and run scalable aggregates for row counts, nulls, ranges, dates, and other inexpensive summaries. Sampling could help me explore distributions and discover possible rules quickly, but I would label sample-based conclusions as incomplete because rare defects may be missed. For important checks such as required-field completeness, key uniqueness, referential integrity, critical validity rules, and reconciliation totals, I would use scalable queries or distributed processing across the full relevant population when feasible. I would prioritize checks according to downstream decision risk and explicitly document anything that could not be fully validated.

28. How would you decide what to do with missing observations?Data Quality And ValidationMedium

Question Details

Consider the extent and causes of missing observations and the consequences of deletion or imputation.

Short Interview Answer (30-60 seconds)

I would first measure where and how much data is missing, then investigate why it is missing. I would not automatically delete or impute observations. I would consider the row grain, the importance of the affected fields, whether missingness is concentrated in certain groups or periods, and how each treatment could bias the analysis. Depending on the cause and impact, I might keep the missing value as meaningful, exclude affected observations, use a justified imputation method, or recover the value from the source. I would compare reasonable treatments, validate row counts and key totals, and document the final rule and its limitations.

Detailed Explanation

Missing observations are not all the same. A blank value can mean that information was never collected, was not applicable, was lost during processing, or is genuinely unknown. My job is to understand the extent and likely cause before changing anything. I would measure missingness by important field, group, and time period, check the data lineage, and assess whether deleting or filling values could change the analysis. I would then choose the least misleading treatment, validate its impact, and document the rule so the result remains auditable and reproducible.

Useful Questions to Ask the Interviewer
  1. Which fields are missing, and which of them are required for the decision or metric?
  2. What is the row grain, and what does one observation represent?
  3. Do we know whether the missing values originate in the source system or appear after a transformation?
  4. Are missing observations concentrated in particular groups, categories, or time periods?
  5. Does a null ever have a business meaning such as not applicable or not yet available?
  6. Is there an authoritative source from which the missing values can be recovered?
  7. What downstream reports, analyses, or decisions depend on these fields?
  8. Are there existing data-quality rules or approved imputation policies that must be followed?
How to Explain It in an Interview

I would use a structured validation plan rather than immediately choosing deletion or imputation.

First, I would define the population and row grain. I need to know what one observation represents, which fields are required, and what population the analysis is meant to describe. A missing value in an optional descriptive field may have little impact, while a missing value in a key measure, identifier, date, or grouping field can materially change the result.

Next, I would profile the missingness. I would calculate the count and proportion of nulls for relevant fields and compare missingness across meaningful groups and time periods when those dimensions exist. I would also check related quality signals such as duplicates, invalid ranges, unexpected categories, or schema changes when relevant. This helps distinguish an isolated completeness issue from a wider source or pipeline problem.

Then I would investigate the cause. I would trace the field through its data lineage to determine whether the value is already missing in the source system or became missing during joins, filters, type conversions, aggregations, or other transformations. I would check row counts before and after relevant transformations and reconcile important control totals to the source when appropriate. If a processing defect introduced the missing values, the preferred action is to correct that defect rather than impute its output.

I would also determine what the missing value means. A null can represent unknown, unavailable, not applicable, delayed, or erroneous data. Those meanings should not be treated as interchangeable. When missingness itself has a valid business meaning, retaining the null or using a clearly defined missing category or indicator can be more accurate than inventing a replacement value.

For analytical missingness, I would consider whether observations appear to be missing independently of relevant characteristics, related to information we can observe, or potentially related to information we cannot observe. These ideas are often described as missing completely at random, missing at random conditional on observed information, and missing not at random. I would treat these as assumptions to investigate, not conclusions that can always be proven from the available data. The mechanism matters because deletion and imputation can produce biased results when their assumptions do not fit the data-generating process.

After understanding the likely cause, I would evaluate the treatment options. Deleting observations can be reasonable when the exclusion rule is justified and the loss does not materially distort the target population. However, deletion reduces the available data and may disproportionately remove a particular group. I would therefore compare retained and removed observations on relevant known characteristics when possible and record the row-count impact.

Imputation can be useful when the analysis requires a complete value and there is a defensible method for estimating it. A simple statistic such as a median can be understandable and stable for some numeric variables, but it can reduce natural variation and weaken relationships among variables. Group-based or model-based methods can use more information but require stronger assumptions and additional validation. I would never present an imputed value as if it were directly observed, and I would preserve an indicator or audit field identifying imputed values when that distinction matters downstream.

Another option is recovery from the source. If an authoritative source system or upstream owner can provide the actual value, that is generally preferable to estimating it. If a record is invalid and cannot safely be used, I would quarantine it with a documented reason rather than silently deleting or overwriting it.

The main quality risk is bias. The important question is not only how many values are missing, but whether missingness is related to characteristics that affect the analysis. If incomplete observations differ systematically from complete observations, complete-case deletion or naive imputation can alter estimates, comparisons, distributions, or decisions. Because the true missing values are unknown, some uncertainty may remain even after careful treatment.

I would therefore perform sensitivity analysis when the treatment could affect the conclusion. For example, I could compare a complete-case result with results from one or more justified imputation approaches or other defensible assumptions. I would not claim that one scenario reveals the true missing values. Instead, I would use the comparison to determine whether the decision is stable or highly dependent on the missing-data treatment.

Finally, I would validate and document the result. I would check row counts before and after treatment, verify that no unintended records changed, reconcile relevant totals where appropriate, and confirm that the treatment does not violate keys or other quality rules. I would record the cause of the missingness, the chosen rule, assumptions, affected fields, limitations, and ownership. If recurring missingness indicates an upstream problem, I would add a prevention rule, exception report, or alert so the issue can be detected before it reaches future reports.

My conclusion would be proportional to the evidence: preserve legitimate missingness when it has meaning, repair source or transformation defects when possible, delete only after assessing the effect on the population, and impute only when the method and assumptions are defensible. The final treatment should minimize misleading bias while remaining transparent, reproducible, and auditable.

Technical Approach
  1. Define the analysis population, row grain, required fields, and source of truth.
  2. Profile missing observations by field and measure their count and proportion.
  3. Check whether missingness is concentrated by meaningful groups, categories, or time periods.
  4. Review related quality signals such as duplicates, ranges, unexpected categories, and schema changes when relevant.
  5. Trace data lineage to determine whether missingness exists in the source or is introduced during transformation.
  6. Check row counts and reconcile relevant control totals around transformations that may have introduced nulls.
  7. Determine the meaning of each important missing value: unknown, unavailable, not applicable, delayed, or erroneous.
  8. Consider the plausible missingness mechanism and state the assumptions rather than treating it as proven.
  9. Assess how deletion would change the target population and whether excluded observations differ systematically from retained observations.
  10. Assess whether imputation is necessary and whether a defensible method exists for the field and use case.
  11. Prefer recovery from an authoritative source when the actual value can be obtained.
  12. If invalid records cannot safely be used, quarantine them with a reason instead of silently altering them.
  13. Compare reasonable treatments with sensitivity analysis when the conclusion may depend on the missing-data assumption.
  14. Validate row counts, relevant totals, keys, and downstream outputs after treatment.
  15. Record assumptions, treatment rules, limitations, affected records, and ownership in the audit trail.
  16. Add preventive quality checks or alerts if the missingness is caused by a recurring upstream or transformation problem.
Practical Insights

The main cost is usually investigation and validation rather than computation. Profiling nulls is relatively simple, while tracing lineage, comparing affected groups, recovering source values, or testing several imputation methods can require more analyst and engineering effort. Deletion is easy to perform but can discard information and introduce bias. Simple imputation is fast and explainable but can distort distributions and relationships. More advanced imputation can preserve more information but adds assumptions, validation work, and maintenance. The method should be only as complex as the decision risk requires.

Why Interviewers Ask This

The interviewer wants to see whether I treat missing observations as a data-quality and analytical judgment problem rather than automatically deleting or filling them. I should assess how much data is missing, why it is missing, whether the missingness is related to the outcome or important groups, and how deletion or imputation could change the conclusion. They also want evidence that I validate and document the decision instead of silently modifying the data.

Common interview mistakes

Common mistakes are automatically dropping every row with a null, filling every missing numeric value with zero or a simple average, assuming every blank has the same meaning, ignoring whether missingness is concentrated in certain groups or periods, treating source or transformation defects as an imputation problem, failing to measure the population lost through deletion, assuming a missingness mechanism without evidence, presenting imputed values as observed facts, and failing to document the treatment and its effect on the analysis.

Interview tip

Explain the decision in this order: measure the missingness, investigate its cause and meaning, assess the risk of bias, choose the least misleading treatment, test sensitivity when needed, validate the result, and document the rule. Emphasize that deletion and imputation are decisions to justify, not automatic cleanup steps.

Interviewer may ask next
How would you validate whether deleting observations with missing values is safe?

I would first quantify how many observations would be removed and confirm the affected row grain and target population. Then I would compare retained and removed observations using other known fields relevant to the analysis, looking for concentration by group or time period. If the removed observations differ systematically, deletion could bias the result. I would also compare important outputs before and after deletion where a valid comparison is possible, record the row-count change, and run sensitivity analysis if the conclusion could depend on the exclusion. I would use deletion only when its assumptions and impact are acceptable and documented.

What would you do if different reasonable imputation methods produced materially different conclusions?

I would treat that disagreement as evidence that the result is sensitive to the missing-data assumptions. I would not choose the method that produces the preferred answer. I would revisit the likely cause and mechanism of missingness, check whether actual values can be recovered from the source, and determine which method has the strongest defensible assumptions for the field and decision. I would present the sensitivity clearly, explain that the conclusion is uncertain, and avoid a stronger recommendation than the evidence supports. If the decision risk is high, I may recommend obtaining better data before relying on the result.

29. How would you identify and resolve duplicate records?Data Quality And ValidationMedium

Question Details

Distinguish exact duplicate records from near-duplicates and explain how you would choose the record to retain.

Short Interview Answer (30-60 seconds)

I would first define what one valid row represents and which fields should uniquely identify it. Then I would separate exact duplicates from near-duplicates. Exact duplicates can usually be confirmed with deterministic rules, while near-duplicates need stronger business evidence because some fields may differ. I would choose the record to retain using an auditable rule such as an authoritative source, trusted identifier, valid required fields, completeness, source priority, or documented update order. I would quarantine uncertain cases instead of deleting them automatically, then reconcile row counts and important control totals before and after the change and document the rule so the issue can be prevented.

Detailed Explanation

Duplicate resolution starts by deciding what one row is supposed to represent. Two rows are duplicates only if they represent the same real record at the expected grain, not simply because one or more values happen to match. I would first identify exact duplicates, then investigate possible near-duplicates using meaningful identifiers and comparable fields. Before changing anything, I would define which source and fields are authoritative and create a repeatable retention rule. Ambiguous cases should be reviewed or quarantined instead of silently removed. Finally, I would validate row counts and important control totals and preserve an audit trail.

Useful Questions to Ask the Interviewer
  1. What is the intended grain of the dataset, and which field or combination of fields should uniquely identify one record?
  2. Is there a trusted source system or authoritative identifier that should take priority when records disagree?
  3. Which differences are acceptable when deciding that two records represent the same entity or event?
  4. Are there established business rules for choosing the record to retain, such as validity, completeness, source priority, or update order?
  5. Should uncertain near-duplicates be automatically resolved, manually reviewed, or quarantined?
  6. Which row counts, control totals, or downstream outputs must be reconciled after deduplication?
How to Explain It in an Interview

I would treat duplicates mainly as a uniqueness and accuracy problem. Uniqueness means that a business record should not appear more times than the defined grain allows. Accuracy matters because removing the wrong row can be just as harmful as leaving a true duplicate.

First, I would define the population and row grain. I need to know exactly what one row represents and which field or combination of fields should distinguish one valid record. I would not assume that every repeated value is an error. The same customer, product, account, date, or other value may legitimately appear many times when the dataset is at a more detailed grain.

Next, I would profile the data for duplicate patterns. I would separate exact duplicates from near-duplicates. An exact duplicate is a set of rows that represents the same business record and has identical values across the fields relevant to that record. A near-duplicate is a set of records that may represent the same underlying entity or event but contains differences such as formatting variations, missing values, conflicting attributes, or different update states. Near-duplicates require stronger evidence and should not be merged simply because they look similar.

For exact duplicates, I would group records using the expected key or relevant identifying fields and count occurrences. I would then inspect whether the repetition originates in the source system or was introduced during a transformation such as a join, append, repeated ingestion, retry, or other pipeline step. Reviewing data lineage helps identify where the duplicate first appeared. Fixing only the final dataset without finding the cause can allow the same defect to return.

For near-duplicates, I would define matching rules using only fields that are meaningful for business identity. Where justified, I might normalize comparison values, such as consistent case or formatting, while preserving the original values for auditability. I would treat nulls carefully because two missing values do not establish that two records represent the same entity. If available evidence is not strong enough, I would place the records in an exception process rather than force a merge.

The retention rule must be explicit and deterministic. I would first prefer an authoritative source or trusted unique identifier when one exists. If several records are candidates, the documented rule might consider valid required fields, completeness, source priority, or trusted update ordering. I would not simply keep the first row returned by a query because physical or query ordering does not establish business truth. Conflicting values and ties should have a defined review or escalation path.

I would also avoid silently deleting or overwriting records. Where appropriate, I would preserve the duplicate group, the retained record, records that were excluded or quarantined, the reason for the decision, and the rule used. That creates an audit trail and makes the process explainable and recoverable.

Validation comes after the proposed resolution. I would compare row counts before and after deduplication and confirm that the reduction is explained by the resolved duplicate groups. I would also reconcile important control totals against the source system or another trusted baseline when those totals are expected to remain unchanged. If deduplication changes a control total unexpectedly, I would investigate before publishing the result. I would also rerun relevant key, null, referential-integrity, and downstream validation checks because removing or merging records can affect relationships elsewhere.

I would assess downstream impact as well. Duplicate records can overstate counts, amounts, rates, or other measures, while incorrect deduplication can understate them. Therefore, the strength of the action should match the evidence. Exact duplicates with a clear business rule may support automatic resolution, while uncertain near-duplicates may require additional source evidence or manual review.

Finally, I would prevent recurrence. I would document the expected grain and uniqueness rule, add a repeatable duplicate quality check, define ownership for exceptions, and correct the source or transformation defect that created the duplicates when possible. I would also add regression checks and safe-failure behavior so future source, schema, or pipeline changes cannot silently reintroduce the same problem.

Technical Approach
  1. Define the expected population, row grain, and field or field combination that should uniquely identify one valid record.
  2. Identify authoritative sources, identifiers, and business rules before modifying any data.
  3. Profile duplicate counts and separate exact duplicate groups from possible near-duplicate groups.
  4. Trace the duplicate through data lineage to determine whether it originates in the source or a transformation.
  5. For exact duplicates, confirm that the repeated rows truly represent the same business record rather than valid repetition at the defined grain.
  6. For near-duplicates, normalize only justified comparison fields and apply documented matching criteria while treating nulls and conflicting values carefully.
  7. Define a deterministic retention rule based on authoritative identity, validity, completeness, source priority, or documented update ordering.
  8. Quarantine or manually review ambiguous groups rather than automatically merging or deleting them.
  9. Preserve an audit trail of duplicate groups, retained records, excluded or quarantined records, and resolution reasons where appropriate.
  10. Validate the result using row-count reconciliation, relevant control totals, key checks, referential-integrity checks, and downstream validation.
  11. Correct the source or transformation cause and add recurring quality rules, exception ownership, alerts, regression checks, and recovery evidence.
Practical Insights

Exact duplicate detection is usually relatively straightforward because records can be grouped by the expected key or other relevant fields. Near-duplicate detection can require much more work because more fields or candidate record pairs may need comparison, and uncertain cases may require review. Broader matching rules may find more true duplicates but can also create more false matches. Narrower rules are faster and safer to automate but may miss real near-duplicates. The right balance depends on data volume, available identifying evidence, explainability, and the business cost of either retaining a duplicate or deleting a valid record.

Why Interviewers Ask This

Interviewers want to see whether I can define the correct row grain, distinguish exact duplicates from near-duplicates, choose a defensible record to retain, avoid deleting valid data, trace the cause of duplication, and verify that deduplication does not incorrectly change trusted downstream results.

Common interview mistakes

Common mistakes include treating every repeated value as a duplicate without defining the row grain, using an incorrect duplicate key, assuming matching nulls prove identity, merging near-duplicates using weak similarity alone, keeping an arbitrary first row, silently deleting records without preserving evidence, ignoring conflicting values inside a duplicate group, failing to determine whether the source or a transformation created the issue, and skipping row-count or control-total reconciliation after cleanup.

Interview tip

Start with the row grain, then clearly separate exact duplicates from near-duplicates. Emphasize that the retention rule must be deterministic and auditable, uncertain records should not be silently deleted, and the cleaned result must be reconciled and validated before it reaches decision makers.

Interviewer may ask next
What would you do if two records appear to represent the same entity but their key attributes conflict?

I would not merge them automatically. I would first check the expected grain, authoritative identifiers, source priority, data lineage, and any trusted update metadata. I would determine whether the conflicting values can be resolved from an authoritative source or documented business rule. If the evidence is insufficient, I would quarantine the records as an exception and preserve both originals for review. Any final resolution should record which record or value was retained, why it was selected, and how the decision was validated.

How would your approach change if the dataset were very large and near-duplicate matching were too expensive to run across every possible pair?

I would reduce the comparison space before applying expensive matching. I would use defensible blocking or candidate-generation rules based on stable, relevant fields so that only plausible record pairs are compared. I would keep exact duplicate detection separate because it is usually cheaper. I would validate the blocking rules against reviewed examples or known cases to understand missed matches and false candidates, and I would route uncertain groups to an exception process. The tradeoff is that stricter blocking improves speed but can miss true near-duplicates, so the rule should reflect the business risk and available evidence.

30. How would you detect outliers and decide whether to retain, correct, or remove them?Data Quality And ValidationMedium

Question Details

Discuss detecting outliers with IQR or z-scores and distinguishing valid extreme observations from data errors before treatment.

Short Interview Answer (30-60 seconds)

I would first understand the field, row grain, units, source, and expected business range, then profile the data for nulls, duplicates, ranges, and unusual categories. I would flag candidate outliers using the IQR rule, or z-scores when an approximately normal distribution makes that appropriate. I would never delete a value just because it crosses a statistical threshold. I would trace it to the source and lineage, check business plausibility and collection logic, and assess downstream impact. Valid extreme observations stay. Verified, fixable errors are corrected using a trusted source or auditable rule. Invalid or objectively unrepresentative records are removed from analysis or quarantined only with documented justification. Finally, I would record the action, monitor the issue, and improve data-quality controls to prevent recurrence.

Detailed Explanation

An outlier is an observation that looks unusually far from most other values, but unusual does not automatically mean wrong. I would first understand the data's row grain, units, source, expected range, and business meaning. Then I would use statistical rules such as IQR or z-scores to identify records worth investigating. For every flagged record, I would check the source system, data lineage, data-entry logic, collection process, and business context before changing anything. The final decision should be to retain, correct, remove from analysis, or quarantine the record, with evidence, documented impact, and an audit trail.

Useful Questions to Ask the Interviewer
  1. What does one row represent, and which field or measure are we evaluating for outliers?
  2. What are the expected units, valid ranges, and known business events that could create legitimate extreme values?
  3. Is the distribution approximately normal, skewed, seasonal, or divided into groups with different behavior?
  4. Can I compare flagged records with the source system or another trusted source?
  5. What downstream reports, metrics, models, or decisions depend on this field?
  6. Are there existing rules for correcting, quarantining, or excluding invalid records?
How would you detect outliers and decide whether to retain, correct, or remove them? diagram
How to Explain It in an Interview

I would describe the process as a validation workflow, not a rule for automatically deleting outliers.

First, I would understand and profile the source data. I would confirm the row grain so I know what one observation represents, verify units and field definitions, and identify the source of truth. I would also profile nulls, duplicates, ranges, unexpected categories, and relevant schema changes. This matters because an apparently extreme value can be caused by a wrong unit, duplicate record, misplaced decimal, unexpected transformation, or changed source format rather than a real extreme event.

Second, I would detect candidate outliers. A common robust screening method is the interquartile-range rule. I calculate IQR = Q3 - Q1 and flag observations below Q1 - 1.5 × IQR or above Q3 + 1.5 × IQR. These observations are candidates for investigation; crossing the fence does not prove that a record is incorrect. The IQR rule is useful when I do not want to assume the data follows a normal distribution.

If an approximately normal model is reasonable, I may also calculate a z-score using z = (x - mean) / standard deviation. A common screening convention is to investigate observations where the absolute z-score is greater than 3. I would be cautious with z-scores when the distribution is strongly skewed or heavy-tailed because the mean and standard deviation can be influenced by extreme values. I would also avoid applying one global threshold across groups that naturally have different distributions.

Third, I would investigate each important flagged record. I would trace it through data lineage to the source system and determine whether the unusual value existed at the source or was introduced during collection or transformation. I would check for data-entry problems such as typos, wrong units, formatting issues, or misplaced decimals. I would also inspect collection and processing logic, related records, and business or domain plausibility. A promotion, seasonal event, operational incident, market change, or another genuine event can create a valid extreme observation.

Next, I would assess downstream impact. I would check whether the flagged record materially changes averages, totals, trends, reports, models, or business decisions. If a legitimate extreme value has high influence, I would normally keep it and, when useful, perform a sensitivity analysis showing how conclusions change with and without that observation. That preserves valid information while making its influence visible.

The treatment follows the investigation. I retain the record when it is plausible, correctly recorded, and represents a real event. I document the reasoning. I correct the record only when there is evidence of a fixable data error and a trusted source or consistent auditable rule for the correction. When possible, I keep both the original and corrected values in the audit trail rather than silently overwriting history. I remove a record from analysis or quarantine it only when it is invalid, irrecoverable, or objectively inappropriate for the defined analytical population, and I document the reason and downstream impact. Statistical unusualness alone is never sufficient justification for removal.

After treatment, I validate the result. I compare row counts before and after filtering, correction, or quarantine where relevant, check important totals or control totals against the source system, and confirm that the intended row grain has not changed unexpectedly. I record the action, reason, date, assumptions, known limits, and owner so another analyst can reproduce the decision.

Finally, I close the feedback loop. If the outlier came from a recurring quality problem, I would add an appropriate range check, schema check, validation rule, exception report, or alert. I would monitor the number of affected records and the impact on key metrics. The main principle is simple: statistical methods identify unusual observations, while source evidence, lineage, business context, and downstream impact determine whether those observations should be retained, corrected, removed, or quarantined.

Technical Approach
  1. Define the population, row grain, field, units, source of truth, expected range, and relevant business context.
  2. Profile the data for nulls, duplicates, ranges, unexpected categories, distribution shape, and schema changes that could create false outliers.
  3. Flag candidate outliers with IQR: calculate IQR = Q3 - Q1 and investigate values below Q1 - 1.5 × IQR or above Q3 + 1.5 × IQR.
  4. When an approximately normal model is reasonable, optionally calculate z = (x - mean) / standard deviation and use a threshold such as |z| > 3 as a screening rule.
  5. Treat every statistical flag as an investigation trigger, not automatic evidence of bad data.
  6. Trace flagged records to the source system and through data lineage; check data entry, units, transformations, collection logic, related records, and business plausibility.
  7. Assess each important outlier's effect on downstream analysis, reports, metrics, and decisions; use sensitivity analysis when a valid extreme observation has high influence.
  8. Retain valid extreme observations and document why they are valid.
  9. Correct verified, fixable errors only from a trusted source or consistent auditable rule, keeping the original and corrected values when possible.
  10. Remove from analysis or quarantine invalid or objectively inappropriate records only with clear justification, a documented reason, and recorded downstream impact.
  11. Recheck row counts and relevant control totals after treatment and confirm that the intended grain and outputs remain consistent.
  12. Record the action, reason, date, assumptions, and owner in an audit trail.
  13. Add monitoring, alerts, validation rules, range checks, schema checks, or other prevention controls when the problem could recur.
Practical Insights

The statistical calculations are usually inexpensive compared with investigating the flagged records. For one field with n rows, z-scores can be calculated in linear time once the mean and standard deviation are available. Exact quartiles often require sorting or a quantile operation, which can cost more on very large datasets. The larger practical effort is validating records against source systems, lineage, business context, and downstream reports. There is also an important tradeoff: aggressive removal can discard real information and bias the analysis, while overly permissive retention can allow true data errors to distort results.

Why Interviewers Ask This

Interviewers want to see whether I can separate statistical detection from business judgment. A strong analyst should understand that an outlier flag is a signal to investigate, not proof that the record is bad. They are testing whether I can choose an appropriate detection method, validate suspicious values against the source and lineage, distinguish valid extreme observations from data errors, assess downstream impact, and make an auditable decision to retain, correct, remove, or quarantine a record without silently changing the data.

Common interview mistakes

Common mistakes are deleting every observation outside an IQR or z-score threshold; treating a statistical flag as proof of bad data; using z-scores without considering a skewed or heavy-tailed distribution; applying one global threshold to groups with different normal behavior; ignoring row grain, units, duplicates, or schema changes; treating a valid business event as an error; correcting a value without a trusted source; silently overwriting or dropping records; failing to trace whether the problem originated in the source or a transformation; ignoring downstream impact; and failing to document the reason, assumptions, owner, and audit trail.

Interview tip

State early that an outlier flag is a signal to investigate, not permission to delete. Then use one clean flow: understand and profile the data, detect candidates with IQR or z-scores, investigate the source and business context, choose retain, correct, remove, or quarantine, validate the downstream impact, document the action, and prevent recurrence. That demonstrates both statistical knowledge and responsible data-quality judgment.

Interviewer may ask next
What would you do if IQR flags many values but the distribution is strongly skewed?

I would first check whether the flagged values are actually inconsistent with the business process rather than assuming they are bad data. IQR does not require normality, but the standard 1.5 × IQR fence is still a screening convention and can identify many legitimate values in a strongly skewed distribution. I would examine meaningful segments, consider whether another robust rule or transformation better matches the data, and use defensible domain limits when available. I would validate the chosen rule against known valid and invalid cases and document its limitations rather than automatically removing every flagged record.

What if a valid extreme observation changes the reported average dramatically?

I would normally retain it if the source, lineage, and business context confirm that it is a real observation. Removing a correct record simply because it changes the result can introduce bias. I would measure its influence and communicate it transparently. Depending on the analytical goal, I might report a robust statistic such as the median alongside the mean or provide a sensitivity analysis with and without the extreme observation. If a defined business rule requires exclusion, I would treat that as a separate population rule, document it, and reconcile the resulting row counts and totals so the decision remains auditable.

More questions load as you scroll

Disclaimer: This interview guide is for educational and informational purposes only. It is designed to help readers prepare, but it does not guarantee any interview result, hiring decision, offer, or outcome. Interview questions, hiring criteria, and preferred answers can vary by employer, interviewer, industry, location, and time. All answers, examples, and explanations in this guide are suggested examples for interview preparation, not definitive answers or instructions for professional practice. They are based on research and judgment, are provided without warranties of any kind, and should be adapted to the question, role, and applicable laws and professional requirements. Diagrams are simplified illustrations intended to highlight the main concepts and their relationships; actual situations, systems, and practices may be more complex. Alternative approaches may be equally valid or better suited to a particular question, context, or interviewer. To the fullest extent permitted by applicable law, the contributors and publisher are not liable for decisions made, actions taken, or losses incurred based on this guide.

State Laws and Professional Responsibilities: Laws and requirements governing an occupation vary by state and jurisdiction. You are responsible for checking the current laws, licensing requirements, and scope-of-practice rules that apply to your location and role, and for ensuring that your answers and actions comply with them. Adapt examples in this guide to those requirements. This guide is not legal advice.

Content Accuracy and Verification: To the fullest extent permitted by applicable law, we do not represent or warrant that interview guides, questions, answers, examples, or diagrams are accurate, complete, current, error-free, or suitable for any particular purpose. You are responsible for independently reviewing and verifying the information before relying on it.