189 DevOps Engineer Interview Questions & Answers

105 top • 14 Amazon • 12 Apple • 15 Google • 9 Meta • 14 Microsoft • 8 Netflix • 12 NVIDIA

DevOps Engineer icon

Questions with Detailed ExplanationsWith Detailed Explanations

(Last Updated: September 1, 2026)

41. How would you refactor Terraform resource addresses without recreating infrastructure?Infrastructure As CodeHard

Question Details

A monolithic root configuration is being split into modules and several resource addresses will change. Plan the use of declarative moved mappings or controlled state moves, review the generated plan, handle for_each keys, coordinate with remote locking, and verify that no remote object is replaced.

Short Interview Answer (30-60 seconds)

I would map every old Terraform address to its new address with declarative moved blocks, keep for_each identities stable, review the plan for zero unintended add, change, destroy, or replacement actions, use remote-state locking, apply after approval, and verify that only the state addresses changed.

Detailed Explanation

See the Code while reading this explanation.

The goal is to reorganize the infrastructure code without rebuilding things that already exist. I would first list what exists today and decide where each item will live after the code is split. Then I would tell the tool that the old names and new names refer to the same existing things. Before making the change, I would inspect the proposed result and stop if anything would be removed or rebuilt. I would also prevent two people from changing the shared record at the same time and check the real environment afterward.

Useful Questions to Ask the Interviewer
  1. Is the Terraform state stored in a remote backend that supports locking?
  2. Which Terraform version is pinned in the repository, and can we use declarative moved blocks?
  3. Are any of the changing addresses resource instances created with for_each?
  4. Is this strictly an address and module refactor, or are resource arguments changing at the same time?
  5. Does the delivery workflow require human or policy review of the Terraform plan before production apply?
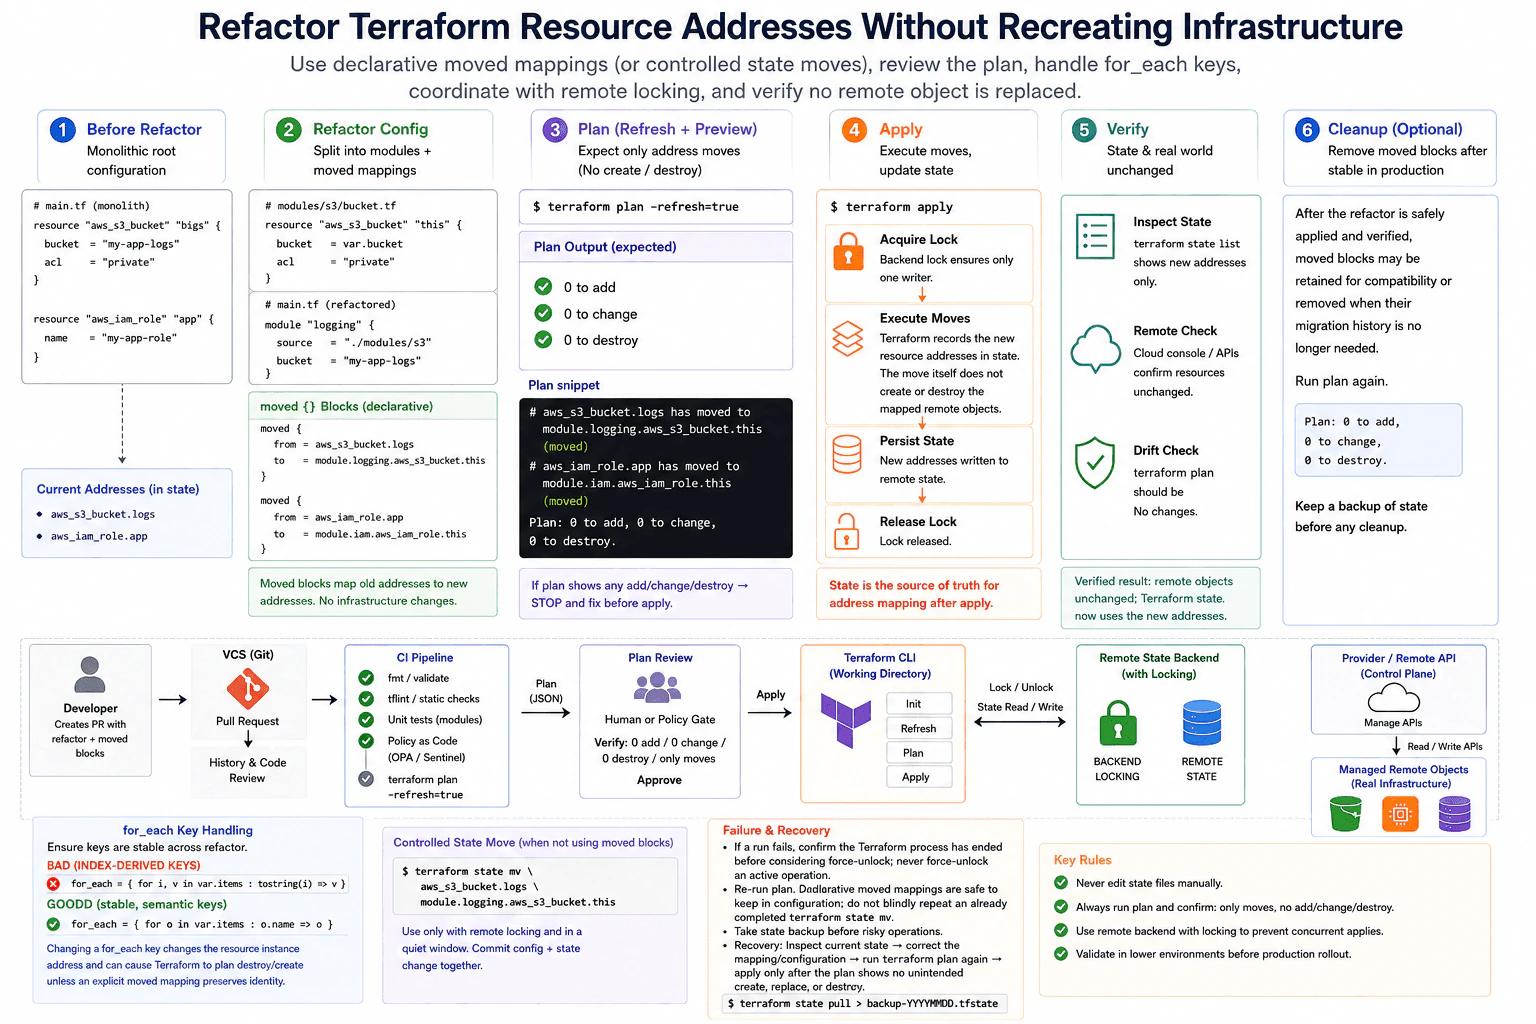
How would you refactor Terraform resource addresses without recreating infrastructure? diagram
How to Explain It in an Interview

I would treat this as a Terraform identity migration, not an infrastructure replacement. Terraform associates each managed remote object with a resource instance address stored in state. Moving a resource from a monolithic root configuration into a module changes that address, so Terraform must be told that the old and new addresses represent the same existing object.

My preferred method is a declarative moved block. For example, the diagram moves aws_s3_bucket.logs to module.logging.aws_s3_bucket.this and aws_iam_role.app to module.iam.aws_iam_role.this. A moved block records that relationship in configuration. During planning, Terraform can then correlate the object already tracked at the old address with the new address instead of treating the old address as removed and the new address as an unrelated object.

I would make the module refactor and the moved mappings in the same reviewed configuration change. Before apply, I would run the repository's normal formatting, validation, linting, module tests, and relevant policy checks. I would then generate a Terraform plan using the intended remote backend and inspect it carefully. A plan is a preview based on the configuration, stored state, and provider observations available at that time, so it is an important safety check but not a guarantee that apply cannot encounter a later provider or remote-system failure.

For a pure address refactor, the desired plan contains moved-resource annotations and no actual infrastructure modifications. The normal plan summary should show 0 to add, 0 to change, and 0 to destroy. I would not expect or invent a separate numeric 'to move' summary. If the plan proposes a create, destroy, or replacement for an object that should merely move addresses, I would stop and correct the moved mapping, module configuration, or instance-key mapping before apply.

for_each requires special care because its key is part of the resource instance address. Stable semantic keys are safer than identities derived from list positions. If an existing key changes intentionally, I would explicitly map the exact old instance address to the exact new instance address with a moved block. Without that mapping, Terraform can interpret the old key as one instance disappearing and the new key as another instance appearing, which can lead to destroy/create behavior.

For shared remote state, I would use the backend's supported locking mechanism so concurrent state-changing Terraform operations cannot write the same state at the same time. During the reviewed operation, Terraform reads the state, evaluates the moved mappings, applies any required state-address updates, persists the resulting state, and releases the lock. The move itself does not instruct the provider to create or destroy the mapped remote objects, although normal refresh and provider reads may still contact the remote API.

If declarative moved blocks are unavailable or unsuitable for the workflow, I would use terraform state mv as a controlled alternative. I would coordinate the configuration change and state move in a quiet change window, use the remote backend's locking support, capture a current state backup, execute the intended move once, and immediately generate a fresh plan. I would never manually edit the backend state file, and I would not blindly repeat a state mv if the first command may already have completed.

After apply, I would inspect terraform state list and confirm that the managed objects now appear at the intended new addresses. I would also verify through the provider or remote control plane that the same real objects still exist and were not recreated. Finally, I would run another Terraform plan. The desired post-migration result is no changes: the remote objects are unchanged and Terraform state now uses the new addresses.

If a run fails or is interrupted, I would first confirm that the Terraform process has ended before considering force-unlock; I would never force-unlock an active operation. I would inspect the current state, correct the mapping or configuration if necessary, run terraform plan again, and continue only when the plan shows no unintended create, replace, or destroy actions. I would use a forward-fix approach rather than assuming an interrupted apply automatically rolled back.

Moved blocks can remain in configuration after the migration. Keeping them can preserve useful migration history and compatibility for configurations that have not yet observed the move. Removing them is optional. I would consider cleanup only after the refactor has been safely applied and verified, and I would run another plan after any cleanup.

Technical Approach
  1. Inventory the current Terraform resource instance addresses in configuration and state.
  2. Design the new module structure and determine the exact destination address for every moved instance.
  3. Keep unrelated resource arguments unchanged during the address-only refactor where possible.
  4. Add declarative moved blocks from each old address to its new address.
  5. For for_each resources, keep stable semantic keys; if a key must change, explicitly map the exact old instance address to the exact new instance address.
  6. Run formatting, validation, linting, module tests, and relevant policy checks.
  7. Initialize against the intended remote backend and generate a refreshed Terraform plan.
  8. Review the moved annotations and require 0 to add, 0 to change, and 0 to destroy for a pure refactor; stop on any unintended create, replacement, or destroy.
  9. Apply through the approved workflow while the backend prevents concurrent state writers.
  10. Verify the new addresses with terraform state list, verify that the same remote objects remain in the provider or control plane, and run another plan expecting no changes.
  11. If declarative moved blocks are unsuitable, perform the equivalent terraform state mv operation in a controlled window with locking and a state backup, then immediately re-plan.
  12. Keep moved blocks as migration history or remove them later only after the migration is safely verified and a subsequent plan remains clean.
Practical Insights

The computing cost is normally small because this operation mainly changes Terraform's recorded addresses rather than rebuilding infrastructure. The practical cost grows with the number of resource instances because every old-to-new mapping must be correct and reviewed. for_each migrations add risk because each key is part of an instance's identity. Remote locking may make another run wait, but that waiting protects shared state from concurrent writes. The main operational and maintenance cost is careful plan review, state protection, remote-object verification, and recovery if an operation is interrupted.

Code
terraform_configuration = """# Preserve the existing bucket's Terraform identity while moving its
# configuration from the root module into the logging module.
# The state association changes; the moved block itself does not request
# creation or destruction of the mapped remote object.
moved {
  from = aws_s3_bucket.logs
  to   = module.logging.aws_s3_bucket.this
}

# Preserve the existing role while its configuration moves into a module.
# Keep unrelated resource arguments stable during an address-only refactor
# so address migration is not mixed with intentional infrastructure changes.
moved {
  from = aws_iam_role.app
  to   = module.iam.aws_iam_role.this
}

# A for_each key is part of a resource instance address. If an existing
# semantic key must be renamed, explicitly map that exact old instance to
# the exact new instance so Terraform can preserve its state identity.
moved {
  from = module.compute["old-key"].aws_instance.this
  to   = module.compute["new-key"].aws_instance.this
}

# Keep these mappings in the same reviewed configuration change as the
# refactor. Use the repository's configured remote backend and locking,
# review the Terraform plan, and apply only when it contains no unintended
# create, replace, update, or destroy actions."""
print(terraform_configuration)
Why Interviewers Ask This

This question tests whether the candidate understands that reorganizing Terraform configuration can change resource addresses even when the underlying infrastructure must remain unchanged. A strong answer demonstrates knowledge of moved blocks, Terraform state, for_each instance identity, remote state locking, plan review, safe apply boundaries, verification, controlled state moves, and failure recovery. It also tests whether the candidate can distinguish a state-address migration from a provider operation that creates, replaces, updates, or destroys a remote object.

Common interview mistakes

Common mistakes include moving HCL into modules without mapping the old addresses, assuming identical resource arguments automatically preserve Terraform identity, applying a plan that proposes unintended create/destroy or replacement actions, treating a non-standard 'to move' count as part of Terraform's normal plan summary, changing for_each keys without explicit instance mappings, deriving long-lived for_each identities from unstable list indexes, performing configuration and imperative state changes at different times, using terraform state mv while another Terraform process owns the state lock, force-unlocking an active operation, manually editing remote state, blindly repeating an already completed state move, assuming a failed apply automatically rolled back, and checking only state without verifying the real remote objects.

Interview tip

Lead with the identity rule: map every old Terraform resource instance address to its intended new address. Then explain declarative moved blocks, stable for_each keys, a reviewed 0-add/0-change/0-destroy plan, remote locking, controlled apply, and post-apply verification. Mention terraform state mv only as the controlled alternative.
Interviewer may ask next
What would you do if Terraform plans to destroy an old for_each instance and create a new one after the refactor?

I would stop before apply. A for_each key is part of the resource instance address, so I would compare the old and new keys and confirm that they represent the same remote object. If the key is intentionally being renamed, I would add an explicit moved mapping from the exact old instance address to the exact new instance address. Then I would run the plan again and require the unintended destroy/create or replacement to disappear before applying.

When would you use terraform state mv instead of a moved block, and how would you make it safe?

I prefer moved blocks because they are declarative, reviewable, and version-controlled migration history. I would use terraform state mv only when a declarative mapping is unavailable or unsuitable for the workflow. I would coordinate the configuration and state change in a quiet window, use the remote backend's locking support, take a current state backup, execute the intended move once, and immediately generate a fresh plan. If the operation is interrupted, I would inspect the current state rather than blindly repeating the command, and I would apply nothing until the plan shows no unintended create, replacement, or destroy.

42. How does observability differ from traditional monitoring?ObservabilityEasy

Question Details

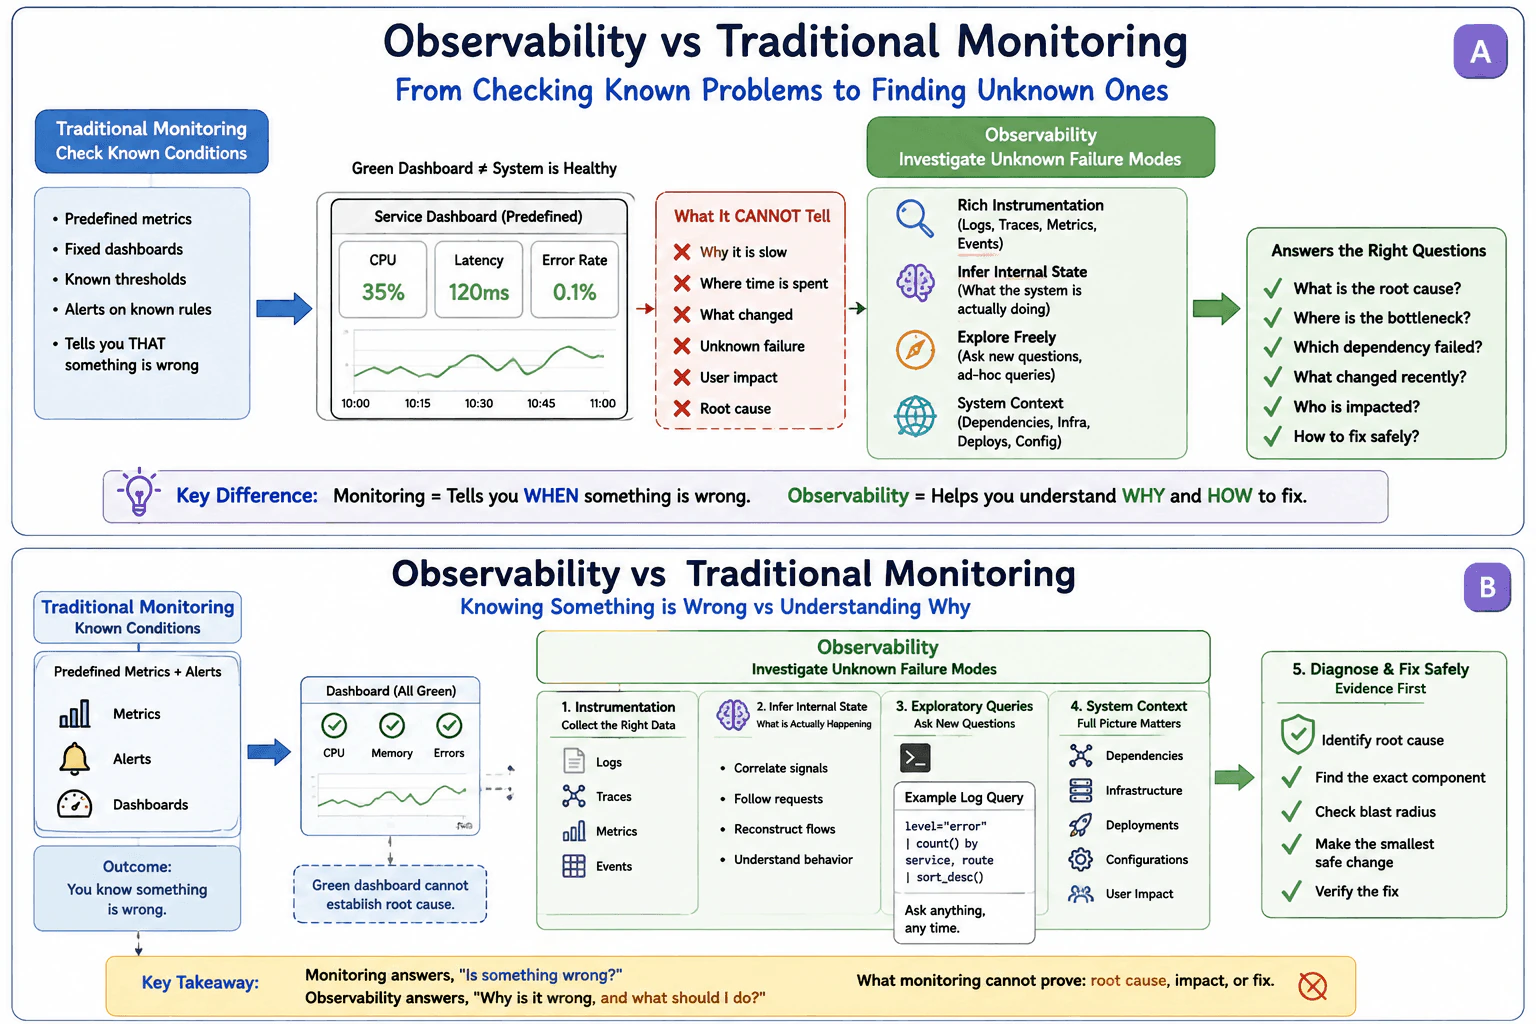
Compare checking known conditions with investigating previously unknown failure modes. Explain the roles of instrumentation, internal-state inference, exploratory queries, and system context, and identify what a green predefined dashboard cannot establish by itself.

Short Interview Answer (30-60 seconds)

Monitoring checks known conditions with predefined metrics, dashboards, thresholds, and alerts. Observability uses rich telemetry and system context to investigate unknown problems, infer internal state, and ask new questions. A green dashboard proves only that its predefined checks are green, not that the whole system is healthy.

Detailed Explanation

Traditional monitoring is like checking a small set of warning lights that you chose in advance. It can tell you when something you expected to watch has crossed a limit. The problem is that real failures are not always predictable. A screen showing everything as green only means those chosen checks look normal. It does not prove that users are having a good experience or explain why something feels slow or wrong. A broader approach gives engineers enough evidence and surrounding information to ask new questions and understand what is actually happening.

Useful Questions to Ask the Interviewer
  1. Should I focus only on the conceptual difference, or also describe the kinds of signals used during an investigation?
  2. Do you want me to explain how a team investigates a problem when all predefined dashboards are green?
  3. Should I include the operational tradeoffs of collecting richer telemetry, such as cost, retention, and data volume?
How does observability differ from traditional monitoring? diagram
How to Explain It in an Interview

Traditional monitoring checks known conditions. We decide in advance what to measure, put those measurements on dashboards, define thresholds, and create alerts. Examples include CPU usage, request latency, error rate, availability, or another predefined service indicator. This is useful because it quickly tells an operator that a known condition has changed.

Observability is broader. It is the ability to understand a system's internal state from the evidence the system exposes. That starts with instrumentation: the application and platform emit useful telemetry such as logs, traces, metrics, and events. Consistent identifiers and resource attributes can help correlate those signals across requests, services, and infrastructure.

The important difference is that observability supports exploratory investigation. Instead of being limited to questions that someone predicted while building a dashboard, an operator can ask new questions after the failure appears. For example: Which requests are slow? Where is time being spent? Which dependency is involved? What changed recently? Which users are affected? These questions help narrow the investigation without assuming the answer in advance.

System context is also important. Dependencies, infrastructure state, deployments, configuration, and user impact provide the surrounding evidence needed to interpret telemetry. Logs may describe events, traces may show request flow, metrics may show behavior over time, and events may show state changes, but no single signal should be treated as automatic proof of root cause. The evidence must be correlated.

A green predefined dashboard therefore cannot establish by itself that the entire system is healthy. It establishes only that the conditions represented by that dashboard are within their configured ranges. An unknown failure may still exist outside those checks. The dashboard alone cannot establish why a service is slow, where time is spent, what changed, which dependency is failing, the full user impact, or the root cause.

In production, I would still use monitoring as part of observability. I would begin with the user-visible objective and the smallest useful set of signals. I would define meaningful service-level indicators, or SLIs, that measure user-visible behavior, and service-level objectives, or SLOs, that define acceptable targets before choosing alert thresholds. I would prefer symptom-based, actionable alerts with clear ownership, severity, runbook context, and noise controls instead of relying only on infrastructure thresholds.

For investigation, I would collect the smallest useful set of telemetry that lets operators move from a symptom to supporting evidence. I would correlate logs, traces, metrics, and events with consistent service, environment, version, and request attributes where appropriate. I would also include deployment, dependency, infrastructure, and configuration context so a recent change can be compared with the observed behavior.

There are tradeoffs. High-cardinality attributes can make telemetry expensive to store and query. Sampling can reduce trace volume but can also hide rare failures or bias what investigators see. Aggregated metrics can hide individual outliers. Short retention can remove evidence before an investigation starts. Missing telemetry and clock skew can make correlation misleading. Logs and traces can expose credentials, tokens, personal information, or sensitive payloads, so those values should be redacted before telemetry leaves the application or collection boundary.

Finally, the observability design must be tested. I would generate controlled failure conditions or synthetic requests, confirm that the expected user-facing signals change, verify that alerts fire only when their intended conditions occur, and check that dashboards, logs, traces, events, and system context can be correlated. The goal is not to create more charts. The goal is to give operators enough trustworthy evidence to understand why something is wrong and identify the smallest safe correction supported by that evidence.

Technical Approach
  1. Start with the user-visible service objective and define meaningful SLIs and SLOs.
  2. Add monitoring for known conditions using predefined dashboards and symptom-based, actionable alerts.
  3. Instrument the system to produce the smallest useful set of logs, traces, metrics, and events.
  4. Add consistent correlation and resource attributes so evidence can be connected across services and requests.
  5. Enrich telemetry with system context such as dependencies, infrastructure, deployments, and configuration.
  6. When a problem occurs, begin with the observed symptom instead of assuming a root cause.
  7. Use exploratory queries to ask new questions, such as where time is spent, what changed, which dependency is involved, and who is affected.
  8. Correlate multiple signals and context before declaring a root cause.
  9. Make the smallest safe correction supported by the evidence.
  10. Verify the correction with user-visible signals, alerts, dashboards, and the same evidence used during diagnosis.
Practical Insights

Monitoring is usually cheaper and simpler because the team watches a limited set of known measurements and rules. Observability can require more data, storage, indexing, retention, and query capacity because logs, traces, metrics, events, and context may all be collected and correlated. High-cardinality labels can greatly increase storage and query cost. Trace sampling reduces volume but may miss rare failures. Longer retention helps investigations but costs more. More instrumentation also adds maintenance work because teams must keep attributes, dashboards, alerts, privacy controls, and collection pipelines accurate as the system changes.

Why Interviewers Ask This

Interviewers want to know whether the candidate understands that monitoring and observability are related but not identical. Monitoring is centered on predefined checks for known conditions. Observability is the ability to investigate system behavior using rich evidence and context, including questions that were not anticipated when dashboards and alerts were created. A strong answer should explain instrumentation, internal-state inference, exploratory investigation, signal correlation, system context, and the limits of a green predefined dashboard without claiming that any single telemetry signal proves root cause.

Common interview mistakes

A common mistake is saying that monitoring is old and observability replaces it. Monitoring remains useful and is normally part of a broader observability practice. Another mistake is defining observability as simply collecting logs, metrics, and traces. Collecting data is instrumentation; observability depends on being able to use that evidence and context to infer system behavior and investigate new questions. Do not claim that a green dashboard proves the service is healthy, because it only validates the conditions represented on that dashboard. Also avoid claiming that one log, metric, or trace automatically proves root cause. Other mistakes include alerting only on infrastructure thresholds, collecting unlimited high-cardinality data, ignoring sampling bias or retention limits, failing to correlate signals with consistent attributes, and sending sensitive information into telemetry.

Interview tip

Give the difference in one sentence first: monitoring checks known conditions, while observability helps investigate unknown behavior. Then explain instrumentation, internal-state inference, exploratory questions, and system context. Finish with the strongest limitation: a green predefined dashboard shows only that its predefined checks are green; it cannot establish root cause or complete system health by itself.

Interviewer may ask next
If all predefined dashboards are green but users report that the service is slow, how would observability help?

I would treat the user-visible slowdown as the starting symptom rather than assuming the dashboards prove the service is healthy. I would use exploratory queries across available traces, logs, metrics, and events to identify which requests are affected and where time is being spent. I would correlate that evidence with dependencies, infrastructure, deployments, and configuration to see whether behavior changed around the same time. I would also check the scope of user impact. A root cause would be declared only when multiple pieces of evidence support it. After making the smallest safe correction, I would verify that the user-visible symptom and related telemetry return to the expected state.

What are the main tradeoffs when adding richer observability instead of collecting as much telemetry as possible?

More telemetry can improve investigation, but it also increases ingestion, storage, indexing, retention, and query costs. High-cardinality attributes can make those costs grow quickly. Sampling reduces trace volume but can hide rare failures or introduce sampling bias. Aggregation can hide individual outliers, while short retention can remove evidence before an incident is investigated. Instrumentation also creates privacy risk if credentials, tokens, personal information, or sensitive payloads are captured. I would therefore start with signals tied to user-visible objectives, collect useful correlation and system context, apply deliberate sampling and retention policies, redact sensitive data, and regularly test that the retained evidence is sufficient for real investigations.

43. What do metrics, logs, and traces each reveal about a service?ObservabilityEasy

Question Details

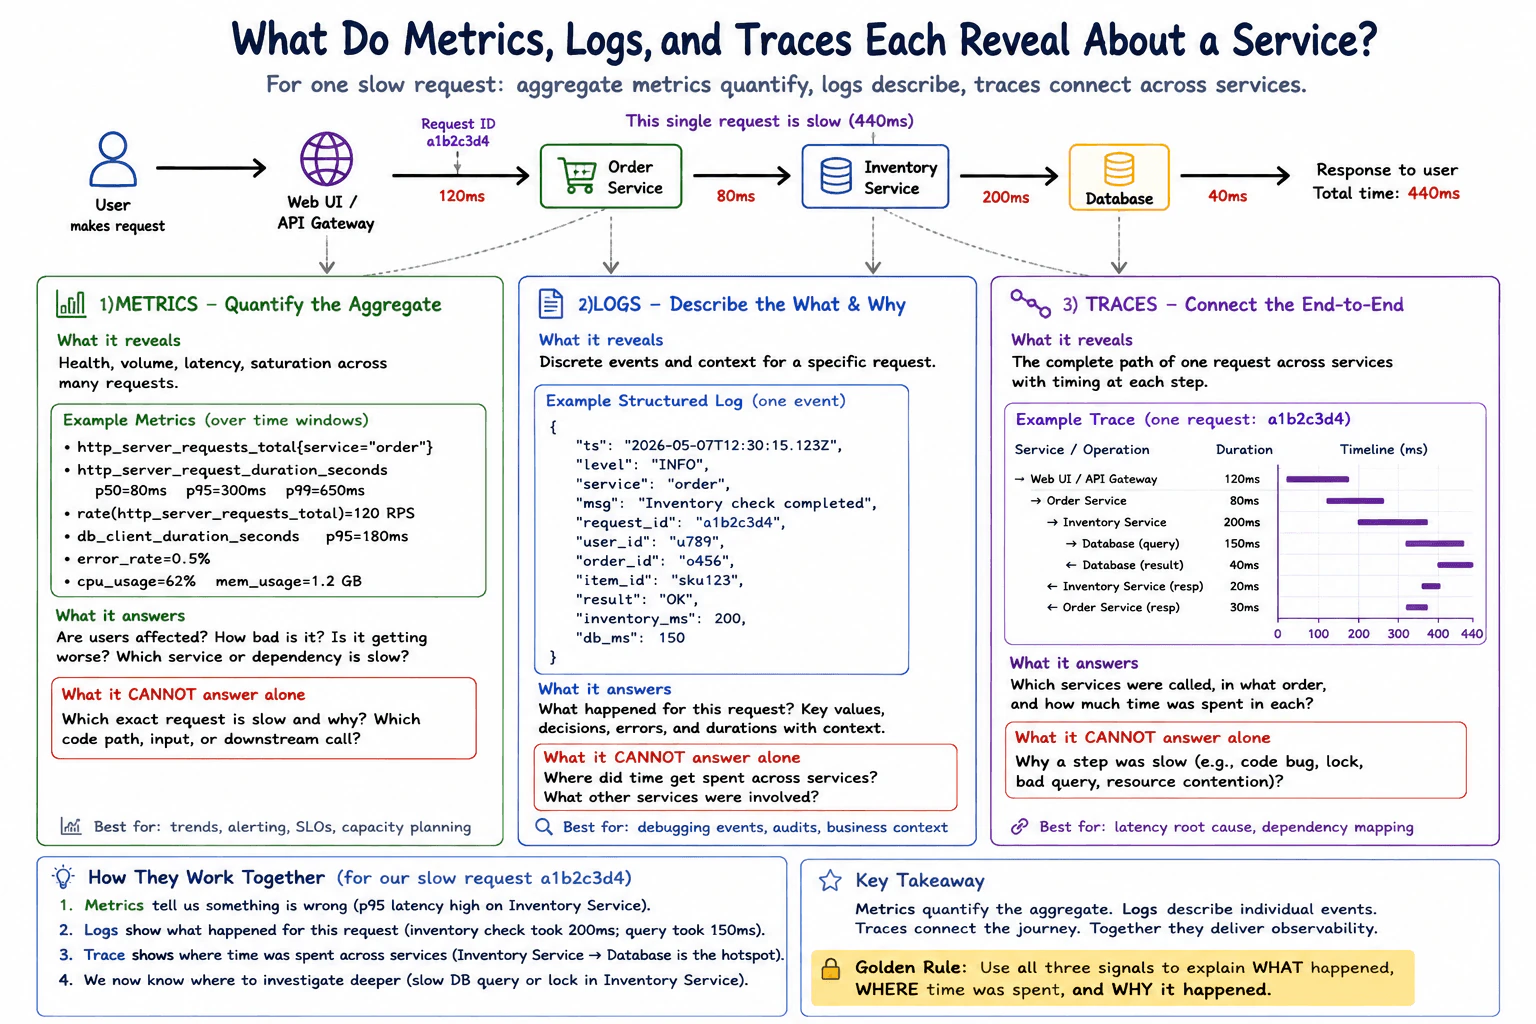
For one slow request, explain what aggregate metrics can quantify, what structured logs can describe, and what a distributed trace can connect across services. State one important question each signal cannot answer alone.

Short Interview Answer (30-60 seconds)

Metrics quantify patterns across many requests. Structured logs describe what happened during a particular request. Distributed traces connect that request across services and show where time was spent. Metrics cannot explain one exact request, logs do not naturally show the full cross-service timing path, and traces do not automatically explain why a slow span was slow.

Detailed Explanation

When one request feels slow, we need different kinds of evidence to understand it. One view tells us whether many users are affected and how serious the slowdown is. Another records important events and details for the individual request. A third follows that request through the different parts of the system and shows where its time went. None of these views gives every answer by itself. The practical lesson is to combine them: first see the overall problem, then inspect what happened, and finally connect the request's journey to decide where deeper investigation is needed.

Useful Questions to Ask the Interviewer
  1. Should I explain the three signals using one slow request across several services?
  2. Do you want only the conceptual differences, or should I also mention operational tradeoffs such as sampling and data volume?
What do metrics, logs, and traces each reveal about a service? diagram
How to Explain It in an Interview

Start with the simplest distinction: metrics quantify the aggregate, logs describe individual events, and traces connect the end-to-end request journey.

1. Metrics: quantify the aggregate

Metrics are numeric measurements collected and summarized over time. They answer questions such as: Are users affected? How bad is the slowdown? Is it getting worse? Which service or dependency shows unusual latency, errors, traffic, saturation, or resource use?

The diagram shows example measurements such as request count, request-rate calculations, latency percentiles such as p50, p95, and p99, database client latency, error rate, CPU usage, and memory usage. These values describe behavior across many requests rather than the complete story of request a1b2c3d4.

The important limitation is that metrics alone cannot reliably answer: Which exact request is slow and why? Aggregation removes most request-level details. Request IDs and other unbounded identifiers should also not be used as ordinary metric labels because they create excessive cardinality.

2. Structured logs: describe the what and why around an event

Structured logs record discrete events as named fields instead of only free-form text. Useful fields can include timestamp, severity, service name, request or correlation ID, operation details, results, durations, and safe business context. Credentials, tokens, personal data, and sensitive payloads should not be written to logs.

In the diagram, the structured-log example is associated with request ID a1b2c3d4 and records an inventory-check event with fields such as the service, result, inventory duration, and database duration. This helps answer: What happened for this request? What values, decisions, results, or errors were recorded?

The important limitation is that logs alone do not naturally answer: Where was time spent across the complete multi-service request, and which other services were involved? Correlated logs can help reconstruct a sequence, but they do not provide the explicit parent-child timing structure of a distributed trace.

3. Distributed traces: connect the end-to-end journey

A distributed trace follows one request across service boundaries. Each operation is represented by a span with timing and relationship information. In the diagram, request a1b2c3d4 travels through the Web UI/API Gateway, Order Service, Inventory Service, and Database, with an overall response time of 440 ms. The trace connects those operations and shows how much time is associated with each part of the journey.

A trace answers: Which services were called? In what order? Which downstream operations participated? Where was time concentrated? This makes traces especially useful for isolating a latency boundary in a distributed system.

The important limitation is that a trace does not automatically answer why a particular step was slow. For example, a long database span can show where time was spent, but it does not by itself prove whether the cause was a slow query, lock contention, resource pressure, or another problem. Supporting logs, metrics, database telemetry, or profiling evidence may be needed.

How they work together for the slow request
  1. Metrics show that something is wrong at the aggregate level and help determine how widespread or severe the latency problem is.
  2. Structured logs describe what happened for request a1b2c3d4, including useful request-level context.
  3. The distributed trace connects the request through the Web UI/API Gateway, Order Service, Inventory Service, and Database and shows where time was spent.
  4. The combined evidence narrows the investigation to the relevant service or dependency without claiming that one signal alone proves the root cause.

The diagram's key takeaway is: metrics quantify the aggregate, logs describe individual events, and traces connect the journey. Together, they explain what happened, where time was spent, and where to investigate next.

In production, consistent request or trace correlation and stable service attributes make these signals easier to combine. Metrics require cardinality control. Logs require privacy, retention, and volume controls. Traces can be sampled, which reduces ingestion and storage cost but may mean that some individual requests are not retained. Missing telemetry, clock differences, collection limits, retention, and cost should therefore be considered when interpreting the evidence.

Technical Approach
  1. Observe the user-visible symptom: one request is slow.
  2. Use aggregate metrics to determine scope, severity, and which service or dependency appears abnormal.
  3. Use the request or correlation ID to find structured logs describing the specific request.
  4. Inspect the distributed trace to connect the request across service boundaries and locate where time was spent.
  5. Investigate the slow boundary with supporting telemetry instead of assuming the trace proves the cause.
  6. Verify the diagnosis by checking the relevant metrics, logs, and traces together.
Practical Insights

Metrics are usually compact because many requests are summarized into numeric time series, but too many label combinations can create high cardinality and increase storage and query cost. Logs can consume substantial storage because each event may contain many fields, so volume, retention, and sensitive data must be controlled. Traces can create many spans for each request, so sampling and retention reduce cost but can hide individual requests. Maintaining all three signals also requires consistent attributes, correlation, instrumentation, retention rules, and operational maintenance.

Why Interviewers Ask This

The interviewer wants to know whether the candidate understands the different roles of metrics, structured logs, and distributed traces and can combine them during diagnosis. A strong answer separates aggregate service health from request-level event context and cross-service timing, while also recognizing the important question that each signal cannot answer alone.

Common interview mistakes

Common mistakes include saying that aggregate metrics identify the exact slow request, treating logs as a complete distributed timing model, or assuming that a long trace span proves the underlying root cause. Another mistake is putting request IDs or other unbounded values into metric labels, which creates high cardinality. Candidates may also ignore trace sampling, missing telemetry, ingestion and retention costs, clock differences, and privacy risks. A strong answer distinguishes evidence showing where a problem occurs from evidence explaining why it occurs.

Interview tip

Use one slow request as the example. Say: metrics tell me how the service is behaving at scale, logs tell me what happened for this request, and traces tell me where the request traveled and where time was spent. Then state one limitation for each signal and finish by explaining that the three signals are strongest when correlated together.

Interviewer may ask next
Why can a distributed trace show where a request is slow without proving the root cause?

A trace records spans, relationships, and timing, so it can show that a large amount of time was associated with a particular service or operation. That narrows the fault boundary, but it does not necessarily explain the reason. For example, a long database span could be caused by query execution, lock waits, resource contention, connection delays, or another issue. Logs, database telemetry, metrics, or profiles may be needed to determine why the span was slow.

What tradeoffs should you consider when collecting metrics, logs, and traces?

Metrics require careful control of label cardinality. Logs require control of event volume, retention, ingestion cost, and sensitive information. Traces can generate many spans, so sampling and retention are important; sampling can also mean that a particular request is missing. Across all three signals, operators should use consistent correlation and service attributes and consider missing telemetry, clock differences, privacy, storage cost, and retention when interpreting the data.

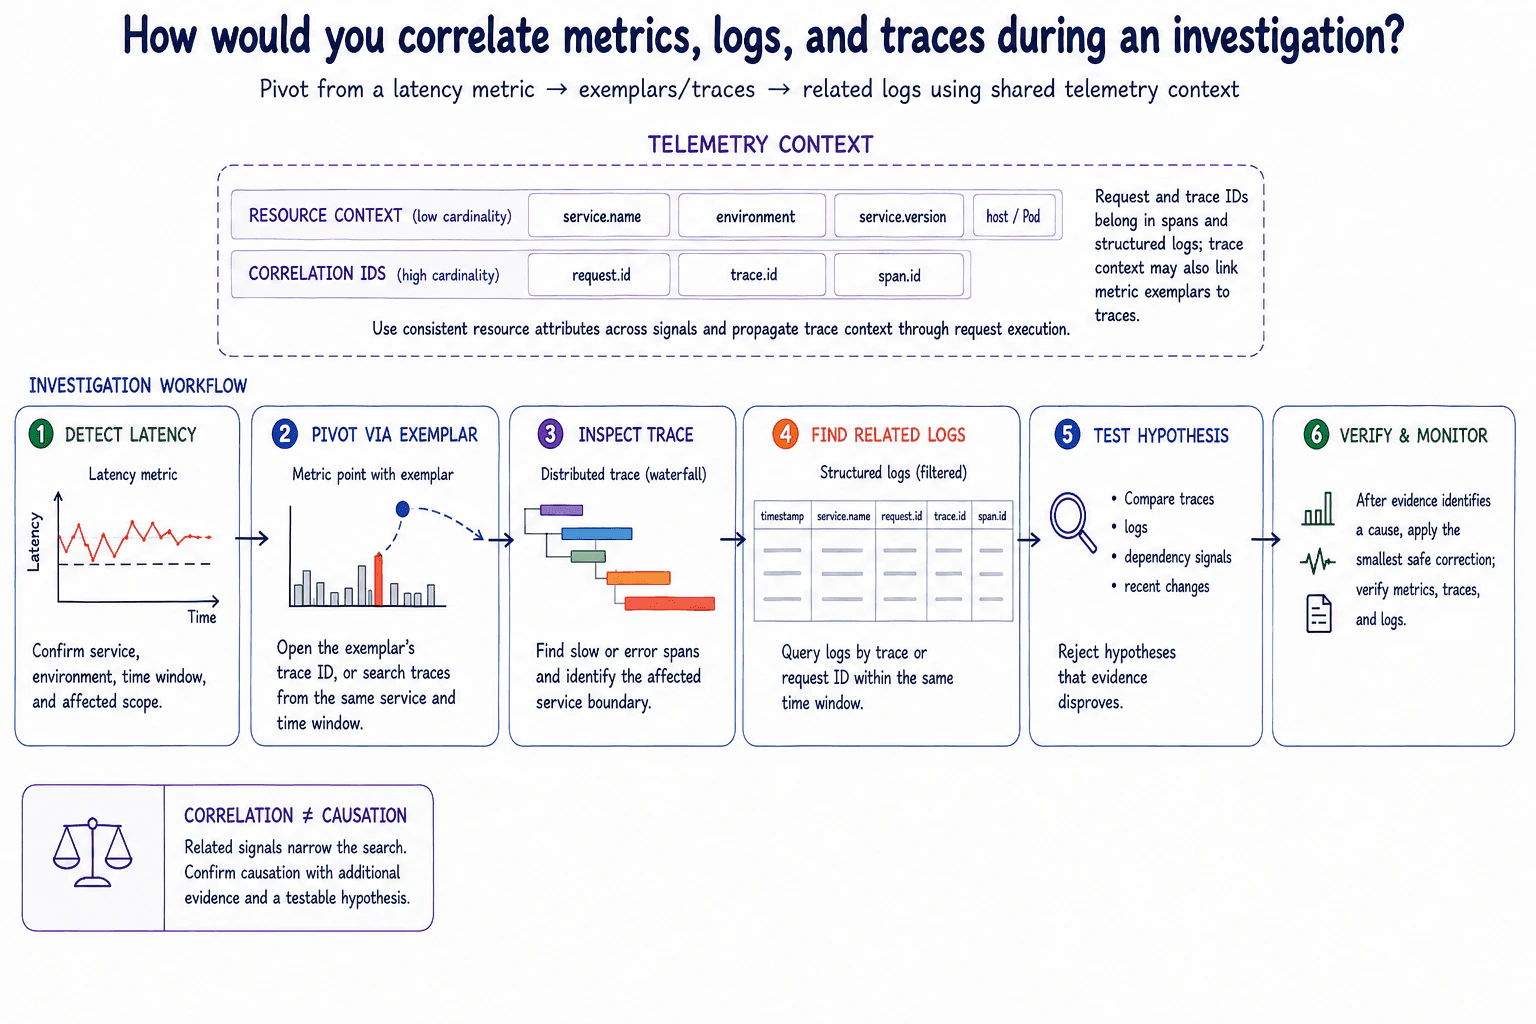
44. How would you correlate metrics, logs, and traces during an investigation?ObservabilityEasy

Question Details

Design a telemetry context that carries service, environment, version, host or Pod, request, and trace identifiers. Describe the pivot from a latency metric to exemplars or traces and then to related logs, while noting that correlation does not by itself prove causation.

Short Interview Answer (30-60 seconds)

I start from the latency metric, confirm its scope, pivot through an exemplar to a trace when possible, inspect slow or error spans, and query related structured logs by trace or request ID. I combine those signals to test hypotheses because correlation alone does not prove causation.

Detailed Explanation

This question asks how I connect different kinds of evidence when a service becomes slow or unhealthy. I first identify what users are experiencing and where it is happening. Then I move from the broad signal showing the problem to information about an affected request. I follow that request through the systems involved and examine related records from the same period. The goal is to narrow the search using evidence, test possible explanations, reject explanations that do not match the evidence, and confirm that a correction really improves the service.

Useful Questions to Ask the Interviewer
  1. Are metric exemplars available, or should I assume I may need to search traces by service and time window?
  2. Are request and trace identifiers already included in structured logs?
  3. Should I assume a single service or a distributed system with multiple service boundaries?
  4. Are there sampling, retention, ingestion-cost, privacy, or telemetry-volume constraints?
How would you correlate metrics, logs, and traces during an investigation? diagram
How to Explain It in an Interview

I would begin with the user-visible symptom and the smallest useful set of signals: a meaningful metric for the symptom, traces for request execution, and structured logs for detailed context.

First, I make telemetry context consistent. Low-cardinality resource attributes such as service.name, environment, service.version, and host or Pod describe where telemetry came from. High-cardinality correlation identifiers such as request.id, trace.id, and span.id identify individual request activity. I propagate trace context through request execution and include the useful identifiers in spans and structured logs. I do not add request, trace, or span IDs as ordinary metric labels because that can create excessive metric cardinality.

A metric exemplar is a small reference attached to a metric observation that can link that observation to a representative trace. If a latency metric becomes unhealthy, I first confirm the affected service, environment, time window, and scope. I also make sure the metric is a meaningful service-level indicator, such as request latency, rather than an unrelated infrastructure measurement.

If an exemplar is available, I use its trace ID to open the associated trace. If no exemplar exists, I search traces from the same service and time window. This fallback is less direct, and trace sampling means the exact affected request may not have been retained. A missing trace therefore does not prove that the request never occurred.

Next, I inspect the distributed trace as a waterfall. I look for slow spans, error spans, unusual gaps, and the service boundary where the problem appears. A trace tells me how a sampled request moved through the system, but a slow span alone does not prove why that operation was slow.

I then query structured logs using the trace.id or request.id within the same time window. When useful, I narrow the search further with span.id, service.name, environment, or the relevant host or Pod. Logs can add error details, application state, retry information, or other intentionally recorded context. Credentials, tokens, personal data, and sensitive payloads must be redacted rather than logged.

I combine the evidence from metrics, traces, logs, dependency signals, and recent relevant changes to form a testable hypothesis. I explicitly reject hypotheses that the evidence disproves. Signals occurring together establish correlation, but that relationship alone does not establish causation. I need supporting evidence and a test that can confirm or disprove the proposed cause.

After the evidence identifies a cause, I apply the smallest safe correction. I verify the result using the original user-visible metric and confirm that representative traces and related logs now show expected behavior. I continue monitoring long enough to detect recurrence.

The main tradeoffs are sampling, cardinality, aggregation, retention, ingestion cost, missing telemetry, clock skew, and privacy. Sampling controls trace cost but can hide uncommon requests. High-cardinality metric labels increase time-series count and backend cost, which is why request and trace IDs normally stay out of metric dimensions. Aggregation can hide individual request behavior. Short retention limits historical investigations. Clock skew can make time-based correlation misleading. Missing instrumentation or broken trace-context propagation can break the investigation path.

For alerting, I would define the service-level indicator and service-level objective before choosing thresholds. Alerts should be based on meaningful user symptoms, be actionable, have clear ownership and severity, include runbook context, and use noise controls. I would test instrumentation, exemplar links, trace propagation, structured logging, dashboards, and alert behavior so operators can verify that the observability system reflects real service health.

Technical Approach
  1. Detect the user-visible symptom with a meaningful latency metric or other service-level indicator.
  2. Confirm the affected service, environment, version, host or Pod, time window, and scope.
  3. Use consistent low-cardinality resource attributes across signals.
  4. Propagate trace context and include request, trace, and span identifiers in spans and structured logs where appropriate.
  5. Pivot from the latency metric to an exemplar-linked trace when available; otherwise search traces from the same service and time window.
  6. Inspect the trace for slow or error spans and identify the affected service boundary.
  7. Query structured logs using the trace ID or request ID, narrowing with span ID, service name, and time when useful.
  8. Compare traces, logs, dependency signals, and recent relevant changes to form a testable hypothesis.
  9. Reject hypotheses that the evidence disproves, and do not treat correlation as proof of causation.
  10. After identifying the cause, apply the smallest safe correction.
  11. Verify improvement with the original metric, representative traces, and related logs, then continue monitoring for recurrence.
Practical Insights

The main costs are telemetry volume, storage, ingestion, queries, and maintenance. Metrics stay efficient when labels have low cardinality, but using a unique request or trace ID as a normal metric label can create huge numbers of time series. Traces may require sampling to control cost, but sampling can hide useful requests. Logs can become expensive when they are very verbose or retained for too long. Short retention saves storage but limits older investigations. Teams must also maintain instrumentation, context propagation, dashboards, alerts, privacy controls, clock synchronization, and consistent attribute naming.

Why Interviewers Ask This

Interviewers want to see whether I understand what metrics, traces, and logs each contribute during an investigation and how to connect them using consistent telemetry context. They are also testing my judgment around resource attributes, high-cardinality correlation identifiers, metric exemplars, trace sampling, evidence-based diagnosis, verification, and the difference between correlation and causation.

Common interview mistakes

Common mistakes are adding request, trace, or span IDs as normal metric labels and causing cardinality problems; assuming an exemplar always exists; assuming a missing sampled trace means the request never happened; querying logs without matching the correct service and time window; failing to propagate trace context across service boundaries; logging secrets or personal information; ignoring clock skew; treating one sampled trace as representative of all traffic; ignoring sampling bias or retention limits; and declaring a root cause merely because multiple signals happened at approximately the same time.

Interview tip

Explain the investigation as one clear sequence: latency metric, exemplar or matching trace, slow or error span, related structured logs, testable hypothesis, then verification. Mention consistent resource context, high-cardinality IDs, sampling, metric cardinality, and the rule that correlation narrows the search but does not prove causation.

Interviewer may ask next
What would you do if the latency metric has no exemplar?

I would use the metric to define the affected service, environment, time window, and scope, then search traces that match that scope. I would inspect representative slow or error traces and use their trace or request identifiers to find related structured logs. I would also consider trace sampling because the exact affected request may not have been retained. If this investigation path is important and the telemetry stack supports it, I would consider enabling metric exemplars so future metric-to-trace pivots are more direct.

What are the main tradeoffs when adding correlation identifiers to telemetry?

Correlation identifiers make traces and structured logs much easier to connect, but request IDs, trace IDs, and span IDs are high-cardinality values. They should generally not be ordinary metric labels because each unique value can increase the number of time series and raise memory, storage, ingestion, and query costs. Trace sampling also means some requests will not have retained traces. I would propagate identifiers consistently in request execution, keep metric dimensions low-cardinality, use exemplars for metric-to-trace links where supported, redact sensitive information, and choose sampling and retention policies that still support required investigations.

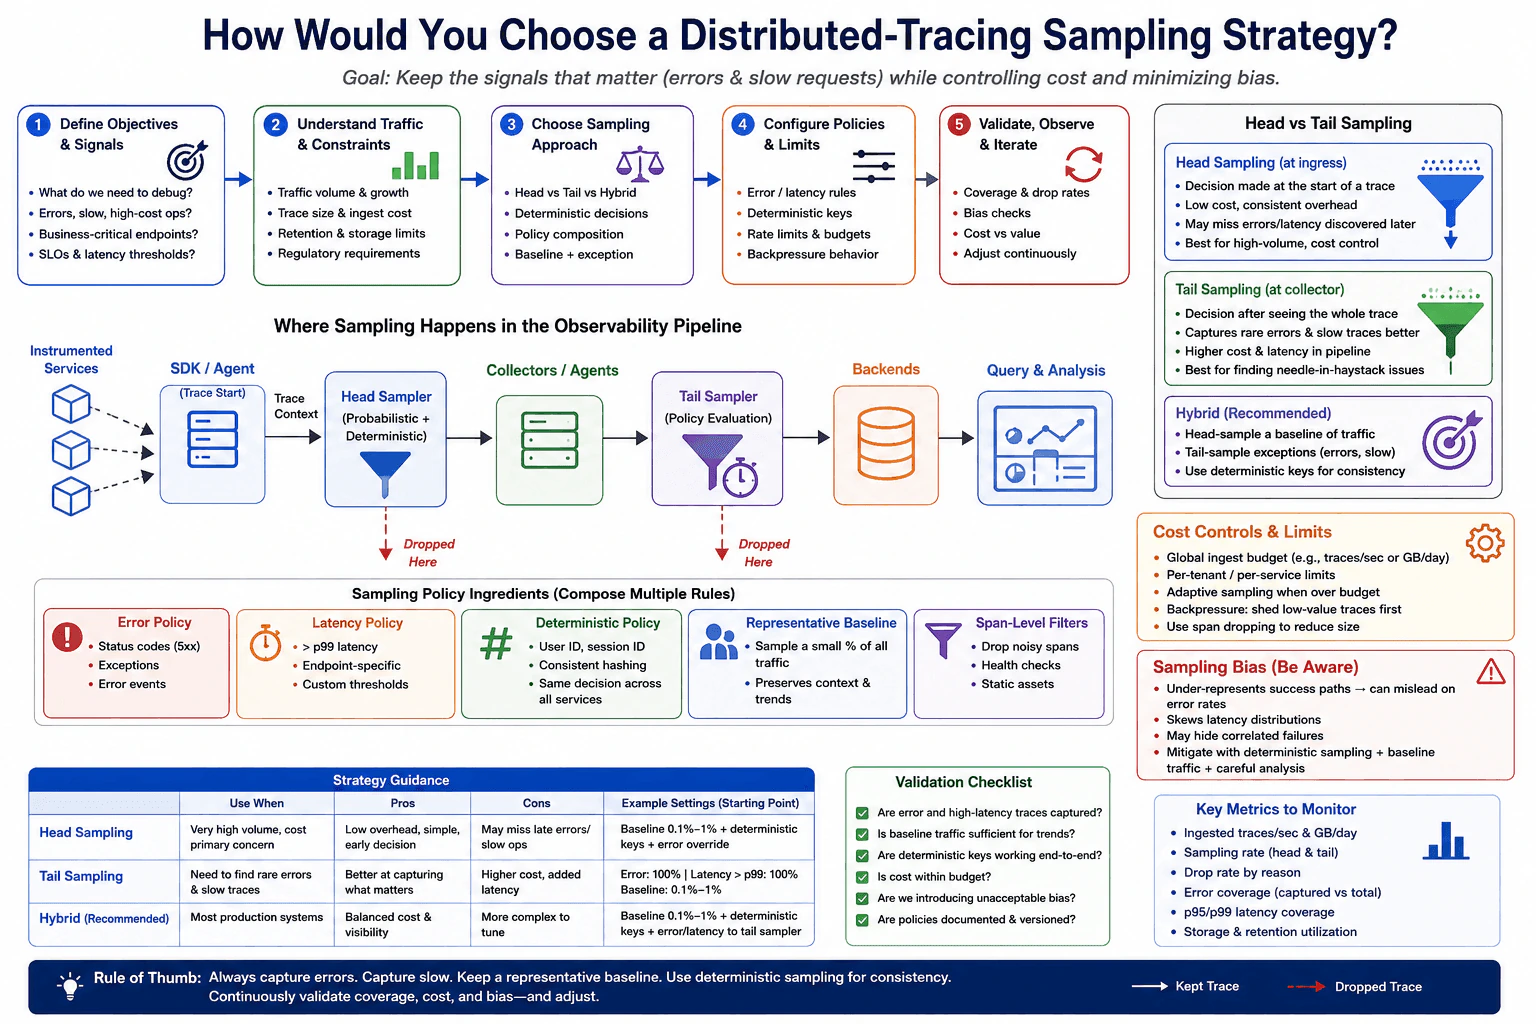
45. How would you choose a distributed-tracing sampling strategy?ObservabilityMedium

Question Details

A high-volume service cannot retain every trace but must preserve rare errors and slow requests. Compare head and tail sampling, deterministic decisions, error and latency policies, representative baseline traffic, cost limits, and the bias that sampling can introduce into conclusions.

Short Interview Answer (30-60 seconds)

I would combine a small deterministic baseline with tail-based exception policies. Keep important errors and slow traces, sample normal traffic consistently, and enforce cost and collector limits. Then monitor sampling rates, drop reasons, coverage, and bias so retained traces are not mistaken for the full traffic population.

Detailed Explanation

A busy service can produce far more request records than a team can afford to keep. The goal is to save the most useful examples without letting storage costs grow without control. I would make sure failed and unusually slow requests are kept because they are often the most valuable for investigation. I would also save a small, consistent share of ordinary requests so engineers can compare healthy and unhealthy behavior. Finally, I would regularly check what is being discarded, whether important cases are missing, and whether the saved data gives a misleading picture.

Useful Questions to Ask the Interviewer
  1. What traffic volume and growth should the design support?
  2. What ingestion, storage, or retention budget must the sampling policy stay within?
  3. Which errors, endpoints, or business-critical requests should receive priority retention?
  4. What latency thresholds or SLOs define a slow request?
  5. How much collector memory and decision delay is acceptable for tail sampling?
  6. Are there privacy or regulatory restrictions on trace attributes or payloads?
How would you choose a distributed-tracing sampling strategy? diagram
How to Explain It in an Interview

I would start with the objective: retain the traces that are most useful for reliability and performance investigations while keeping observability cost predictable and minimizing sampling bias.

Head sampling makes the keep-or-drop decision near the start of a trace, typically in application instrumentation or an SDK. It is simple, has low overhead, and gives predictable sampling volume. Its main weakness is that the final outcome is not yet known. A trace that later becomes slow or fails may already have been dropped.

Tail sampling delays the decision until a collector has received enough spans to evaluate the trace. That allows policies based on outcomes such as errors or high latency. It is therefore better for preserving rare failures and slow requests. The tradeoff is additional memory, processing, buffering, and decision delay because the collector must hold trace state while waiting for spans. Late or incomplete spans can also affect policy evaluation, so collector sizing and timing settings matter.

For the high-volume service in this question, I would normally choose the hybrid approach shown in the diagram. I would keep a small baseline of ordinary traffic and use tail policies to retain important errors and unusually slow traces. The baseline should use a stable probabilistic decision, normally derived from a uniformly distributed trace ID, so the same trace receives a consistent decision. If every service makes a head-sampling decision, parent-based propagation should be used so downstream services follow the upstream decision rather than independently resampling the trace.

Error policies can prioritize traces containing failed requests, exceptions, or error events. Latency policies can retain traces above an agreed threshold, such as an endpoint-specific threshold or one related to a latency SLO. I would avoid claiming that one universal percentile or fixed duration is always correct; the threshold should reflect the service objective and workload.

A representative baseline is important because retaining only bad traces creates a badly biased view of production traffic. I would keep a small percentage of normal traces using an unbiased deterministic probability rule. If traffic populations differ substantially, I may stratify baseline rates by service or another low-cardinality operational dimension. I would not assume that sampled trace counts directly equal production rates unless I also know the effective sampling probabilities and use them correctly in analysis.

I would put explicit cost controls around the design. Examples include a global ingest budget, per-service or per-tenant limits, retention limits, collector memory limits, and backpressure behavior. Tail sampling must not be allowed to buffer traces without bounds. During a surge, lower-value baseline traffic can be reduced first, while high-value error and latency policies receive priority within the available budget. If even protected traffic exceeds capacity, the system should expose that loss through drop-reason and saturation telemetry rather than silently implying complete coverage.

The diagram also shows span-level filtering. I would use this carefully for known low-value spans, such as intentionally noisy internal work or static-asset activity, only when removing those spans does not destroy the parent-child context required to understand the trace. Filtering is a cost optimization, not a substitute for trace-level sampling.

Sampling introduces bias. Oversampling failures makes stored traces appear less healthy than production traffic. Oversampling slow requests distorts the retained latency distribution. Aggressive baseline sampling can hide uncommon successful paths or correlated failures. I would therefore record the effective sampling policy, monitor keep and drop rates by reason, retain a baseline, use deterministic decisions where consistency matters, and clearly communicate that sampled traces are diagnostic evidence rather than an automatically representative source for every statistical conclusion.

Finally, I would validate the strategy continuously. I would check whether error and high-latency traces are captured at the intended rates, whether baseline traffic is sufficient for trend analysis, whether deterministic decisions remain consistent end to end, whether collector memory and backpressure stay healthy, and whether ingestion remains within budget. Useful monitoring includes ingested traces or bytes, head and tail sampling rates, drop rate by reason, error-trace coverage, slow-trace coverage, storage utilization, retention utilization, and collector saturation. Sampling policies should be versioned, documented, tested with synthetic traces, and reviewed when traffic, SLOs, or costs change.

Technical Approach
  1. Define the diagnostic objectives: important errors, slow requests, business-critical endpoints, relevant SLIs, and SLOs.
  2. Measure traffic volume, trace size, ingestion cost, retention limits, and collector capacity.
  3. Choose head sampling when low overhead and predictable early decisions matter most.
  4. Choose tail sampling when the final trace outcome, such as an error or high latency, must influence retention.
  5. For a high-volume production service, combine a small deterministic probability-based baseline with tail-based exception policies.
  6. Use a stable trace-level key, normally the trace ID, and parent-based propagation when head decisions must remain consistent across services.
  7. Configure error and latency policies using service-relevant conditions rather than arbitrary universal thresholds.
  8. Define global, per-service, or per-tenant ingest budgets plus collector memory, buffering, and backpressure limits.
  9. Record effective keep and drop rates by reason so operators know what was excluded.
  10. Validate error coverage, slow-trace coverage, baseline quality, deterministic behavior, cost, collector health, and sampling bias, then adjust the policy as conditions change.
Practical Insights

Head sampling is cheaper because it decides early and does not need to store the whole trace while making the decision. Tail sampling costs more memory and CPU because a collector temporarily keeps trace state and waits for enough spans to evaluate policies. Higher sampling rates increase network, ingestion, storage, query, and retention costs. More sampling rules also increase configuration and maintenance work. Tail sampling adds operational concerns such as collector capacity, decision windows, incomplete traces, memory limits, and backpressure. A small deterministic baseline is relatively inexpensive, but teams still need telemetry about effective sampling rates and dropped traces to understand the data correctly.

Why Interviewers Ask This

The interviewer wants to see whether the candidate can balance diagnostic value, observability-pipeline overhead, storage cost, and sampling bias. A strong answer distinguishes head and tail sampling, explains deterministic decisions, preserves rare errors and slow traces, keeps ordinary baseline traffic for comparison, defines cost limits, and verifies that the resulting trace population is still useful for diagnosis.

Common interview mistakes

Common mistakes include using only a very low random head-sampling rate and assuming rare failures will still be captured; keeping only errors and then treating retained traces as representative of all production traffic; allowing different services to make independent head-sampling decisions for the same trace; calling a policy deterministic without using a stable trace-level input; using one arbitrary latency threshold for every endpoint; configuring tail sampling without sufficient collector memory, decision timing, and backpressure controls; silently dropping traces when budgets are exceeded; filtering spans that are necessary to understand trace relationships; and calculating production error or latency distributions directly from a deliberately biased retained-trace population without accounting for the sampling policy.

Interview tip

Present sampling as a tradeoff rather than naming one universally best sampler. Compare head and tail decisions, recommend a deterministic baseline plus tail-based error and latency policies for this scenario, explain the cost controls, and finish with how you will measure coverage, drop reasons, collector health, and sampling bias.

Interviewer may ask next
When would you choose head sampling instead of tail sampling?

I would favor head sampling when very low overhead, simple operation, and predictable ingest volume matter more than preserving every rare error or slow request. The decision is made near trace creation, so the pipeline does not need to buffer the trace before deciding. I would normally use a probability rule based on the trace ID and propagate the decision so downstream services remain consistent. The limitation is fundamental: because the request outcome is not yet known, a trace that later fails or becomes slow may already have been dropped.

How would you keep error and latency policies from exceeding the trace budget during an incident?

I would define ingestion, collector-memory, and backpressure limits before the incident and monitor effective keep and drop rates. During a surge, I would reduce lower-value baseline traffic first so the available budget favors error and high-latency traces. Tail-sampling buffers must remain bounded. If protected traffic itself exceeds capacity, the collector may still have to drop data, so I would expose saturation and drop reasons through telemetry and alerts. Operators must know when coverage has degraded because retained traces then represent an even more selective population and require extra care when drawing conclusions.

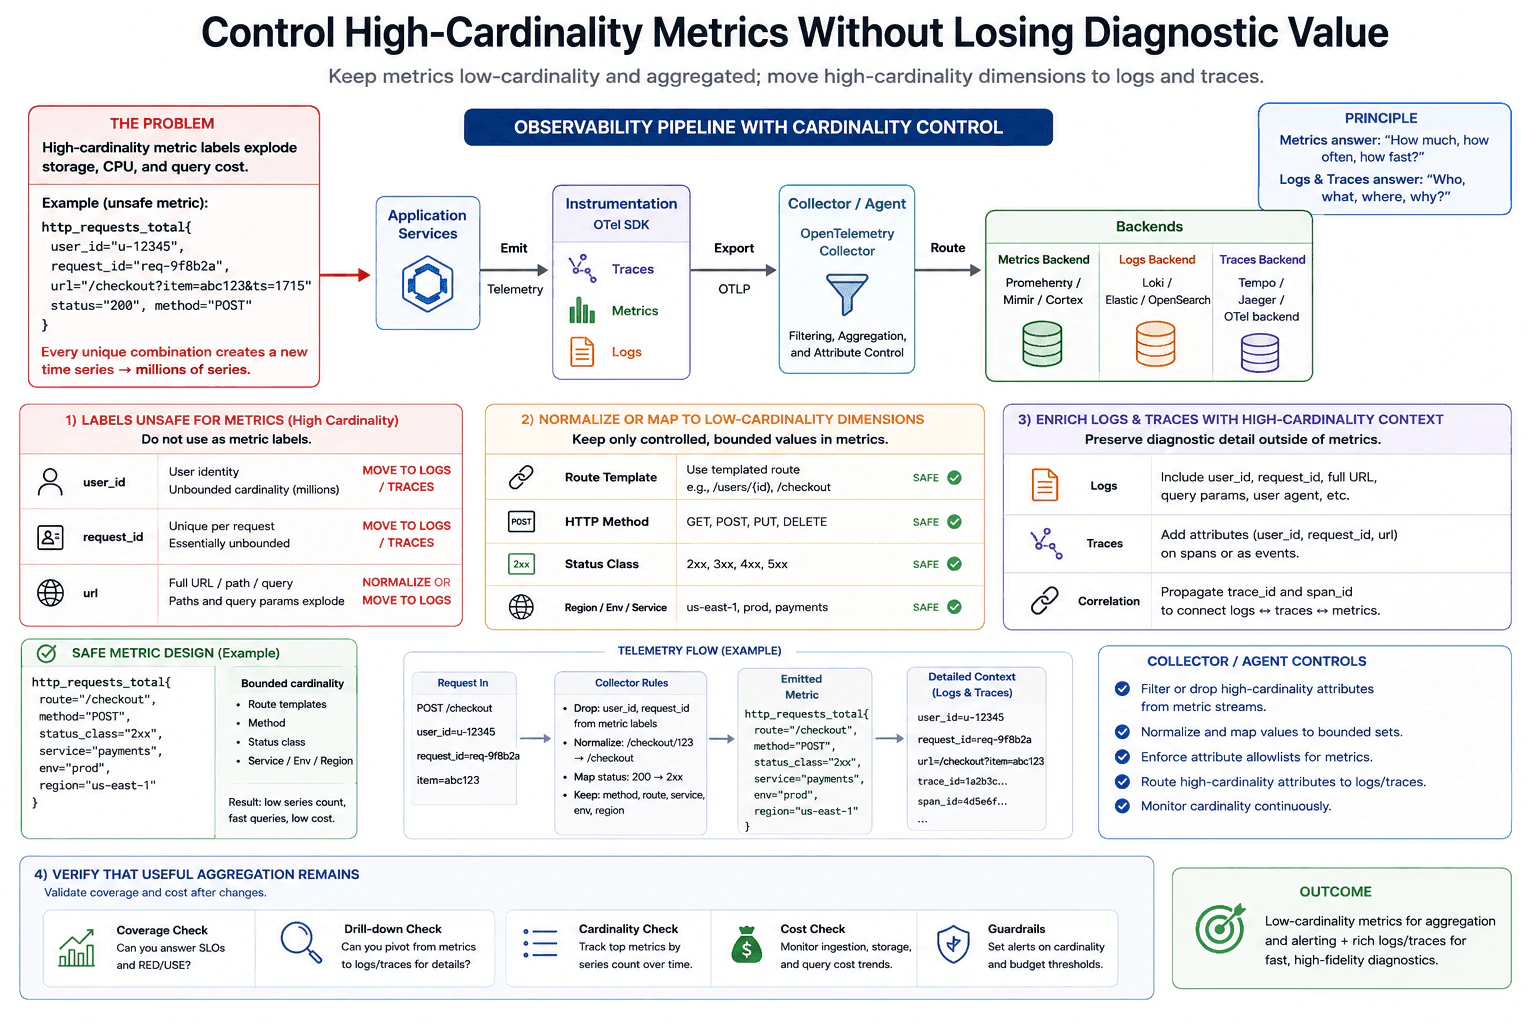
46. How would you control high-cardinality metrics without losing diagnostic value?ObservabilityMedium

Question Details

A request counter includes user_id, request_id, and unbounded URL values, causing storage and query cost to surge. Identify which labels are unsafe for metrics, which dimensions should be normalized or moved to logs and traces, and how to verify that useful aggregation remains.

Short Interview Answer (30-60 seconds)

I would remove user_id and request_id from metric labels, normalize raw URLs to route templates, and keep bounded dimensions such as method, status class, service, environment, and region. I would preserve request-level detail in correlated logs and traces, then verify aggregation coverage, drill-down, series cardinality, and cost.

Detailed Explanation

The goal is to keep the main health numbers useful without letting every user or request create a separate group. Values that are different almost every time should not be attached to those main numbers. Instead, use a small, predictable set of categories that still shows whether the service is healthy. Keep the detailed information about one person, one request, or one full web address in separate request records for investigation. After the change, check that the normal health views still work and that engineers can still move from a summary problem to the exact request details.

Useful Questions to Ask the Interviewer
  1. Which aggregations must the request metric continue to support, such as traffic, error rate, latency, service, environment, region, route, or method?
  2. Do we already have distributed traces and structured logs with trace_id and span_id correlation?
  3. Are there existing cardinality budgets, ingestion limits, retention requirements, or cost targets for the metrics backend?
  4. Are raw URLs or user identifiers considered sensitive data that require redaction, hashing, access controls, or shorter retention?
How would you control high-cardinality metrics without losing diagnostic value? diagram
How to Explain It in an Interview

I would start by separating dimensions needed for aggregation from dimensions needed only for diagnosis.

The unsafe metric labels are user_id, request_id, and an unbounded raw URL. user_id can have millions of values, request_id is effectively unique for every request, and raw URLs can contain path identifiers or query parameters that continually create new values. In a time-series metrics system, each unique combination of label values can create another series, so these labels can rapidly increase ingestion, memory, storage, and query cost.

For metrics, I would keep bounded dimensions that answer operational questions. The approved diagram uses route template, HTTP method, status class, service, environment, and region. For example, /users/12345 should become a normalized route such as /users/{id}. A URL such as /checkout?item=abc123 should normally be represented in the request metric by the route template /checkout, while the detailed URL or relevant request fields belong in logs or traces. HTTP methods such as GET and POST are naturally bounded. Status values can be grouped into classes such as 2xx, 3xx, 4xx, and 5xx when class-level aggregation is sufficient for dashboards and alerts.

I would move user_id and request_id out of the metric stream. Request-specific context can remain in structured logs or trace span attributes and events, subject to privacy and retention controls. Logs provide searchable event details. Traces show the path and latency of an individual request across services. I would propagate trace_id and span_id so that an operator can correlate traces with related logs and, where the observability platform supports exemplars or another supported linkage, pivot from an aggregated metric view toward representative traces. This preserves diagnostic depth without making the metrics backend store unbounded dimensions.

The application instrumentation emits metrics, traces, and logs. An OpenTelemetry Collector or equivalent collector can then apply signal-specific controls before routing telemetry to the appropriate backends. For metrics, I would use an explicit attribute allowlist, remove known high-cardinality attributes, normalize paths to route templates, map selected values to bounded sets when appropriate, and continuously monitor series cardinality. Metrics go to the metrics backend for aggregation, dashboards, and alerting, while logs and traces go to their corresponding backends for detailed investigation.

I would also treat cardinality as a budget rather than reacting only after cost grows. I would track active series counts for important metric families, set guardrail alerts when counts exceed expected limits, and review new metric attributes before deployment. This reduces the chance that another unbounded value is introduced later.

Verification has four parts. First, coverage: existing dashboards, alerts, and any defined SLIs or SLOs must still answer the required service-health questions using bounded dimensions such as route template, method, status class, service, environment, and region. Second, drill-down: an operator should still be able to move from an abnormal aggregate to representative traces and related logs for request-level detail. Third, cardinality: I would monitor the top metric families by active series count and confirm that the affected series count falls and remains within budget. Fourth, cost: I would compare ingestion, storage, and query-cost trends before and after the change.

There is a deliberate tradeoff. Removing high-cardinality labels means the metrics backend can no longer directly answer questions such as 'show me this one user's request counter.' That detail moves to logs and traces. Metrics answer aggregate questions such as how much traffic exists, how often requests fail, and which route, service, environment, or region is affected. Logs and traces answer detailed questions about individual requests. This separation keeps metrics fast, affordable, and aggregation-friendly while retaining high-fidelity diagnostic context.

Technical Approach
  1. Inventory every label on the request metric and classify each as bounded or high-cardinality.
  2. Remove user_id and request_id from metric attributes because they are per-user or per-request identifiers.
  3. Normalize raw URLs to stable route templates such as /users/{id}; keep full request details only where needed in logs or traces.
  4. Keep bounded metric dimensions such as route template, HTTP method, status class, service, environment, and region.
  5. Use instrumentation or collector rules to filter forbidden metric attributes, apply normalization, and enforce an attribute allowlist.
  6. Preserve trace_id and span_id correlation for traces and logs so operators can investigate individual requests.
  7. Verify dashboards, alerts, SLIs, and SLOs after the change.
  8. Measure active series counts, ingestion, storage, and query-cost trends, and add cardinality guardrails to prevent regression.
Practical Insights

The main metrics cost comes from the number of time series, not only the number of requests. Each different combination of label values can produce another series. Adding user_id, request_id, or arbitrary URLs can therefore create a very large number of series. Removing or normalizing those values reduces ingestion, memory, storage, and query work in the metrics backend. Logs and traces still have storage and retention costs, so detailed fields should be collected deliberately, sampled when appropriate, protected for privacy, and retained according to diagnostic need. Attribute allowlists and cardinality budgets add some maintenance, but they prevent much larger operational costs.

Why Interviewers Ask This

This tests whether the candidate understands that observability is not about storing every dimension in every signal. Interviewers want to see whether the candidate can control metric cardinality and cost while preserving useful aggregation, move request-specific context to logs and traces, correlate the signals correctly, and verify that dashboards, alerts, SLIs, SLOs, and investigations still provide enough operational value.

Common interview mistakes

Common mistakes are keeping user_id or request_id as metric labels; using the complete URL including path IDs and query parameters instead of a route template; assuming that removing a metric label means the information must be discarded entirely; storing sensitive user or request data without privacy controls; removing too many dimensions so dashboards can no longer identify the affected route, service, or environment; expecting metrics alone to provide request-level diagnosis; adding trace_id or span_id as ordinary metric labels; and declaring success without checking dashboard coverage, alerts, SLIs, SLOs, drill-down paths, series cardinality, and cost after the change.

Interview tip

State the decision first: metrics get bounded aggregation dimensions, while request-specific detail belongs in correlated logs and traces. Then name the unsafe labels, show how raw URLs become route templates, explain collector guardrails, and finish with verification of coverage, drill-down, series cardinality, and cost.

Interviewer may ask next
How would you verify that removing high-cardinality labels did not reduce useful observability?

I would verify four things. First, coverage: existing dashboards, alerts, SLIs, and SLO calculations must still answer the required service-health questions using bounded dimensions such as route template, method, status class, service, environment, and region. Second, drill-down: operators should still be able to move from an abnormal aggregate to representative traces and related logs for individual-request details. Third, cardinality: I would track active series counts for the affected metric families and confirm that they fall and remain within budget. Fourth, cost and performance: I would compare ingestion volume, storage growth, query latency, and query-cost trends before and after the change.

What would you do if the team says it sometimes needs to investigate one specific user or request?

I would not put user_id or request_id back into the metric labels because those identifiers are intentionally high-cardinality. I would keep the aggregate metric dimensions bounded and preserve request-specific context in structured logs or trace spans, subject to privacy, access, sampling, and retention rules. With trace_id and span_id correlation, the team can investigate a representative trace and related logs after identifying the affected route, service, environment, region, or status class in the metric view. This preserves detailed investigation without recreating the metric-cardinality problem.

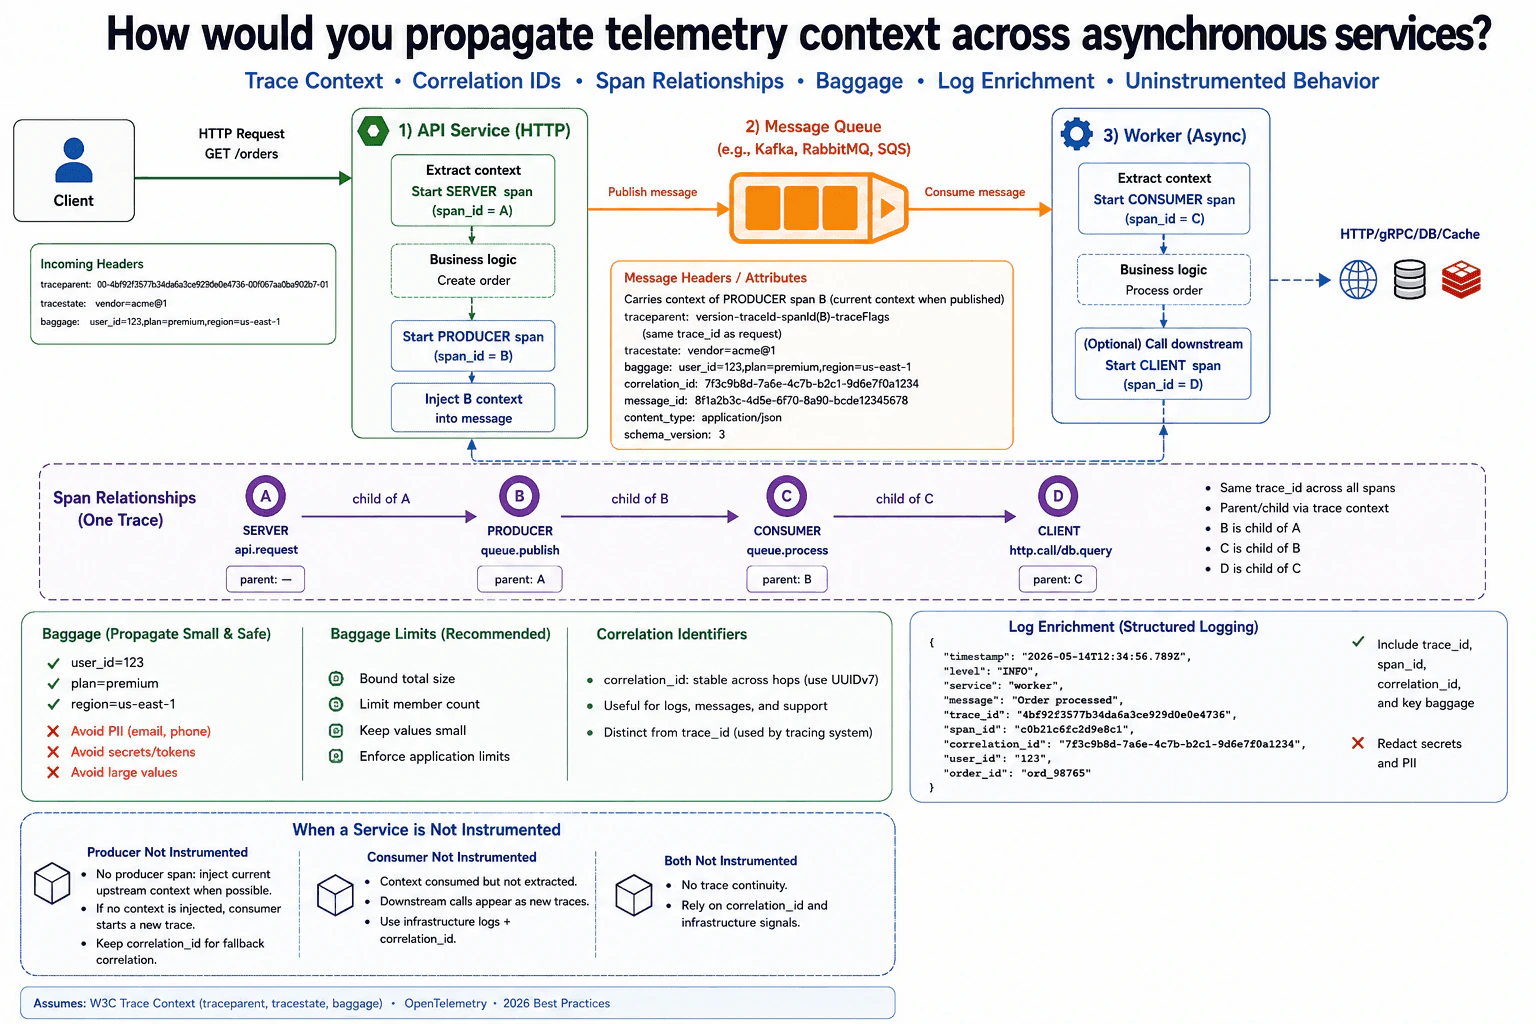
47. How would you propagate telemetry context across asynchronous services?ObservabilityMedium

Question Details

A request passes through HTTP, a message queue, and a background worker. Design trace-context injection and extraction, correlation identifiers, span relationships, baggage limits, log enrichment, and behavior when a producer or consumer is not instrumented.

Short Interview Answer (30-60 seconds)

Extract context at incoming boundaries and inject the current span context at outgoing boundaries. Use SERVER → PRODUCER → CONSUMER → CLIENT spans, carry a stable correlation_id, keep baggage small and safe, enrich structured logs, and use correlation-based fallback when instrumentation is missing.

Detailed Explanation

The goal is to let operators follow one piece of work even when it moves through several programs and waits in a queue. Each program should pass enough identifying information to the next one so events from the same request can be connected later. A separate shared identifier also helps people search records when some parts cannot provide the full history. Only small, safe business details should travel with the request. Private information and secrets should not be carried. If one program cannot participate, the rest should continue working and provide the best possible connection using the information that remains.

Useful Questions to Ask the Interviewer
  1. Which messaging system is used, and can it preserve message headers or attributes unchanged?
  2. Are all producers and consumers instrumented with OpenTelemetry, or must the design support partially instrumented services?
  3. Do we need an application correlation_id in addition to trace_id for support workflows or systems that do not understand tracing?
  4. Which baggage fields are actually required across service boundaries, and what privacy or size restrictions apply?
  5. Can each message be processed once, retried, or consumed by multiple independent consumers?
How would you propagate telemetry context across asynchronous services? diagram
How to Explain It in an Interview

I would begin with the operational objective: an operator should be able to follow one request from the HTTP API, through message publication, through queue consumption, and into downstream HTTP, gRPC, database, or cache work. The smallest useful signals here are distributed traces and structured logs. A stable correlation_id gives an additional search key for support workflows and partially instrumented systems.

At the HTTP boundary, the API extracts the incoming W3C Trace Context, normally traceparent plus optional tracestate and baggage. It then starts SERVER span A using the extracted parent. If there is no valid incoming trace context, span A becomes the root of a new trace.

Before publishing the asynchronous message, the API starts PRODUCER span B as a child of SERVER span A. While span B is current, it injects B's trace context into message headers or attributes. This means the message keeps the same trace_id while its propagated parent context represents producer span B, not the earlier server span.

The message queue transports those headers or attributes. It does not need to understand the trace itself. At the worker boundary, the consumer extracts the propagated context before starting processing. For the single-message causal flow shown in the diagram, it starts CONSUMER span C as a child of the extracted producer context B.

If the worker calls another HTTP or gRPC service, database, cache, or similar downstream dependency, it starts CLIENT span D as a child of C. For protocols that support propagation, the current client context is injected into the outgoing request.

The normal relationship shown in the diagram is SERVER A → PRODUCER B → CONSUMER C → CLIENT D. All of these spans use the same trace_id. B has parent A, C has parent B, and D has parent C. More complex messaging patterns can need span links instead of one artificial parent. For example, batch processing influenced by several independent messages may link to multiple source contexts. That is different from the single-message chain shown here.

I would keep correlation_id separate from the tracing model. It should remain stable across the business operation and can be placed in message metadata and structured logs. It is useful when searching logs, assisting users, or correlating systems that do not support distributed tracing. It does not replace trace_id because trace_id and span relationships are what the tracing system uses to reconstruct a distributed execution path.

Baggage should contain only small, safe, low-cardinality values that downstream services genuinely need, such as a safe user or tenant identifier, plan, or region when permitted. I would bound total size, limit member count, keep values small, and enforce application-specific limits. I would not propagate passwords, tokens, personal information, large payloads, or uncontrolled high-cardinality values. Baggage can cross many service boundaries, so every field has network, privacy, and operational cost.

Structured logs should be enriched automatically with trace_id, span_id, correlation_id, service identity, and selected safe context. That lets an operator move from a log event to the corresponding trace or search all related records by correlation_id. Sensitive data must be redacted instead of being copied into logs simply because it appears in baggage or message metadata.

The design must also degrade gracefully. If the producer does not create a PRODUCER span but can still propagate the current upstream context, it should inject that context into the message. If it injects no trace context, an instrumented consumer starts a new trace. A stable correlation_id can still connect logs across that broken trace boundary.

If the consumer is not instrumented, it does not extract the propagated trace context or create CONSUMER span C. Trace continuity therefore stops at that boundary, and downstream work may appear as unrelated traces. Operators then rely on correlation_id, application logs, and infrastructure signals. If neither producer nor consumer participates in tracing, there is no end-to-end distributed trace, but correlation metadata can still provide partial visibility.

I would test the complete path with a known request and verify that spans A, B, C, and D share one trace_id and have the expected A → B → C → D ancestry. I would also test a missing or malformed trace context, an uninstrumented producer, an uninstrumented consumer, baggage filtering, retries, and application baggage limits. For overall service health, I would define SLIs such as successful message processing and processing latency, agree on SLOs from product requirements, and then create actionable alerts. I would not assume sampled traces alone represent complete service health because sampling can hide or bias rare execution paths.

Technical Approach
  1. Extract W3C trace context from the incoming HTTP request.
  2. Start SERVER span A from the extracted parent, or start a new trace if no valid parent exists.
  3. Start PRODUCER span B as a child of A before publishing.
  4. Inject B's current trace context into message headers or attributes.
  5. Carry a stable correlation_id separately for logs and fallback correlation.
  6. Propagate only small, safe, bounded baggage values.
  7. At the worker, extract the message context before starting processing.
  8. Start CONSUMER span C as a child of the extracted B context for this single-message flow.
  9. Start CLIENT span D for downstream HTTP, gRPC, database, or cache work, and propagate its current context when the downstream protocol supports propagation.
  10. Enrich structured logs with trace_id, span_id, correlation_id, service identity, and selected safe context.
  11. If trace context is missing, start a new trace at the next instrumented boundary and retain correlation_id when available.
  12. Verify parent relationships, propagation, log enrichment, redaction, missing-instrumentation behavior, retries, and baggage limits with integration tests.
Practical Insights

Reading and writing trace context usually adds very little CPU or memory cost, but every span and log record creates telemetry that must be transported, indexed, stored, and retained. Sampling reduces trace ingestion cost but can hide rare paths or bias analysis if used carelessly. Baggage makes each propagated request or message larger, so unbounded or high-cardinality values increase network, privacy, and operational costs. A correlation_id adds little runtime cost but requires consistent propagation and logging. The main maintenance cost is keeping instrumentation, propagation rules, log fields, privacy controls, and tests consistent across services.

Why Interviewers Ask This

This question tests whether the candidate understands that asynchronous messaging crosses process and time boundaries, so telemetry context must be propagated explicitly. The interviewer is evaluating correct SERVER, PRODUCER, CONSUMER, and CLIENT span relationships; W3C Trace Context injection and extraction; safe baggage handling; useful log correlation; and practical behavior when some services are not instrumented.

Common interview mistakes

Common mistakes include injecting the old SERVER span context after a PRODUCER span has been created instead of injecting the current producer context; creating a new consumer trace even when valid message context exists; treating correlation_id as a replacement for trace_id; starting the CONSUMER span before extracting message context; forcing one parent when batch or multi-source processing should use span links; placing secrets, personal data, large values, or uncontrolled high-cardinality values in baggage; copying sensitive baggage directly into logs; assuming arbitrary fixed baggage limits apply universally; expecting an uninstrumented consumer to maintain trace continuity automatically; and treating sampled traces as complete evidence of service health.

Interview tip

Draw one causal path first: HTTP SERVER A → message PRODUCER B → message CONSUMER C → downstream CLIENT D. Explain exactly where context is extracted and injected. Then cover correlation_id, bounded baggage, structured log enrichment, and graceful fallback when instrumentation is missing.

Interviewer may ask next
What would you do if a worker processes a batch containing messages from several different traces?

I would not pretend that all source messages have one natural parent. The processing span can use an appropriate local parent and add span links to the source message contexts according to the messaging semantics and OpenTelemetry conventions in use. Those links preserve the relationships to the originating traces without inventing an incorrect parent-child chain. I would also bound the number of links and attributes to control telemetry size and test how the tracing backend presents the batch relationship.

What happens when the producer or consumer is not instrumented?

If the producer does not create a PRODUCER span but can propagate its current upstream context, it should inject that context into the message. If no trace context is injected, an instrumented consumer starts a new trace. If the consumer is not instrumented, it does not extract the context or create a CONSUMER span, so trace continuity stops at that boundary and later downstream calls may appear as separate traces. A stable correlation_id in message metadata and structured logs can provide fallback correlation. If neither side is instrumented, there is no end-to-end distributed trace, so operators rely on correlation_id, logs, and infrastructure signals.

48. How would you alert on a rapidly burning error budget?ObservabilityHard

Question Details

A service has a defined availability SLO over a rolling window. Design multi-window, multi-burn-rate alerting that distinguishes urgent pages from slower tickets, accounts for low traffic, links alerts to user-impact evidence, and avoids treating a single transient error as an SLO incident.

Short Interview Answer (30-60 seconds)

I would use multi-window, multi-burn-rate alerting. A severe burn must breach both a short and long window before paging on-call. Slower sustained burns create tickets. I would guard against low traffic, ignore single transient spikes, and attach user-impact and diagnostic context to every alert.

Detailed Explanation

The goal is to notice when a service is failing much faster than the business has agreed to accept, without waking someone for one harmless mistake. I would compare what is happening over a short period with what is happening over a longer period. A serious problem that continues in both periods should call the person responsible immediately. A slower problem should create work for the team. When very few people are using the service, I would wait for enough evidence or look for direct customer harm before treating it as a real incident.

Useful Questions to Ask the Interviewer
  1. What availability target and rolling evaluation period are defined for this service?
  2. Which requests or user outcomes count as successful and unsuccessful?
  3. What level of sustained impact should page on-call versus create a service ticket?
  4. How low can traffic become, and which user-impact signals are available when request ratios are unstable?
  5. Which telemetry backends, alert router, dashboards, and notification destinations are already used?
How would you alert on a rapidly burning error budget? diagram
How to Explain It in an Interview

I would start with the availability SLI and SLO. The SLI, or service-level indicator, measures the fraction of valid requests or user outcomes that succeed. The SLO, or service-level objective, is the target availability over a rolling window. The allowed bad-event fraction is the error budget:

error budget = 1 - SLO

Then I calculate burn rate:

burn rate = observed bad-event fraction / allowed bad-event fraction

For an availability SLO:

burn rate = (1 - availability over the alert window) / (1 - SLO)

A burn rate above 1 means the service is consuming its error budget faster than the sustainable rate. A burn rate of 14 means it is consuming that budget 14 times faster than allowed.

The main design is multi-window, multi-burn-rate alerting. I evaluate a short window and a longer window together. The short window detects a fast change quickly. The long window confirms that the problem is sustained. I require both windows in a severity tier to breach before taking that tier's action. That prevents a single transient error or short spike from becoming an SLO incident.

The final diagram uses these illustrative policy tiers:

  1. Urgent page: 5m AND 1h >= 14x. This represents severe, sustained budget consumption and pages on-call immediately.
  2. High-priority ticket: 30m AND 6h >= 6x. This represents a slower but still important burn and creates a high-priority service ticket.
  3. Medium ticket: 2h AND 24h >= 2x. This catches a slower budget drain that needs engineering work.
  4. Low-severity tracking: 6h AND 72h >= 1x. This indicates that the service is consuming budget faster than its long-term sustainable pace and should be tracked or reviewed.

These thresholds are example policy values from the diagram, not universal constants. In a real system I would tune the windows and burn-rate thresholds to the actual SLO period, business impact, incident history, and paging policy.

Low traffic requires a guardrail. A percentage can look extreme when only a few requests occurred. Before paging, I would require enough requests for the ratio to be stable. If traffic is too low, I would extend the observation window or use absolute-impact evidence, such as failed important user journeys or synthetic checks. I would not apply one arbitrary minimum request count to every service.

The telemetry flow in the diagram starts at the instrumented service. The service produces metrics, traces, and structured logs. An OpenTelemetry Collector or equivalent agent batches, enriches, redacts, and exports that telemetry. Metrics are stored in Prometheus, traces in Tempo, and structured logs in Loki. These product choices can be replaced by equivalent backends, but the signals should share consistent service, route, environment, and correlation attributes where appropriate.

Prometheus provides the request volume, error, latency, and SLO metrics used to calculate the burn-rate conditions. Tempo provides distributed traces for affected requests. Loki provides structured logs with correlation identifiers. Traces and logs support investigation, but they do not independently prove an SLO violation. The SLI and burn-rate metrics are the alert source.

The SLO and alerting engine evaluates the paired burn-rate windows. Alertmanager then routes the resulting notification by severity. Severe sustained burn goes to PAGE -> on-call. Slower sustained burn goes to TICKET -> service queue. A team or incident channel can receive supporting notifications, and each notification should include a runbook link.

When an alert fires, the responder should follow the same evidence flow shown in the diagram: confirm that the paired windows are breached, open the SLO dashboard, check request volume, inspect the error trend, drill into correlated traces, review correlated structured logs, and determine affected users or failed journeys. No single metric, trace, or log entry should be treated as proof of root cause by itself.

The alert context should include the SLO, burn rate, short and long windows, service or route, request volume, affected users or journeys when available, correlation or trace ID when available, severity, ownership, and runbook link. Credentials, tokens, personal data, and sensitive payloads should be redacted before telemetry leaves the service or collector.

I would also add anti-noise controls. Validate request volume before paging. Require multi-window confirmation. Deduplicate and group alerts by service. Do not page for a single transient spike. Continuously review SLOs and thresholds using real incidents, noisy alerts, and missed incidents.

Finally, I would test the design with known scenarios: healthy traffic, one brief spike, sustained fast burn, slower sustained burn, low traffic, missing telemetry, and recovery. Operators should verify that the SLO dashboard, Prometheus calculations, Alertmanager routing, page or ticket destination, correlated traces and logs, and runbook links all reflect the expected service state.

There are tradeoffs. More windows and more telemetry increase query, ingestion, storage, retention, and maintenance cost. High-cardinality metric attributes can create excessive time-series growth, so labels must be bounded. Trace sampling can hide individual examples, so sampled traces must not replace complete SLI counters. Missing telemetry can create blind spots, clock skew can make correlation harder, and retention should be long enough for investigation without storing unnecessary sensitive data.

Technical Approach
  1. Define the availability SLI and rolling-window SLO.
  2. Calculate the allowed bad-event fraction as 1 - SLO.
  3. Calculate burn rate as observed bad-event fraction divided by allowed bad-event fraction.
  4. Evaluate paired short and long windows for every severity tier.
  5. Page on-call only when a severe tier breaches both windows; route slower sustained tiers to tickets or tracking.
  6. Check request volume before acting on a ratio. If traffic is too low, extend the window or use absolute user-impact evidence.
  7. Send metrics through the telemetry pipeline to the metrics backend and use them for the SLO and burn-rate evaluation.
  8. Route qualifying alerts through Alertmanager with severity, ownership, SLO, burn rate, both windows, service or route, request volume, user impact, correlation context, and runbook link.
  9. Investigate by checking the SLO dashboard, request volume, error trend, correlated traces, structured logs, and affected users or journeys.
  10. Deduplicate alerts, reject single transient spikes, test failure and recovery scenarios, and regularly review the thresholds.
Practical Insights

The burn-rate math is inexpensive because it uses aggregated time-series data, but operational cost grows with the number of services, routes, labels, windows, and alert rules. More metric series increase Prometheus storage and query work. Traces and logs add ingestion and retention cost. High-cardinality labels can become expensive, so dimensions such as user IDs should not be used as unrestricted metric labels. Trace sampling saves storage but may hide individual examples. Teams also have maintenance cost for alert testing, threshold tuning, runbooks, routing, dashboards, and telemetry-pipeline health.

Why Interviewers Ask This

This question tests whether a candidate can convert an availability objective into actionable, low-noise production alerts. It evaluates error-budget and burn-rate reasoning, multi-window confirmation, severity-based routing, low-traffic handling, telemetry correlation, user-impact evidence, dashboards, runbooks, and the judgment needed to avoid paging on isolated transient failures.

Common interview mistakes

Common mistakes are paging on raw error counts, using only one evaluation window, paging on a single short spike, treating every burn rate above 1 as equally urgent, and ignoring request volume when traffic is low. Other mistakes are using one fixed minimum request threshold for every service, assuming traces or logs prove an SLO violation, omitting ownership or runbook context, failing to deduplicate alerts, using unbounded high-cardinality metric labels, placing sensitive data in telemetry, and not testing alert behavior during transient failures, missing telemetry, low traffic, or recovery.

Interview tip

Lead with the operational decision: severe sustained burn pages on-call, slower sustained burn creates a ticket, and one transient spike does neither. Then explain the burn-rate formula, paired short and long windows, low-traffic guardrail, Alertmanager routing, and the user-impact evidence attached to the alert.

Interviewer may ask next
Why require both a short and a long window before paging?

The short window detects a rapid increase quickly, while the long window confirms that the problem is sustained. Requiring both reduces false pages from brief spikes or one-off errors. In the diagram, the urgent tier uses 5m AND 1h >= 14x, so both windows must show the severe burn before on-call is paged.

How would you handle burn-rate alerting when the service has very low traffic?

I would first check whether enough requests exist for the failure ratio to be meaningful. If not, I would extend the evaluation window or use absolute user-impact evidence such as failed important journeys or synthetic checks. I would avoid a universal fixed request threshold because the correct guardrail depends on normal traffic and business impact.

49. How would you design a resilient OpenTelemetry Collector architecture?ObservabilityHard

Question Details

Telemetry from many services must be received, enriched, sampled, batched, and exported to multiple backends. Design agent and gateway roles, load balancing, memory and queue limits, backpressure, retry and drop behavior, failure isolation, sensitive-data processing, and monitoring of the telemetry pipeline itself.

Short Interview Answer (30-60 seconds)

I would use lightweight agents near workloads and horizontally scaled gateways for heavier processing. I would add trace-affinity routing for tail sampling, bounded persistent queues, backoff retries, explicit overload policies, independent exporters, sensitive-data redaction, multi-tenant controls, and collector self-monitoring.

Detailed Explanation

The goal is to build a dependable path that carries information about running applications without becoming another fragile part of the system. Small workers close to each application gather the information, add useful context, remove private values, and send it onward. A shared middle layer performs the heavier work and sends the information to several storage systems. The design must continue working when traffic grows, a destination slows down, a machine fails, or storage fills up. Operators must also be able to see when this information-carrying path is unhealthy or losing data.

Useful Questions to Ask the Interviewer
  1. Which signals must the pipeline handle: traces, metrics, logs, or all three?
  2. Do traces require tail sampling, and what sampling policies are expected?
  3. How much telemetry loss is acceptable during overload or backend outages?
  4. How long should telemetry be buffered when a backend is unavailable?
  5. Are there tenant-isolation, privacy, residency, or sensitive-data requirements?
  6. Which backends receive each signal, and must any signal fan out to multiple destinations?
  7. What availability, recovery, and latency objectives apply to the telemetry pipeline itself?
How would you design a resilient OpenTelemetry Collector architecture? diagram
How to Explain It in an Interview
1. Separate agent and gateway roles

I would use two OpenTelemetry Collector roles.

Agent collectors run close to workloads, for example as a Kubernetes DaemonSet or sidecar where that deployment model is appropriate. They receive OTLP over gRPC or HTTP, add resource information such as Kubernetes attributes, redact sensitive fields, perform lightweight filtering or head sampling when required, batch telemetry, and forward it to gateways.

Gateway collectors run as multiple regional or central replicas. They perform processing that benefits from a shared view: additional enrichment, redaction, tail sampling, transformations, tenant-aware routing, batching, and fan-out to multiple backends.

This keeps collection close to applications while allowing expensive processing and backend integrations to scale independently.

2. Use signal-aware load balancing

Metrics and logs can normally use ordinary load balancing because one record does not require all related records to land on the same gateway instance.

Tail-sampled traces are different. A tail sampler needs the spans belonging to the same trace before it can make a reliable sampling decision. I would therefore use trace-ID-aware routing, such as consistent hashing by trace ID, so all spans for one trace are sent to the same gateway replica.

The routing component must actually implement that affinity. A normal round-robin Kubernetes Service or generic L7 load balancer alone does not provide trace-ID affinity. Endpoint discovery and health checks can still be used, but trace routing must happen in the signal-aware layer before the spans reach the tail-sampling gateway.

3. Bound memory and queues

Every collector must have explicit resource limits. I would configure a memory limiter and bounded exporter sending queues rather than allowing unlimited buffering.

Queue size, worker concurrency, batch size, memory limits, and timeouts should be selected from measured ingest rate, burst size, available node resources, and the expected duration of temporary backend outages.

When telemetry should survive a collector restart or short backend outage, I would configure the exporter sending queue to use the file_storage extension. That provides persistent local buffering, but it remains bounded by disk capacity and configured queue limits.

4. Define backpressure and drop behavior

I would not claim that the Collector guarantees end-to-end backpressure to every producer.

When memory or queue limits are reached, a collector may reject new telemetry. Upstream components that support retry can retry that telemetry. If the producer cannot retry, or if overload lasts too long, telemetry can be lost.

For sustained overload, I would use an explicit policy: configured filtering, sampling, rate limiting, admission control, or dropping lower-priority telemetry. The loss policy should be intentional so high-value telemetry is not accidentally displaced by noisy low-value data.

5. Retry temporary failures safely

Each backend exporter should use a bounded sending queue and retry transient failures with exponential backoff and jitter. Retry behavior must also be bounded, for example by a maximum elapsed time, so a permanently failing destination cannot consume resources forever.

Retries are useful for short network failures, rate limiting, and temporary backend outages. They do not replace capacity planning. If a backend stays unavailable until its persistent queue fills, the collector must eventually reject or drop telemetry according to the configured policy.

6. Isolate backend failures

I would use independent exporters and queues for independent destinations. Metrics may go to a metrics backend, traces to a trace backend, logs to a log backend, and selected telemetry may also fan out to an analytics or secondary destination.

Because each destination has its own exporter, queue, and retry state, one slow or unavailable backend does not have to block unrelated backends. This is the main failure-isolation boundary in the export layer.

For multi-tenant environments, I would also apply tenant-aware routing, quotas, and rate limits so one tenant cannot consume all gateway capacity.

7. Process sensitive data before export

Sensitive-data processing should happen before telemetry leaves the controlled collector boundary. I would redact credentials, tokens, personal data, and sensitive payload fields as early as practical.

Transport between applications, agents, gateways, and backends should use TLS or mTLS where required. Collectors should use least-privilege permissions, approved secret management, authentication and authorization controls, tenant isolation, and network policies or firewalls.

8. Make the telemetry pipeline observable

The collectors are production services, so I would define telemetry-pipeline SLIs before choosing alert thresholds.

Useful SLIs include successful export rate, drop rate, queue utilization, processing or export latency, collector availability, and the difference between received and successfully exported telemetry where that comparison is meaningful.

An example SLO could be: during normal operating conditions, at least the agreed percentage of accepted high-priority telemetry is successfully exported within the agreed delay. I would not invent the percentage or delay; those values should come from business and operational requirements.

I would collect Collector self-metrics for CPU, memory, accepted telemetry, throughput, queue size, queue capacity, retries, dropped telemetry, and exporter failures. I would keep structured internal logs with useful pipeline context while excluding secrets and personal data. Health and readiness probes should show whether collector instances are able to participate in the pipeline.

Only after the SLO and SLIs are defined would I create alerts. Alerts should be symptom-based and actionable, for example sustained queue saturation, rising drop rate, persistent exporter failures, unhealthy collector replicas, or unexpectedly low ingest volume. Each alert should have an owner, severity, runbook context, and noise controls.

Dashboards should show received, queued, retried, exported, and dropped telemetry; CPU and memory; queue saturation; backend export errors; health checks; and pipeline latency when available. Optional tracing of the telemetry pipeline can help find bottlenecks, but it should be correlated with metrics, logs, and health signals rather than treated as proof by itself.

9. Design for availability and operations

Gateway collectors should run as multiple replicas with health checks and horizontal scaling. Capacity planning should consider ingest rate, cardinality, batch sizes, tail-sampling state, queue storage, backend throughput, and expected outage duration.

Operational runbooks should cover backend outages, queue saturation, bad configuration rollouts, network partitions, sudden load spikes, and collector capacity loss. Configuration should be versioned, tested, and rolled out safely.

The design should fail gracefully: protect applications and observability backends, preserve important telemetry as long as practical, isolate failures, and make telemetry loss visible.

10. State the tradeoffs

Larger queues tolerate longer outages but consume more memory or disk and can create a large recovery backlog. More gateway replicas improve availability but require correct trace-affinity routing when tail sampling is used. More aggressive sampling lowers ingest cost but can hide rare events and introduce sampling bias. More attributes improve diagnosis but increase cardinality, storage cost, and privacy risk. Persistent queues improve durability across temporary failures but are not unlimited retention.

My final flow is: workloads emit telemetry to nearby agents; agents receive, enrich, redact, batch, and use bounded buffering; signal-aware routing sends telemetry to horizontally scaled gateways; tail-sampled traces use trace-ID affinity; gateways perform heavier enrichment, redaction, sampling, transformation, batching, tenant-aware routing, and fan-out; each backend uses an independent exporter, bounded queue, and bounded retry policy; overload follows an explicit rejection or drop policy; and collector metrics, logs, probes, alerts, and dashboards continuously show the health of the telemetry pipeline.

Technical Approach
  1. Identify required signals, destinations, loss tolerance, privacy requirements, tenant boundaries, and telemetry-pipeline objectives.
  2. Deploy lightweight agent collectors near workloads for OTLP reception, resource enrichment, redaction, lightweight filtering or head sampling, batching, and forwarding.
  3. Deploy multiple gateway collectors for heavier enrichment, transformations, tail sampling, tenant-aware routing, batching, and fan-out.
  4. Use ordinary load balancing for metrics and logs, but route tail-sampled traces with trace-ID affinity so one trace reaches one gateway replica.
  5. Configure memory limits and bounded sending queues; use file_storage-backed persistent queues where outage buffering is required.
  6. Configure bounded retries with exponential backoff and jitter.
  7. Define explicit admission, rejection, filtering, sampling, and drop behavior for sustained overload.
  8. Use independent exporters and queues to isolate destination failures and apply tenant limits where needed.
  9. Redact sensitive data before export and secure the pipeline with TLS or mTLS, least privilege, secrets management, authorization, and network controls.
  10. Define pipeline SLIs and SLOs, then monitor queue utilization, throughput, retries, drops, exporter failures, resource use, and health probes.
  11. Test backend outages, queue exhaustion, gateway loss, network partitions, bad configuration, and load spikes, then verify dashboards and alerts reflect the expected behavior.
Practical Insights

The cost grows mainly with telemetry volume and the amount of processing performed on each item. More telemetry uses more CPU, memory, network bandwidth, disk, and backend capacity. Tail sampling needs gateways to keep trace state until a decision is made, so it consumes more memory than simple forwarding. Larger persistent queues tolerate longer outages but use more disk and can create a recovery backlog. More replicas improve availability but add routing and operational complexity. High-cardinality attributes increase processing, storage, and query cost. The design also needs ongoing capacity planning, configuration testing, alert maintenance, dashboard maintenance, and failure testing.

Why Interviewers Ask This

This question tests whether the candidate can treat the telemetry pipeline as a production system rather than only as a forwarding service. The interviewer is looking for sound judgment about agent and gateway responsibilities, trace-affinity routing for tail sampling, bounded memory and queues, persistent buffering, retries, overload behavior, backend failure isolation, privacy controls, horizontal scaling, and self-observability so failures in the monitoring pipeline are visible.

Common interview mistakes

Common mistakes are sending everything directly to one central collector with no local resilience; using unlimited memory or queues; assuming backpressure always propagates to the original producer; retrying forever; treating a file-backed queue as unlimited durable storage; putting tail sampling behind ordinary random or round-robin routing so spans from one trace reach different gateways; redacting sensitive data only after export; allowing one backend or tenant to consume all collector resources; coupling unrelated destinations through shared failure state; increasing sampling automatically during overload without an explicit policy; ignoring attribute cardinality; and monitoring applications while failing to monitor collector queue saturation, drops, retries, resource use, and export failures.

Interview tip

Draw the answer left to right: telemetry sources to agents, agents through signal-aware routing to gateways, then independent exporters to backends. Explain both the normal path and failure path. Emphasize trace-ID affinity for tail sampling, bounded memory and queues, file-backed persistence, bounded retries, explicit overload behavior, backend isolation, sensitive-data processing, and self-monitoring. State that queue sizes, sampling policies, SLO targets, and retention limits come from measured traffic and business requirements rather than arbitrary numbers.

Interviewer may ask next
How would you keep tail sampling correct when several gateway collectors are running?

I would route every span belonging to the same trace to the same gateway replica by using trace-ID-aware routing, such as consistent hashing by trace ID. The tail sampler on that gateway can then observe the related spans before making its sampling decision. A normal round-robin service alone is not sufficient because spans from one trace may be distributed across different gateways. I would also monitor gateway balance, memory use, trace-processing latency, dropped spans, and routing health, and I would capacity-plan for the state that tail sampling keeps in memory.

What happens if one observability backend is unavailable for a long time?

The affected exporter should first use its bounded sending queue and retry transient failures with exponential backoff and jitter. If persistence is required, the sending queue can use file_storage so queued telemetry survives collector restarts. The queue and disk remain finite, so if the outage lasts long enough to exhaust capacity, the collector must follow the predefined rejection or drop policy instead of consuming unlimited resources. Independent exporters and queues isolate the failed destination so other backends can continue operating. Operators should be alerted on sustained retries, growing queue utilization, export failures, and telemetry drops.

50. How would you detect and close a regional observability blind spot?ObservabilityHard

Question Details

Global dashboards remain green even though one region has stopped exporting telemetry. Design independent checks for telemetry freshness, collector health, regional synthetic probes, ingestion lag, and label completeness. Separate absence of evidence from evidence that the service is healthy.

Short Interview Answer (30-60 seconds)

Monitor each region independently for telemetry freshness, collector health, external synthetic probes, ingestion lag, and required labels. Also watch traffic baselines and dropped data. When a region goes silent, find the first broken hop, correct only that boundary, and verify recovery with several independent signals before declaring it healthy.

Detailed Explanation

A worldwide status page can look normal even when one location has stopped reporting. The other locations may keep the overall picture looking healthy. I would therefore check every expected location separately and use several independent tests. I would check whether recent information is still arriving, whether the local collection process is working, whether an outside test can reach the service, whether information is delayed, and whether identifying details are still present. I would only call the location healthy after these separate checks agree that both the service and its reporting path are working.

Useful Questions to Ask the Interviewer
  1. Do metrics, logs, traces, and profiles use the same regional collector and ingestion path, or are any signals transported independently?
  2. What per-region freshness and ingestion-delay objectives define acceptable observability availability?
  3. Can synthetic probes run from outside every production region so they do not depend on the regional telemetry pipeline?
  4. Which resource attributes are mandatory for regional isolation, such as region, environment, and service?
  5. What regional collector, ingestion-endpoint, and backend redundancy already exists, and which failures should page the owning team?
How would you detect and close a regional observability blind spot? diagram
How to Explain It in an Interview

I would start with one rule: absence of telemetry is not evidence that the service is healthy. A global dashboard can remain green because healthy regions dominate the aggregate while another region has stopped exporting.

First, I would define a regional telemetry-availability SLI, or service-level indicator. The SLI asks whether every expected production region is producing recent, correctly labeled telemetry within an acceptable delay. I would then define an SLO, or service-level objective, for how reliably that condition must hold. Alert thresholds should come from that objective and normal traffic behavior rather than from arbitrary numbers.

The first independent check is telemetry freshness. For each region and expected signal, I would calculate the age of the newest data. Metrics can use a regional last-seen or latest-timestamp query. Logs and traces need equivalent freshness checks in their own backend. The diagram shows an example failure threshold of no regional data for more than five minutes, but the real value should come from the SLO and expected reporting interval.

The second check is regional collector health. Each OpenTelemetry Collector should expose its own health and self-observability signals. I would check process health, exporter success, queue behavior, retries, rejected telemetry, and dropped samples. A collector being healthy proves only that the collection component is operating; it does not prove that the application is healthy or that telemetry reached the backend successfully.

The third check is an outside-in regional synthetic probe. A synthetic probe runs independently from another location and tests whether the regional service is reachable. HTTP, TCP, or DNS probes can help distinguish a service or network failure from a telemetry-only failure. The key design property is independence: the probe must not depend on the same collector or exporter path it is helping validate.

The fourth check is ingestion lag. I would compare when telemetry was observed with when it becomes available in the observability backend. Growing lag can reveal queues, backpressure, throttling, retries, or backend delays even when data has not stopped completely. The diagram uses an example threshold of more than three minutes, but production thresholds should be based on the actual SLO.

The fifth check is label or dimension completeness. Every regional telemetry stream should contain required resource attributes such as region, environment, and service. If Region B loses its region label, the telemetry may still exist but disappear from region-specific dashboards and alerts. I would validate mandatory attributes and monitor cardinality because uncontrolled label values can increase cost and cause ingestion or query problems.

I would also use two supporting checks shown in the diagram. A regional traffic baseline helps distinguish a genuinely idle region from a broken telemetry path. Storage and cardinality protection signals help identify dropped samples, rejected telemetry, or rate limits that can silently remove data.

The collection path should be explicit. Applications, Kubernetes workloads, infrastructure, and other telemetry sources emit telemetry to an independently deployed regional OpenTelemetry Collector. That collector exports toward a per-region ingestion endpoint. The ingestion layer forwards data into multi-region observability backends. Metrics may be stored in Prometheus-compatible systems, logs in Loki, traces in Tempo, and profiles in a profiling backend such as Pyroscope. Synthetic results should also be stored and queried independently. Grafana-style dashboards, Alertmanager-style alerting, and the on-call paging path sit downstream of those signals.

When a regional check fails, I would isolate the fault boundary from left to right: source, collector, ingestion endpoint, backend, then dashboard or alert query. I would find the first point where healthy evidence becomes unhealthy. For example, if external synthetic probes succeed but the Region B collector is unhealthy and fresh telemetry disappears, that suggests an observability-pipeline problem rather than proving an application outage.

I would keep hypotheses separate from confirmed evidence. Possible causes could include a stopped collector, exporter configuration error, resource exhaustion, service-account or credential failure, DNS or network failure, ingestion rejection, throttling, or incorrect labels. I would test the suspected boundary before changing production configuration. No single metric, log, trace, profile, probe, or dashboard proves a root cause by itself.

The correction should have the smallest practical blast radius. If the confirmed failure is only the Region B collector, I would restore or repair that collector rather than changing healthy collectors in other regions. If the failure is at the ingestion endpoint, routing, DNS, credentials, or resource limits, I would change only the confirmed dependency. I would not disable telemetry, remove validation, hide the alert, or assume the service is healthy merely because traffic still succeeds.

Verification must also be regional and independent. I would require telemetry freshness to recover, collector health to be normal, external synthetic probes to succeed, ingestion lag to return to normal, required labels to be complete, expected traffic to appear, and dropped-data signals to remain clear. Only after those checks agree would I trust the recovered global dashboard.

To prevent recurrence, I would keep per-region SLOs and alerts for all independent checks, attach ownership and runbook context to pages, and periodically exercise the detection path by intentionally stopping a controlled regional telemetry exporter. I would also automate collector-health monitoring, required-label validation, ingestion-lag checks, and dropped-data alerts. Telemetry should avoid credentials, tokens, personal data, and sensitive payloads. Retention, sampling, and cardinality should be controlled so the system remains useful and affordable.

Technical Approach
  1. Define a per-region telemetry-availability SLI and SLO before setting alert thresholds.
  2. Evaluate every expected region independently before global aggregation.
  3. Check telemetry freshness for every expected regional signal.
  4. Check each regional collector's process health, exporter success, queues, retries, rejected telemetry, and drops.
  5. Run synthetic probes from outside the region so the health test does not depend on the same telemetry path.
  6. Measure regional ingestion lag from observation time to backend availability.
  7. Validate required labels such as region, environment, and service, and monitor cardinality limits.
  8. Compare regional traffic against its expected baseline and inspect dropped-data or storage-protection signals.
  9. If a check fails, isolate the first failing boundary: source -> collector -> ingestion endpoint -> backend -> dashboard or alert query.
  10. Test the leading hypothesis with correlated evidence before changing production configuration.
  11. Apply the smallest safe correction at the confirmed failing boundary.
  12. Verify freshness, collector health, synthetic success, ingestion lag, label completeness, traffic representation, and no unexpected drops.
  13. Add per-region alerts, SLOs, runbooks, automation, and recurring failure tests to prevent recurrence.
Practical Insights

The main cost is operational rather than algorithmic. Monitoring work grows roughly with the number of regions and signal types because every region needs independent checks. Synthetic probes create extra network requests. Collector self-monitoring creates additional telemetry. Retaining more telemetry improves diagnosis but increases storage cost. High-cardinality labels can greatly increase ingestion, storage, and query cost. Independent checks reduce blind spots, but they also create more alert rules, dashboards, runbooks, tests, and maintenance that the team must own.

Why Interviewers Ask This

This question tests whether a DevOps Engineer understands that missing telemetry can hide a real regional problem while global aggregates remain green. The interviewer is evaluating independent regional monitoring, signal correlation, fault-boundary isolation, actionable alerting, safe remediation, and evidence-based recovery instead of trusting one dashboard or one signal.

Common interview mistakes

Common mistakes include trusting a global green dashboard, treating missing telemetry as proof that the application is down, or treating a healthy collector as proof that the application is healthy. Another mistake is checking freshness only after global aggregation, which lets healthy regions hide a silent one. Teams also create blind spots when synthetic probes depend on the same regional telemetry path, ingestion lag is ignored, mandatory region labels are not validated, or cardinality and dropped-data signals are not monitored. Other mistakes are changing several components before finding the first failing boundary and declaring recovery as soon as the global dashboard turns green.

Interview tip

Lead with the principle that absence of telemetry is not evidence of health. Then describe the five required independent checks, add traffic and dropped-data checks, walk through source -> collector -> ingestion -> backend isolation, and finish by explaining that several independent signals must agree before the region is declared recovered.

Interviewer may ask next
How would you distinguish a telemetry-pipeline failure from a real regional application outage?

I would correlate independent signals. If regional telemetry freshness fails but an outside-in synthetic probe succeeds, I would inspect the collector, exporter, ingestion endpoint, backend rejection signals, and required labels. That pattern suggests the service may still be reachable while the observability path is broken. If both the synthetic probe and telemetry checks fail, the fault may be in the application, network, routing, DNS, or regional infrastructure. I would identify the first failing boundary before declaring the root cause.

How would you prevent healthy regions from hiding a silent region in dashboards and alerts?

I would evaluate the expected region set before global aggregation. Every region would have independent freshness, collector-health, synthetic-probe, ingestion-lag, label-completeness, traffic-baseline, and dropped-data checks. An alert would fire when any expected region is stale, absent, or unhealthy even if the global aggregate remains normal. Global dashboards would remain useful summaries, but they would not override failed regional checks. I would also regularly test the mechanism by stopping a controlled regional exporter and confirming that the regional alert fires and the runbook leads operators to the correct boundary.

More questions load as you scroll

Disclaimer: This interview guide is for educational and informational purposes only. It is designed to help readers prepare, but it does not guarantee any interview result, hiring decision, offer, or outcome. Interview questions, hiring criteria, and preferred answers can vary by employer, interviewer, industry, location, and time. The examples and explanations reflect the authors' research and judgment, are provided without warranties of any kind, and should not be treated as the only correct approach. Diagrams are simplified illustrations intended to highlight the main components and their interactions; actual systems and implementations may be more complex. Alternative approaches may be equally valid or better suited to a particular question, context, or interviewer. To the fullest extent permitted by applicable law, the author, contributors, and publisher are not liable for decisions made, actions taken, or losses incurred based on this guide.

Content Accuracy and Verification: To the fullest extent permitted by applicable law, we do not represent or warrant that interview guides, questions, answers, examples, or diagrams are accurate, complete, current, error-free, or suitable for any particular purpose. You are responsible for independently reviewing and verifying the information before relying on it.