189 DevOps Engineer Interview Questions & Answers

105 top • 14 Amazon • 12 Apple • 15 Google • 9 Meta • 14 Microsoft • 8 Netflix • 12 NVIDIA

DevOps Engineer icon

Questions with Detailed ExplanationsWith Detailed Explanations

(Last Updated: September 1, 2026)

51. What is incident response, and how does it differ from routine troubleshooting?Incident Response And TroubleshootingEasy

Question Details

A production service is causing material customer impact and requires coordinated action across several teams. Explain when the work should become a managed incident rather than remain an individual debugging task. Cover declaration, command and communication roles, impact-based prioritization, containment, mitigation, recovery verification, evidence preservation, handoff to root-cause analysis, and the conditions for closing the incident.

Short Interview Answer (30-60 seconds)

Routine troubleshooting is usually a small, low-impact issue handled by one person or team. Incident response is a coordinated process for material customer impact: declare the incident, assign severity and roles, contain harm, mitigate, verify recovery, preserve evidence, communicate, hand off to RCA, and close only when recovery is confirmed.

Detailed Explanation

A production problem should become a managed incident when it is causing meaningful customer impact, putting important service commitments at risk, affecting multiple customers or regions, requiring several teams to coordinate, or needing formal communication and prioritization. The goal is no longer only to debug the problem. The team must organize the response, reduce further harm, restore acceptable service, verify that recovery is real, preserve what happened, keep stakeholders informed, and prepare the information needed to understand the deeper cause later. Small, local, low-impact problems can normally stay as routine troubleshooting.

Useful Questions to Ask the Interviewer
  1. What level of customer impact or service risk causes your organization to declare a managed incident?
  2. Do you use a severity model such as P1 through P4, and who can change the severity?
  3. Which incident roles do you normally assign, such as Incident Commander, Scribe, Liaison, and Communications Lead?
  4. What recovery checks and closing conditions are required before an incident can be closed?
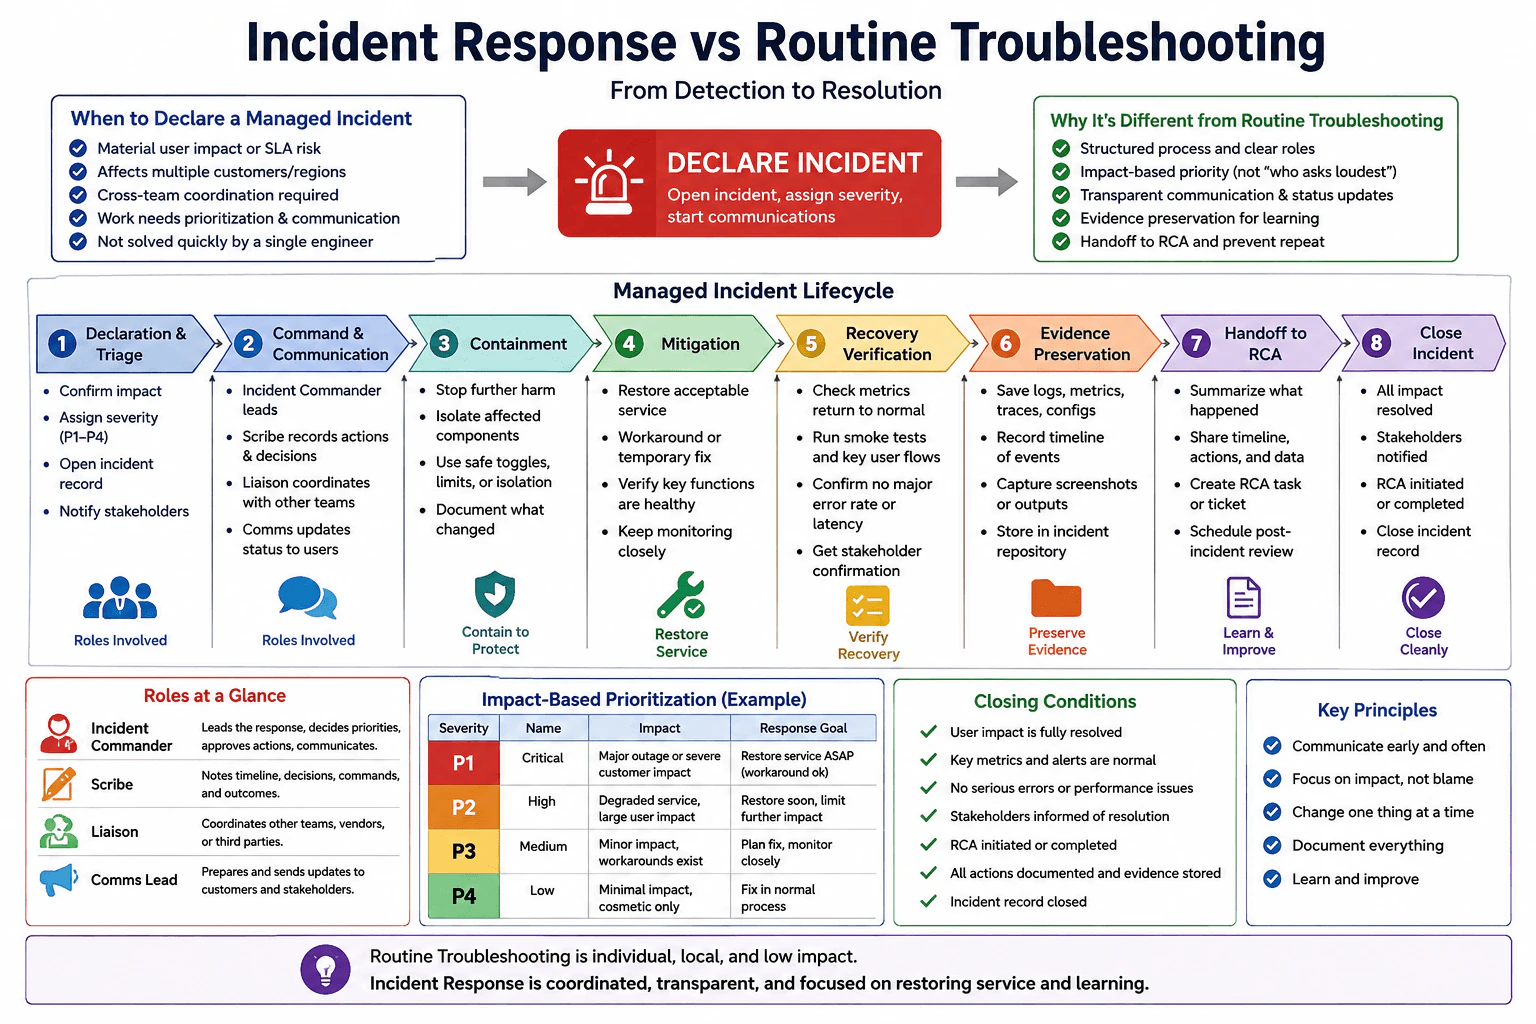
What is incident response, and how does it differ from routine troubleshooting? diagram
How to Explain It in an Interview
1. Decide whether this is routine troubleshooting or a managed incident

I would start with impact. Routine troubleshooting is appropriate when the issue is local, low impact, owned by one person or team, and can be handled through the normal engineering process without broad coordination or stakeholder communication.

I would move to a managed incident when there is material customer impact or SLA risk, multiple customers or regions are affected, cross-team coordination is required, prioritization and communication must be formalized, or the issue cannot be resolved quickly by a single engineer.

2. Declare the incident and assign severity

Once the threshold is met, I would declare the incident, open the incident record, assign severity, and notify the required stakeholders. Severity should be based on impact, not on who is asking the loudest.

A common example is P1 for critical impact or a major outage, P2 for high-impact degradation, P3 for medium impact where workarounds may exist, and P4 for minimal impact handled through normal operations. The exact labels vary by organization, but the decision should remain impact based.

3. Establish command and communication roles

The Incident Commander leads the response, decides priorities, approves major actions, and keeps the work coordinated. The Scribe records the timeline, decisions, commands, actions, and outcomes. The Liaison coordinates with other teams, vendors, or third parties. The Communications Lead prepares and sends updates to customers and other stakeholders.

This prevents conflicting changes and duplicated work. Observed facts, hypotheses, actions, owners, timestamps, and outcomes should be recorded separately.

4. Contain further harm

Containment is about stopping the problem from spreading or becoming worse. That may mean isolating an affected component, limiting blast radius, or using a safe control such as a feature toggle or traffic limit.

Any state-changing action should have a clear owner, expected result, success criteria, and rollback condition. I would prefer small and reversible actions. I would not restart, scale, fail over, roll back, edit production, or disable controls as a reflex because those actions can remove evidence or make the incident worse.

5. Mitigate and restore acceptable service

Mitigation is the action that reduces customer impact. It can be a workaround or temporary fix. The goal is to restore acceptable service safely, not necessarily to prove the final root cause during the incident.

After each mitigation, I would verify whether key functions are healthy and continue monitoring closely. If the action does not meet its success criteria or makes the situation worse, I would roll it back or choose another controlled option.

6. Verify recovery

Recovery verification must prove that service is actually healthy. I would check that important metrics have returned to normal, smoke tests and key user flows pass, and there is no major remaining error rate, latency issue, or other serious degradation.

I would continue monitoring long enough to confirm stability before announcing that the service is recovered.

7. Preserve evidence

During the response, I would preserve relevant logs, metrics, traces, configuration evidence, screenshots or outputs, and the incident timeline. The incident record should capture what was observed, what changed, who performed each action, and what result followed.

Evidence should be stored in an approved location without exposing secrets or unnecessary customer data. This matters because containment and mitigation can change the system and remove information that will later be needed for analysis.

8. Hand off to root-cause analysis

Mitigation and root cause are different. Mitigation answers, 'How did we reduce customer impact and restore service?' Root-cause analysis asks, 'Why was this failure possible, and how do we prevent it from happening again?'

After recovery, I would summarize the impact, timeline, actions, evidence, mitigations, and unresolved questions. I would create or hand off the RCA work and schedule the appropriate blameless post-incident review. Corrective actions should have owners and measurable completion criteria.

9. Close only when the closing conditions are satisfied

I would close the incident when customer impact is fully resolved, key metrics and alerts are normal, no serious errors or performance problems remain, stakeholders have been informed of the resolution, important actions and evidence are documented, and the required RCA or post-incident work has been initiated or completed according to the organization's process.

The key difference is that routine troubleshooting is usually individual, local, and low impact. Incident response is coordinated, transparent, impact focused, and designed first to restore service safely and then to learn from the event.

Technical Approach
  1. Confirm impact and blast radius.
  2. Decide whether the issue meets the managed-incident threshold.
  3. Declare the incident and assign impact-based severity.
  4. Open the incident record and communication channel.
  5. Assign the Incident Commander, Scribe, Liaison, Communications Lead, and other required owners.
  6. Record observed facts, hypotheses, actions, timestamps, and outcomes separately.
  7. Contain further harm with the smallest safe and preferably reversible action.
  8. Mitigate customer impact and restore acceptable service.
  9. Verify recovery with metrics, alerts, smoke tests, key user flows, error signals, latency, and stability monitoring.
  10. Preserve logs, metrics, traces, configurations, outputs, and the timeline without exposing secrets or customer data.
  11. Hand the evidence and timeline to root-cause analysis and assign corrective actions.
  12. Close only when impact is resolved, recovery is verified, stakeholders are informed, evidence is stored, and required follow-up work is initiated.
Practical Insights

Incident response costs more than routine troubleshooting because several people may stop normal work, communication must be coordinated, and evidence must be recorded carefully. That extra operational cost is justified when customer impact is material because uncoordinated debugging can delay recovery or increase the blast radius. The process also creates logs, metrics, traces, timelines, and incident records that must be stored and maintained. Using the full incident process for every small issue would waste time, so low-impact problems should normally remain routine troubleshooting.

Why Interviewers Ask This

Interviewers want to know whether I can recognize when normal debugging must become coordinated incident management. They are testing whether I can prioritize by customer impact, establish clear ownership and communication, contain harm, restore service safely, verify recovery, preserve evidence, distinguish mitigation from root cause, and close the incident only after the required recovery and follow-up conditions are satisfied.

Common interview mistakes

Common mistakes include treating a major outage as an individual debugging task; assigning severity based on technical difficulty instead of impact; allowing multiple engineers to make unrelated production changes without an Incident Commander; failing to record decisions, actions, and timestamps; confusing a hypothesis with confirmed evidence; restarting, scaling, failing over, rolling back, or disabling controls reflexively; making large irreversible changes without success and rollback criteria; focusing on root cause while customers are still affected; assuming recovery after a single successful change without checking metrics and key user flows; losing evidence during mitigation; exposing secrets or customer data in incident records; giving inconsistent stakeholder updates; treating a workaround as the permanent fix; and closing the incident before customer impact, recovery validation, communication, documentation, and follow-up conditions are satisfied.

Interview tip

Start with the decision boundary: material customer impact, SLA risk, or cross-team coordination turns routine debugging into a managed incident. Then explain one clear flow: declare, assign severity and roles, contain, mitigate, verify recovery, preserve evidence, hand off to RCA, and close only after explicit closing conditions are met.
Interviewer may ask next
What would you do if the service is restored but the root cause is still unknown?

If customer impact is resolved, the service is stable, recovery checks pass, stakeholders are informed, and the organization's other closing conditions are satisfied, I would not keep the active incident open only because the root cause is still unknown. I would preserve the evidence and timeline, document that the cause is unresolved, create an owned RCA task, schedule the appropriate blameless review, and continue any extra monitoring justified by the risk. If customer impact returns, I would reopen or redeclare the incident according to the organization's process.

How do you balance fast recovery with the risk of making another production change during an incident?

I would prefer the smallest reversible action that can reduce customer impact. Before changing production, I would state the expected result, success criteria, risk, owner, and rollback condition. The Incident Commander should coordinate the action so other responders do not make conflicting changes. I would record the change and verify the result with metrics and key user flows. Fast recovery should come from clear coordination and safe incremental mitigation, not from skipping safeguards.

52. How would you triage a Kubernetes Pod that cannot be scheduled?Incident Response And TroubleshootingEasy

Question Details

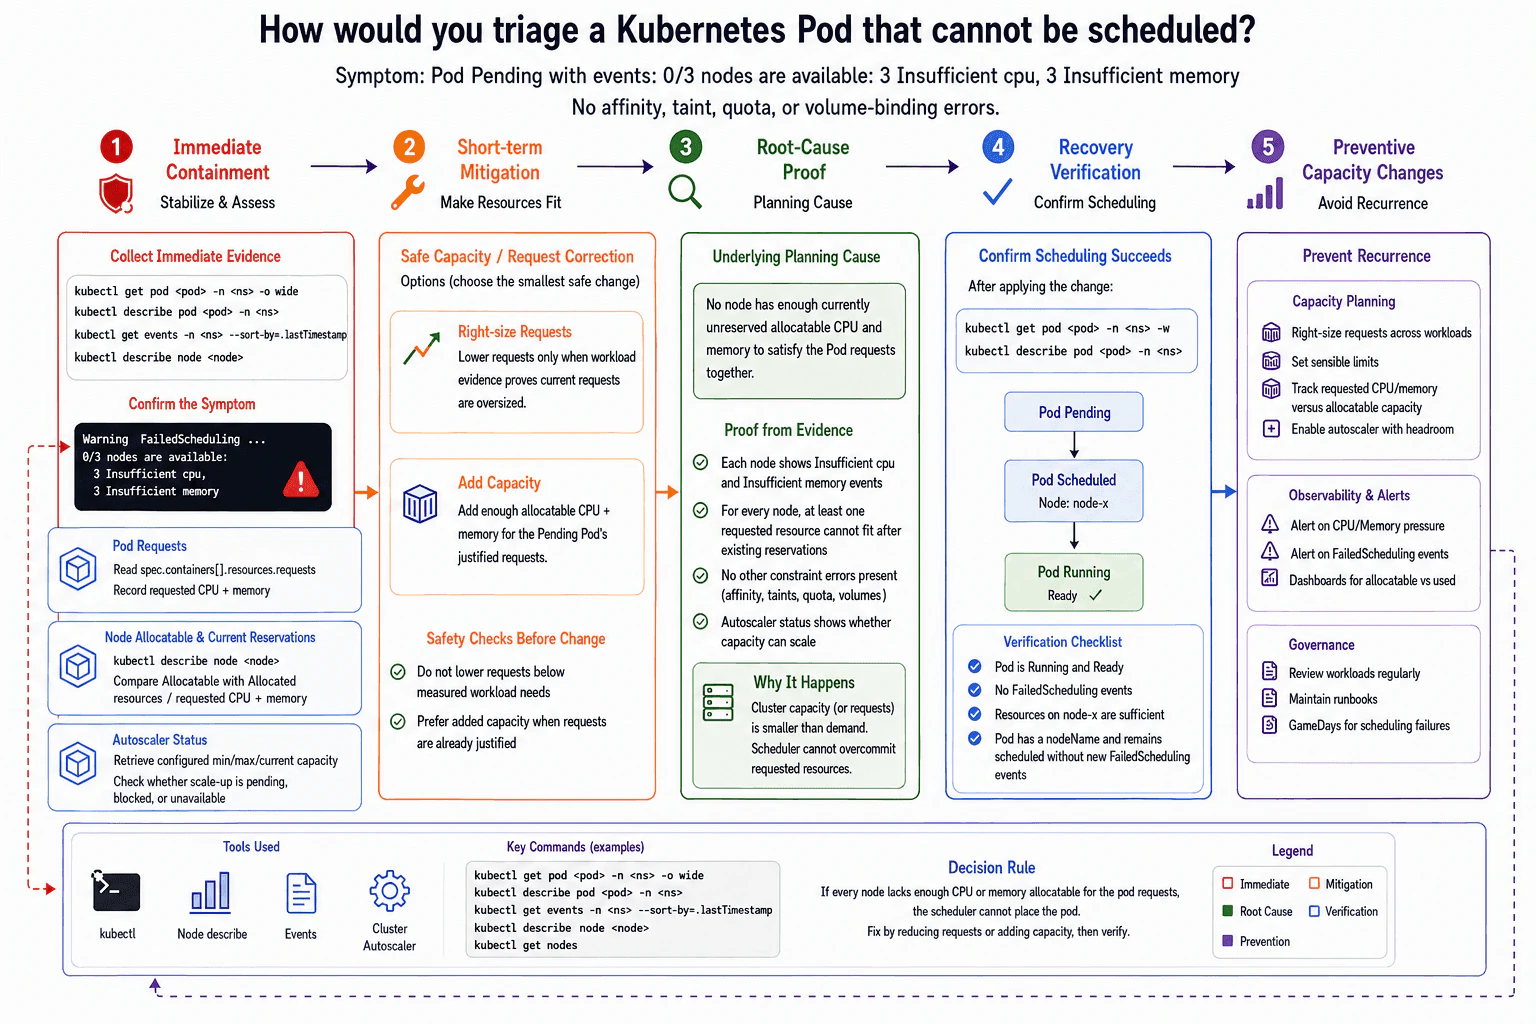
The Pod remains Pending. Its event stream contains 0/3 nodes are available: 3 Insufficient cpu, 3 Insufficient memory; there are no affinity, taint, quota, or volume-binding errors. Use only this evidence and the Pod requests, node allocatable values, current node reservations, and autoscaler status you would retrieve. Distinguish immediate containment, a safe capacity or request correction, confirmation that scheduling succeeds, the underlying planning cause, and a prevention step. Label immediate containment, short-term mitigation, root-cause proof, recovery verification, and preventive capacity changes as five separate parts.

Short Interview Answer (30-60 seconds)

I would confirm the FailedScheduling evidence, compare the Pod requests with each node's allocatable resources and current reservations, and check autoscaler status. Then I would add justified capacity or carefully reduce proven oversized requests, verify the Pod schedules successfully, and prevent recurrence with better capacity planning.

Detailed Explanation

See the Code while reading this explanation.

A task is waiting because none of the three available machines currently has enough room for it. The interviewer wants to know whether I can collect facts before changing anything, understand how much room the task needs, compare that need with what each machine can still provide, and choose the safest correction. I also need to show that I can confirm the task starts afterward, explain why the team ran out of room, communicate clearly during the problem, and put controls in place so the same shortage is less likely to happen again.

Useful Questions to Ask the Interviewer
  1. Are the current CPU and memory requests already known to be justified, or should I determine whether they are oversized?
  2. Is an autoscaler enabled, and what status information is available for its current minimum, maximum, and scale-up state?
  3. Am I allowed to add capacity if the requests are justified?
  4. Do we already have the current node allocatable and allocated-resource data, or should I retrieve it during triage?
How would you triage a Kubernetes Pod that cannot be scheduled? diagram
How to Explain It in an Interview

I would handle this in five separate parts and keep mitigation separate from root cause.

1. Immediate containment

The observed facts are specific: the Pod is Pending; its event stream says 0/3 nodes are available: 3 Insufficient cpu, 3 Insufficient memory; and there are no affinity, taint, quota, or volume-binding errors. I would not restart the Pod or change production settings as a reflex because that would not address the evidence.

I would establish the incident basics first: severity based on user or service impact, blast radius based on which workload is blocked, one incident owner, a communication channel if the impact warrants it, and a timestamped action log. I would preserve the current Pod events and configuration and record any recent workload or capacity changes without assuming they caused the problem.

2. Short-term mitigation

I would gather only the evidence needed for the scheduling decision:

  • the Pod's requested CPU and memory from spec.containers[].resources.requests
  • each node's Allocatable CPU and memory
  • each node's current allocated requests, which represent scheduler reservations
  • autoscaler status, including whether additional capacity can be added

Then I would choose the smallest safe correction.

If workload evidence proves the requests are oversized, I can lower them carefully. I would not lower requests below what the workload actually needs. The success criterion is that the corrected requests fit safely and the Pod schedules; rollback is restoring the previous request values if the change causes instability or violates the workload's known requirements.

If the requests are already justified, I would prefer adding capacity. The new capacity must provide enough allocatable CPU and memory for the Pending Pod's requests. Before changing capacity, I would confirm the autoscaler or node-capacity path is allowed and understand how to reverse any manual temporary capacity increase after the incident if it is no longer needed.

3. Root-cause proof

I would compare the Pod's requests with every node's remaining schedulable capacity. Kubernetes Allocatable is the portion of a node's resources available to Pods. The Allocated resources section in kubectl describe node shows resources already requested by existing Pods.

The proof is: for every candidate node, at least one requested resource cannot fit after existing reservations. That matches the scheduler events. Because the question explicitly excludes affinity, taints, quota, and volume binding, I would not keep investigating those paths unless new evidence appeared.

I would also use the retrieved autoscaler status to determine whether capacity could scale. I would not claim that the autoscaler was blocked, at a maximum, or malfunctioning unless its actual status proved that.

The underlying planning cause is insufficient usable cluster headroom for the Pod's justified resource requests, or requests that were larger than justified. The scheduler itself is not the root cause; it is correctly refusing a placement that cannot satisfy the requested resources.

4. Recovery verification

After the correction, I would watch the Pod. Recovery means it leaves Pending, receives a nodeName, and remains scheduled without new FailedScheduling events. I would also confirm that the selected node now has enough allocatable capacity for the requests.

I would keep monitoring long enough to make sure the scheduling failure does not immediately return. I would record the recovery time, the exact change made, and the evidence that proved success, then update stakeholders that scheduling has recovered.

5. Preventive capacity changes

I would prevent recurrence by tracking requested CPU and memory against cluster allocatable capacity, maintaining appropriate headroom, reviewing workload requests regularly, configuring the autoscaler with safe capacity limits, and alerting on repeated FailedScheduling events or high requested-versus-allocatable pressure.

After the incident, I would run a blameless review. Corrective actions should have owners and measurable outcomes, such as a defined headroom target, a request-review process, autoscaler alerts, and a runbook for scheduling-capacity failures.

The practical decision is simple: use the scheduler event as the starting fact, prove whether the Pod can fit on any node using requests, allocatable resources, and current reservations, check whether autoscaling can supply capacity, make the smallest safe correction, and verify that scheduling actually recovers.

Key Insight / Why This Solution Works
  1. Confirm the Pod is Pending and preserve the exact FailedScheduling event.
  2. Establish severity, blast radius, ownership, communication needs, and a timestamped action log.
  3. Read the Pod's CPU and memory requests.
  4. Retrieve each node's allocatable CPU and memory and current allocated requests.
  5. Retrieve autoscaler status without assuming why it did or did not scale.
  6. For every node, compare the Pod requests with remaining schedulable capacity after existing reservations.
  7. If the requests are justified and cannot fit, add enough capacity through the approved capacity path.
  8. If evidence proves the requests are oversized, reduce them carefully with explicit success and rollback criteria.
  9. Verify the Pod receives a node assignment and no new FailedScheduling events appear.
  10. Record the planning cause and add measurable prevention: request reviews, capacity headroom, autoscaling guardrails, alerts, and an owned runbook.
Code
# READ-ONLY: Confirm the Pod state and whether a node has been assigned.
# Scope: only the named Pod and namespace. Expected evidence: STATUS is Pending and NODE may be empty.
# Safety: this does not change the Pod. Rollback: none is required for a read-only command.
import subprocess

subprocess.run(["kubectl", "get", "pod", "<pod>", "-n", "<namespace>", "-o", "wide"], check=False)

# READ-ONLY: Preserve the scheduler evidence attached to this Pod.
# Expected evidence: FailedScheduling with "0/3 nodes are available", "Insufficient cpu", and "Insufficient memory".
# Safety: no production state is changed. Rollback: none is required.
subprocess.run(["kubectl", "describe", "pod", "<pod>", "-n", "<namespace>"], check=False)

# READ-ONLY: Retrieve the Pod specification so the requested CPU and memory can be recorded.
# Inspect spec.containers[].resources.requests; these requests are what the scheduler must satisfy.
# Safety: this only reads configuration. Rollback: none is required.
subprocess.run(["kubectl", "get", "pod", "<pod>", "-n", "<namespace>", "-o", "yaml"], check=False)

# READ-ONLY: Preserve the recent namespace event sequence before making any mitigation.
# Expected evidence: the same scheduling failure remains the current relevant signal.
# Safety: events may contain operational context, so do not copy sensitive data into public channels.
# Rollback: none is required.
subprocess.run(
    ["kubectl", "get", "events", "-n", "<namespace>", "--sort-by=.lastTimestamp"], check=False
)

# READ-ONLY: List the candidate nodes before inspecting their capacity.
# Expected evidence: the three nodes referenced by the scheduler can be identified.
# Safety: no cluster state is changed. Rollback: none is required.
subprocess.run(["kubectl", "get", "nodes"], check=False)

# READ-ONLY: For each candidate node, inspect "Allocatable" and "Allocated resources".
# Reasoning: compare the Pod requests with allocatable capacity remaining after existing requested reservations.
# Expected evidence: on every node, at least one requested resource cannot fit.
# Safety: no node state is changed. Rollback: none is required.
subprocess.run(["kubectl", "describe", "node", "<node-1>"], check=False)
subprocess.run(["kubectl", "describe", "node", "<node-2>"], check=False)
subprocess.run(["kubectl", "describe", "node", "<node-3>"], check=False)

# READ-ONLY: Discover whether a Cluster Autoscaler deployment is present in kube-system.
# Do not assume the autoscaler exists or is blocked; use the returned status as evidence.
# Safety: this only lists deployments. Rollback: none is required.
subprocess.run(["kubectl", "-n", "kube-system", "get", "deployments"], check=False)

# READ-ONLY, ONLY IF a deployment named cluster-autoscaler is present above:
# Retrieve its current Kubernetes status and configuration-facing details.
# Expected evidence: whether the autoscaler workload is available; do not infer provider limits without supporting status or logs.
# Safety: no autoscaler state is changed. Rollback: none is required.
subprocess.run(
    ["kubectl", "-n", "kube-system", "describe", "deployment", "cluster-autoscaler"], check=False
)

# READ-ONLY, ONLY IF that Cluster Autoscaler deployment exists and more status evidence is needed:
# Review recent autoscaler messages for scale-up decisions or constraints actually reported by the autoscaler.
# Safety: logs may contain infrastructure identifiers, so keep them inside the incident channel and redact sensitive values if shared.
# Rollback: none is required because this is read-only.
subprocess.run(
    ["kubectl", "-n", "kube-system", "logs", "deployment/cluster-autoscaler", "--tail=100"],
    check=False,
)

# RECOVERY VERIFICATION, READ-ONLY: After the approved mitigation is performed, watch for scheduling success.
# Success criteria: the Pod leaves Pending, receives a NODE, and remains scheduled.
# Safety: watching does not change the Pod. Rollback: none is required.
subprocess.run(["kubectl", "get", "pod", "<pod>", "-n", "<namespace>", "-w"], check=False)

# RECOVERY VERIFICATION, READ-ONLY: Re-check events after recovery.
# Success criterion: no new FailedScheduling events are being generated for the Pod.
# Safety: this only reads evidence. Rollback: none is required.
subprocess.run(["kubectl", "describe", "pod", "<pod>", "-n", "<namespace>"], check=False)
Why Interviewers Ask This

This question tests whether the candidate can use Kubernetes scheduling evidence instead of guessing, distinguish mitigation from root cause, make a safe and reversible capacity decision, verify recovery, communicate during an incident, and convert a scheduling failure into concrete capacity-planning prevention.

Common interview mistakes

Common mistakes are restarting the Pod even though placement capacity is the problem, looking only at current CPU or memory usage instead of scheduler requests and reservations, lowering requests without evidence, assuming autoscaler behavior without checking its status, treating the scheduler as broken when it is correctly enforcing requests, investigating affinity or taints even though the supplied evidence excludes them, declaring recovery before the Pod receives a node assignment, and failing to add prevention after service restoration.

Interview tip

Structure the answer using the five labels from the question: immediate containment, short-term mitigation, root-cause proof, recovery verification, and preventive capacity changes. State the scheduler event first, explain exactly what evidence proves capacity cannot fit the Pod, and keep mitigation separate from the planning root cause.

Interviewer may ask next
What would you do if the autoscaler is enabled but the Pod still remains Pending?

I would use the autoscaler's actual status and recent messages as evidence rather than guessing. I would check whether it is attempting a scale-up, whether its configured capacity range permits more nodes, and whether it reports a concrete constraint. If the Pod's requests are justified and autoscaling cannot supply capacity in time, I would use the approved manual capacity path with explicit success and rollback criteria, then verify that the Pod receives a node assignment and no new FailedScheduling events appear.

When is reducing the Pod's requests safer than adding capacity?

Only when workload evidence proves the existing CPU or memory requests are oversized. I would lower them incrementally and never below the workload's justified needs. The success criterion is that the Pod schedules and remains stable. If the requests are already justified, reducing them would hide the real capacity shortage, so adding enough allocatable capacity is the safer correction.

53. How would you troubleshoot a Pod in CrashLoopBackOff?Incident Response And TroubleshootingEasy

Question Details

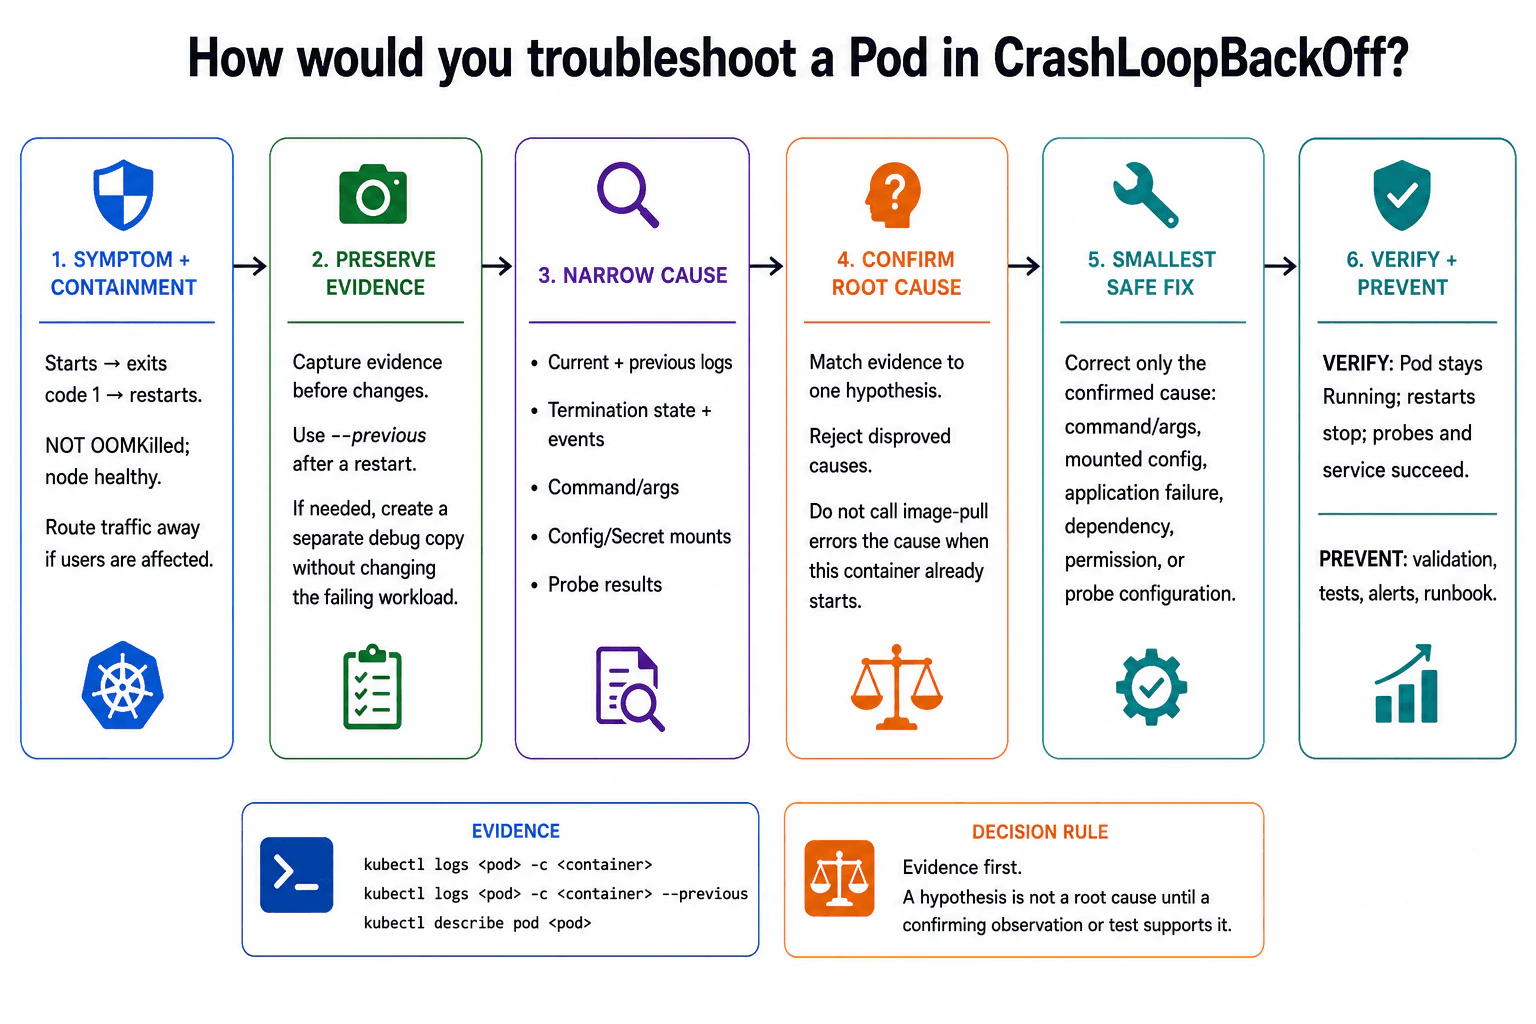
The container starts, exits with code 1, and is restarted; the Pod is not OOMKilled and no node disruption is reported. Explain how current and previous container logs, termination state, events, command and arguments, mounted configuration, and probe results narrow the cause. Keep service containment, restart-loop mitigation, root-cause confirmation, recovery validation, and recurrence prevention distinct. Present service containment, temporary mitigation, confirmed root cause, verification of normal operation, and prevention as distinct decisions.

Short Interview Answer (30-60 seconds)

Protect users and preserve evidence first. Compare current and previous logs, termination state, events, command and arguments, mounted configuration, and probes. Confirm one hypothesis with evidence, make the smallest safe correction, then verify the Pod stays Running, restarts stop increasing, probes succeed, and service behavior is normal.

Detailed Explanation

See the Code while reading this explanation.

A program is starting, stopping with an error, and being started again over and over. I would first protect people using the service and save the information left by the failed runs. I would check what happened just before each stop, what the program was told to start with, whether the files and settings it needs are available, and whether automatic checks are stopping it. I would not guess. I would prove one cause, change only that cause, confirm normal service, and then add safeguards so the same problem is less likely to happen again.

Useful Questions to Ask the Interviewer
  1. Is only one Pod affected, or are all replicas of the workload restarting?
  2. Did a deployment, configuration, Secret, ConfigMap, command, probe, or dependency change just before the issue started?
  3. Is user traffic currently affected, and can the failing replica be removed from the serving path safely?
  4. Which container in the Pod is restarting if the Pod has more than one container?
  5. Is creating a separate debug copy allowed if the restart loop makes inspection difficult?
How would you troubleshoot a Pod in CrashLoopBackOff? diagram
How to Explain It in an Interview

I would use six separate decisions, matching the troubleshooting flow in the diagram.

1. Symptom and containment

The known facts are that the container starts, exits with code 1, and is restarted. It is not OOMKilled, and no node disruption is reported. I first determine the blast radius and user impact. If users are affected, I route traffic away from the failing replica or otherwise remove it from the serving path using the existing safe mechanism. This is containment only; it does not prove the root cause.

I also establish incident ownership, severity, a communication channel, and a timestamped action log when the impact requires an active incident response. I record recent changes without assuming that the newest change must be the cause.

2. Preserve evidence

I collect evidence before changing the failing workload. Current logs show the latest container attempt. Previous logs from kubectl logs ... --previous show output from the immediately preceding terminated instance, which is especially useful when a container exits quickly.

If the restart loop makes investigation difficult, I prefer a separate debug copy or another non-destructive diagnostic method rather than changing the failing workload just to make it easier to inspect. I do not reflexively scale to zero, alter the restart behavior, weaken probes, or repeatedly restart the Pod because those actions can remove evidence or hide the failure.

3. Narrow the cause

I correlate several evidence sources in a fixed order:

  1. Current and previous logs: look for the last useful application or startup message before exit. Logs are evidence, not proof by themselves, and sensitive values must be protected.
  2. Termination state: inspect the current and last container state for reason, exit code, signal, and timestamps. Exit code 1 tells me the process reported failure, but not why.
  3. Events: look for restart back-off, probe failures, mount failures, scheduling or runtime warnings, and their timing.
  4. Command and arguments: verify the configured executable, entrypoint override, arguments, paths, and expected values.
  5. Mounted configuration: verify required ConfigMap and Secret references, mount paths, expected keys, environment references, file names, and permissions without exposing secret values.
  6. Probe results: inspect startup, liveness, and readiness probe configuration and related events. A failed startup or liveness probe can cause container restarts. A readiness failure normally marks the Pod unready and removes it from service rather than restarting the container.
4. Confirm the root cause

I form a small number of hypotheses and test them against the evidence. I reject a hypothesis when the evidence disproves it.

Because the container is already starting, an image-pull failure does not explain this CrashLoopBackOff. Because the Pod is not OOMKilled and no node disruption is reported, memory-kill and node-disruption explanations are lower-priority for this exact scenario. Exit code 1 can still result from a bad command or argument, missing or invalid mounted configuration, an application startup failure, dependency failure, permission problem, or another process-level error.

I call the root cause confirmed only when a log, termination state, event, configuration check, probe result, or controlled test supports the same explanation. A hypothesis is not a root cause merely because it sounds plausible.

5. Apply the smallest safe correction

I correct only the confirmed cause. Examples include correcting command or arguments, restoring expected mounted configuration, repairing an application startup failure, restoring a required dependency, correcting a permission problem, or correcting a misconfigured probe.

Any production change should be reversible and have explicit success and rollback criteria. If a broader rollback is the safest way to restore service, I still describe it as mitigation unless the rollback itself proves the root cause. Service restoration and root-cause confirmation remain separate decisions.

6. Verify and prevent

I do not stop after seeing one successful start. I verify that the Pod remains Running, the restart count stops increasing, the appropriate probes succeed, readiness is healthy, logs no longer show the failure, and the service works through its normal user path. I monitor long enough to cover the previous failure pattern and communicate the recovery result to stakeholders.

After recovery, I add prevention that matches the confirmed cause: configuration or startup validation, tests, safer defaults, alerts on restart growth or probe failures, and an updated runbook. I then document the incident in a blameless review with corrective actions, owners, and measurable follow-up.

Technical Approach
  1. Confirm the restarting container, exact symptom, blast radius, user impact, and recent changes.
  2. Contain user impact without destroying evidence.
  3. Preserve current and previous container logs before making changes.
  4. Inspect termination state and Pod events and correlate their timestamps.
  5. Verify command and arguments, mounted ConfigMap/Secret configuration, environment references, paths, permissions, and probe results.
  6. Form a small set of hypotheses and reject any contradicted by the evidence.
  7. Confirm one root cause with a supporting observation or controlled test.
  8. Apply only the smallest safe, reversible correction with success and rollback criteria.
  9. Verify the Pod stays Running, restart count stops increasing, probes and readiness recover, logs are clean of the failure, and service behavior is normal.
  10. Monitor, communicate recovery, document the incident, and add targeted prevention.
Practical Insights

The main cost is investigation time and the amount of evidence to review, not algorithmic CPU or memory complexity. Pod state and events are small and quick to inspect. Logs can be larger and may take more time and network traffic to retrieve. A separate debug copy temporarily uses cluster resources, but it can preserve the original evidence. The largest operational risk is changing production before the cause is known, so read-only checks come first. Prevention adds some maintenance work for tests, validation, alerts, and runbooks, but reduces future incident time.

Code
import subprocess

# Set the investigation scope explicitly so every command targets only the affected Pod and container.
# Safety: all commands below are read-only; they do not restart, scale, edit, or delete resources, so no rollback is needed.
NS = "<namespace>"
POD = "<pod>"
CONTAINER = "<container>"

# Collect current-container evidence from the latest attempt.
# Expected: recent startup/application messages that may narrow the failure; protect sensitive values in any shared output.
subprocess.run(
    ["kubectl", "-n", NS, "logs", POD, "-c", CONTAINER, "--tail=200"],
    check=True,
)

# Collect the immediately previous terminated container logs before later restarts replace the most useful context.
# Expected: messages emitted before the prior exit; treat them as evidence to correlate with state and events, not proof by themselves.
subprocess.run(
    [
        "kubectl",
        "-n",
        NS,
        "logs",
        POD,
        "-c",
        CONTAINER,
        "--previous",
        "--tail=200",
    ],
    check=True,
)

# Inspect termination state, exit code, timestamps, events, command/args, mounts, environment references, and probe configuration.
# Expected: Last State/Reason/Exit Code plus relevant warnings such as probe or mount failures; do not expose Secret values.
subprocess.run(
    ["kubectl", "-n", NS, "describe", "pod", POD],
    check=True,
)

# After the confirmed correction, verify status and restart count without changing the workload.
# Success: the Pod stays Running/Ready and the restart count remains stable during the observation window.
subprocess.run(
    ["kubectl", "-n", NS, "get", "pod", POD, "-o", "wide"],
    check=True,
)
Why Interviewers Ask This

This question tests whether a candidate can troubleshoot a Kubernetes restart loop systematically instead of guessing or changing production too early. A strong answer separates containment, evidence preservation, diagnosis, root-cause confirmation, correction, recovery validation, communication, and prevention. It also tests whether the candidate understands what current and previous logs, termination state, events, command and arguments, mounted configuration, and probe results can prove or disprove.

Common interview mistakes

Common mistakes are restarting or scaling immediately and losing evidence; reading only current logs and forgetting --previous; treating exit code 1 as the root cause instead of a symptom; ignoring Last State and event timestamps; exposing Secret values while checking configuration; assuming every probe failure restarts a container; blaming image pulling even though the container already starts; weakening probes to hide an application problem; changing several things at once; treating a broad rollback as proof of root cause; declaring success after one clean start; and closing the incident without service validation, stakeholder communication, or prevention work.

Interview tip

Present the answer as six decisions: contain impact, preserve evidence, narrow the cause, confirm one hypothesis, make the smallest safe correction, then verify and prevent. Explain what each evidence source tells you and what it does not prove. That demonstrates disciplined incident response rather than command memorization.

Interviewer may ask next
What would you do if the current logs are empty because the container exits too quickly?

I would immediately check kubectl logs <pod> -c <container> --previous because it can show output from the immediately preceding terminated container instance. I would then use kubectl describe pod <pod> to inspect Last State, reason, exit code, timestamps, events, command and arguments, mounts, environment references, and probes. If the loop still prevents useful inspection, I would use a separate debug copy or another non-destructive diagnostic method instead of mutating the failing Pod. I would preserve evidence and confirm the cause before changing production.

How do you distinguish a probe-caused restart from an application that is already failing on its own?

I would correlate probe-failure events with termination timing and application logs. Startup and liveness probe failures can cause Kubernetes to restart a container, while readiness probe failures normally make the Pod unready without restarting the container. If the process exits with code 1 before Kubernetes kills it for a failed startup or liveness probe, I would investigate the process failure first. I would change probe settings only when evidence shows the probe itself is misconfigured, then verify stable restart count, healthy probes, readiness, and normal service behavior.

54. How would you diagnose an ImagePullBackOff after a deployment?Incident Response And TroubleshootingEasy

Question Details

New Pods cannot start and show ImagePullBackOff; existing replicas remain healthy. The image reference, registry endpoint, image-pull secret name, service account, node network path, and Pod events are available, but registry credentials must not be printed. Describe how you preserve service, determine whether the image, authentication, authorization, or connectivity is at fault, restore the rollout, verify pulls on affected nodes, and prevent repetition. Keep exposure containment, pull-restoration mitigation, root-cause evidence, recovery verification, and recurrence prevention separate.

Short Interview Answer (30-60 seconds)

I would preserve the healthy replicas, inspect Pod events and deployment metadata without printing secrets, then isolate image existence, authentication, authorization, and node connectivity. After confirming the cause, I would apply the smallest correction, resume the rollout, verify pulls and Ready Pods on affected nodes, and add prevention.

Detailed Explanation

See the Code while reading this explanation.

New copies of the application cannot start after a release, but the copies that were already running are still serving users. I need to avoid making the working service worse while I find out why the new copies cannot get the software package they need. I would collect safe evidence first and check whether the package exists, whether the system has the right identity, whether that identity is allowed to access it, or whether the machine cannot reach the storage location. Then I would make only the needed correction, confirm normal service, and prevent the same problem from returning.

Useful Questions to Ask the Interviewer
  1. Are the existing replicas still serving enough traffic to maintain acceptable capacity?
  2. Did the ImagePullBackOff begin immediately after this deployment, and what image reference changed?
  3. Are failures limited to specific nodes, zones, or node pools, or do all newly scheduled Pods fail?
  4. Is the image expected to use a mutable tag or an immutable digest?
  5. Does the workload obtain registry credentials through imagePullSecrets on the Pod, through its ServiceAccount, or through another approved registry credential mechanism?
  6. Is there an approved registry IAM, audit, or secret-management path I can use to validate access without displaying credentials?
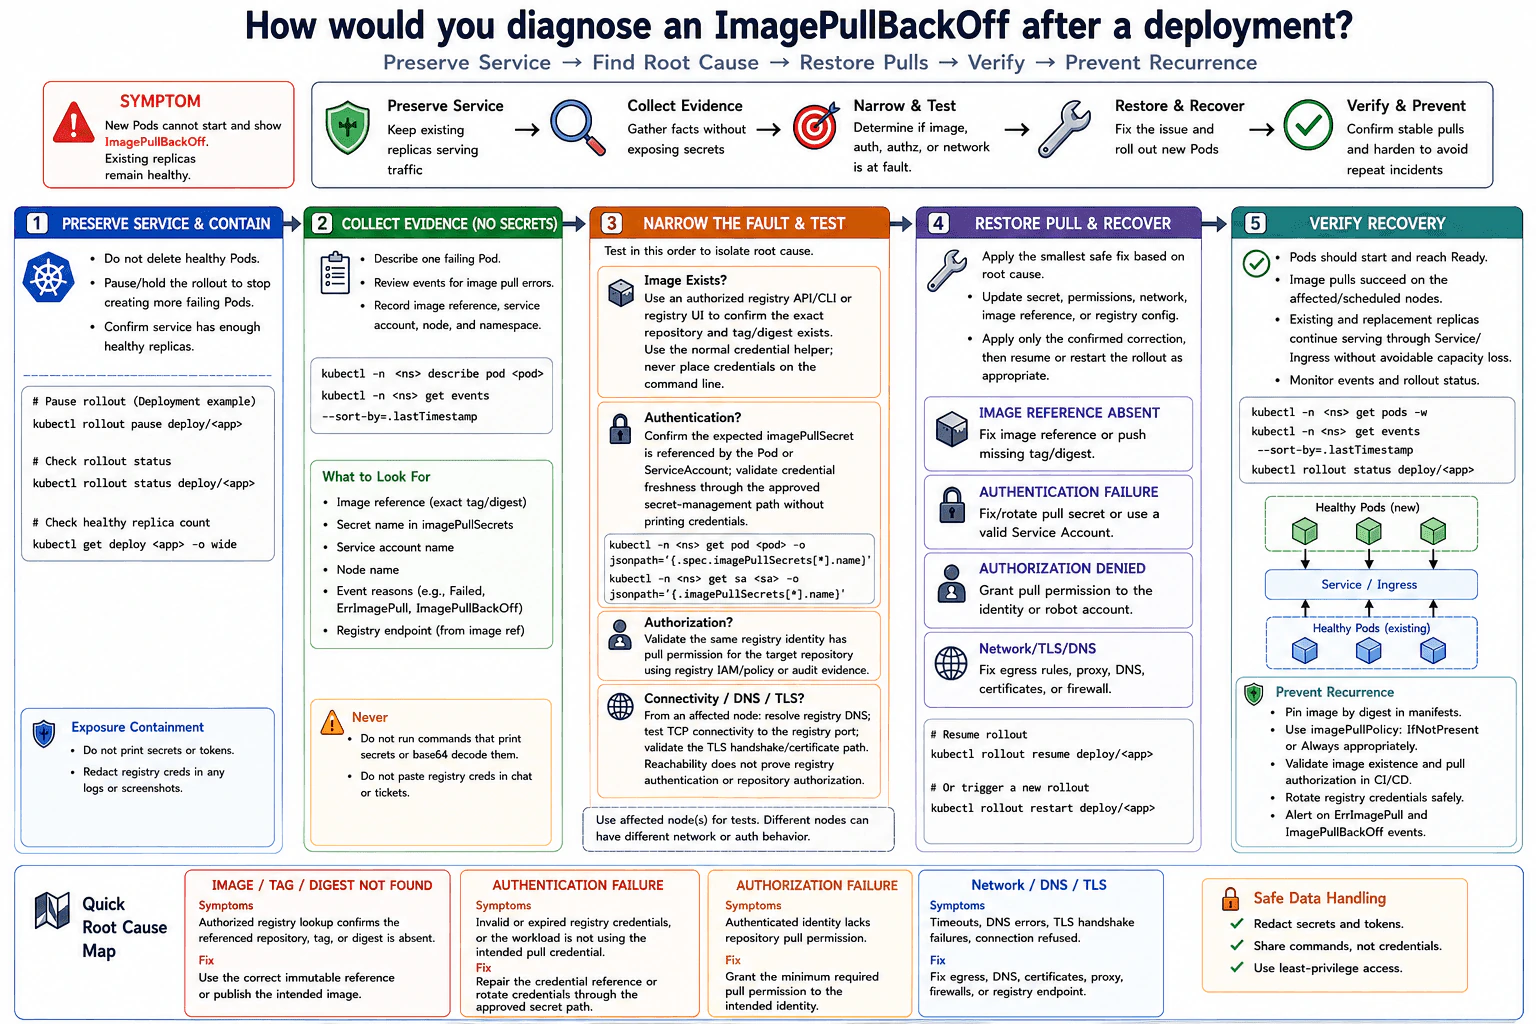
How would you diagnose an ImagePullBackOff after a deployment? diagram
How to Explain It in an Interview

I would use five stages: preserve service, collect evidence, narrow the fault, restore the pull, and verify recovery.

1. Preserve service and contain exposure

The existing replicas are healthy, so I would not delete or restart them. I would confirm that the Service or Ingress is still routing traffic to healthy replicas and check whether the available replica count is enough for current traffic. If the deployment is continuing to create failing Pods or could reduce healthy capacity, I would pause or hold the rollout. I would establish severity, blast radius, incident ownership, a communication channel, and a timestamped action log. Registry passwords, tokens, Docker configuration data, and decoded Secrets must not be copied into terminals, tickets, screenshots, or chat.

2. Collect evidence before changing anything

I would inspect one failing Pod and its events first. Image-pull events are high-value evidence, but I would treat them as clues rather than assuming one message automatically proves the root cause. I would record the exact image repository and tag or digest, registry endpoint, referenced imagePullSecret name, ServiceAccount, namespace, and node. I would compare those details with the Deployment and the recent rollout change. I would also determine whether every node fails or only specific nodes because a node-specific pattern points toward DNS, routing, proxy, firewall, certificate, egress, or node configuration differences.

I would never print the Secret contents. To inspect credential wiring safely, I can read only the imagePullSecret names referenced by the Pod and ServiceAccount.

3. Narrow the fault boundary

I would test four hypotheses separately.

Image reference: I would use an authorized registry API, CLI, or registry UI to confirm that the exact repository and tag or digest exists. Credentials should come from the normal credential helper or approved secret-management path, never from command-line text. If an authorized registry lookup confirms that the repository, tag, or digest is absent, the correction is to use the correct immutable reference or publish the intended image.

Authentication: I would confirm that the expected imagePullSecret is referenced by the Pod or ServiceAccount and validate credential freshness through the approved secret-management path without printing the credential. The presence of a Secret name proves only that it is referenced; it does not prove that the registry credential is valid.

Authorization: I would confirm that the identity used for the registry pull has permission to read the target repository by checking registry IAM, policy, or audit evidence. Authentication and authorization are different: authentication proves who the caller is, while authorization determines what that identity is allowed to pull.

Connectivity, DNS, and TLS: From an affected node, I would verify registry DNS resolution, TCP connectivity to the registry port, and the TLS certificate path. Successful reachability does not prove registry authentication or repository authorization. If failures happen only on some nodes, I would compare DNS, egress, proxy, firewall, certificate trust, network policy, and relevant node configuration with healthy nodes.

4. Apply the smallest safe correction

The correction should match the confirmed fault. For an incorrect or missing image reference, I would use the correct immutable image reference or publish the intended image. For an authentication problem, I would repair the intended credential reference or rotate the credential through the approved secret path. For an authorization problem, I would grant only the minimum repository pull permission required by the intended identity. For connectivity problems, I would change only the confirmed DNS, routing, proxy, firewall, egress, TLS, or registry-endpoint issue.

I would avoid changing the image, credentials, permissions, and networking at the same time because that destroys evidence about which change solved the incident. After the confirmed correction, I would resume or restart the rollout only as appropriate. The rollback criterion is simple: if new image-pull failures continue or healthy capacity begins to fall, stop or pause further rollout progress and return to the evidence step while leaving known healthy replicas serving traffic.

5. Verify recovery

I would verify recovery through Kubernetes rather than relying only on a manual registry request. Replacement Pods scheduled on affected nodes should successfully pull the configured image, start, and reach Ready. Pull-related failure events should stop. I would monitor Deployment rollout status, Pod readiness, and events, and confirm that existing and replacement replicas continue serving through the Service or Ingress without avoidable capacity loss. I would continue verification long enough to exercise affected or scheduled nodes instead of checking only one successful Pod.

After recovery, I would update stakeholders with the confirmed cause, mitigation, recovery evidence, remaining risk, and prevention work.

Prevention

I would prefer immutable image digests for releases, validate image existence and pull authorization in CI/CD before deployment, use imagePullPolicy appropriately, rotate registry credentials safely, maintain least-privilege repository access, and alert on ErrImagePull and ImagePullBackOff events. I would complete a blameless review, document the root cause and contributing conditions, assign owners and due dates to corrective actions, and track those actions to completion.

The main tradeoff is speed versus evidence. Pausing a harmful rollout can protect healthy service quickly, but changing several possible causes at once can hide the real root cause. I would therefore contain first, test one fault boundary at a time, make the smallest reversible correction supported by evidence, and verify the result on the nodes that actually failed.

Key Insight / Why This Solution Works
  1. Confirm blast radius, healthy replica capacity, severity, incident owner, communication channel, and timestamped action log.
  2. Pause or hold the rollout only if continuing it threatens healthy capacity or creates more failing Pods.
  3. Describe one failing Pod and inspect Pod events; record the exact image reference, registry endpoint, imagePullSecret name, ServiceAccount, namespace, and node without exposing credentials.
  4. Use an authorized registry API, CLI, or UI to confirm that the exact repository and tag or digest exists.
  5. Confirm the workload references the intended imagePullSecret and validate credential freshness through the approved secret-management path.
  6. Confirm the registry identity has the minimum pull authorization for the target repository using IAM, policy, or audit evidence.
  7. On affected nodes, test registry DNS resolution, TCP reachability, TLS validation, egress, proxy, firewall, and related node-path differences.
  8. Apply only the correction supported by evidence: image reference, authentication, authorization, or connectivity.
  9. Resume or restart the rollout as appropriate, with an explicit criterion to pause again if failures continue or healthy capacity falls.
  10. Verify Kubernetes-controlled image pulls on affected or scheduled nodes, Pods reaching Ready, pull-related events stopping, and Service or Ingress capacity remaining healthy.
  11. Monitor recovery, communicate the outcome, complete a blameless review, and add CI/CD validation, immutable references, credential controls, least privilege, and alerts.
Code
# Use placeholders only. Never put registry passwords, tokens, or decoded Secret data in this script.
import subprocess

NS = "<namespace>"
POD = "<failing-pod>"
DEPLOY = "<deployment>"
SA = "<service-account>"


def run(*args: str) -> None:
    subprocess.run(args, check=True)


# Read the failing Pod details first. Diagnostic intent: capture its configured image, node, image-pull references, and event history without changing production state.
run("kubectl", "-n", NS, "describe", "pod", POD)

# Read recent namespace events in timestamp order. Evidence may include ErrImagePull or ImagePullBackOff reasons, but event text is a clue rather than automatic proof of one root cause.
run("kubectl", "-n", NS, "get", "events", "--sort-by=.lastTimestamp")

# Read Deployment state and configured image information. Safety: this is read-only; compare desired, available, and updated replicas with the failing Pod before making any rollout change.
run("kubectl", "-n", NS, "get", "deployment", DEPLOY, "-o", "wide")

# Display only Pod-level imagePullSecret names. This checks credential wiring while deliberately avoiding Secret contents, decoded data, or registry credentials.
run(
    "kubectl",
    "-n",
    NS,
    "get",
    "pod",
    POD,
    "-o",
    r"jsonpath={.spec.imagePullSecrets[*].name}{'\n'}",
)

# Display only ServiceAccount-level imagePullSecret names. Compare these names with the intended configuration; do not retrieve the referenced Secret data.
run(
    "kubectl",
    "-n",
    NS,
    "get",
    "serviceaccount",
    SA,
    "-o",
    r"jsonpath={.imagePullSecrets[*].name}{'\n'}",
)

# Identify the node selected for the failing Pod. If failures cluster on particular nodes, investigate those nodes' DNS, TCP/TLS reachability, egress, proxy, firewall, and related configuration separately.
run(
    "kubectl",
    "-n",
    NS,
    "get",
    "pod",
    POD,
    "-o",
    r"jsonpath={.spec.nodeName}{'\n'}",
)

# After an evidence-backed correction is applied through the normal deployment, IAM, secret-management, registry, or network process, observe rollout recovery. This command itself does not mutate the Deployment.
run("kubectl", "-n", NS, "rollout", "status", f"deployment/{DEPLOY}")

# Verify Pod placement and readiness after recovery. Expected result: replacement Pods on affected/scheduled nodes reach Ready and no new pull-related failures appear.
run("kubectl", "-n", NS, "get", "pods", "-o", "wide")

# Rollback rule for any separate state-changing mitigation: if image-pull failures continue or healthy capacity drops, pause further rollout progress and return to evidence collection instead of stacking additional changes.
Why Interviewers Ask This

This question tests whether the candidate can troubleshoot a Kubernetes image-pull failure without making the incident worse. A strong answer protects healthy replicas, preserves evidence, keeps credentials secret, separates image-reference, authentication, authorization, and connectivity failures, applies an evidence-backed correction, and verifies recovery through Kubernetes. It also tests operational judgment: containment must be separate from diagnosis, mitigation must be reversible, healthy service capacity must be protected, and the incident should end with monitoring, communication, root-cause learning, and prevention.

Common interview mistakes

Common mistakes are deleting or restarting healthy replicas before understanding the blast radius; repeatedly restarting failing Pods and assuming ImagePullBackOff is transient; printing, decoding, or pasting registry credentials during troubleshooting; treating the presence of an imagePullSecret name as proof that authentication works; confusing authentication with repository authorization; assuming an HTTP status code always identifies one Kubernetes root cause; treating successful DNS, TCP, or TLS reachability as proof that the image pull is authorized; testing only from an engineer workstation instead of the affected node path; changing the image reference, Secret, IAM permissions, and networking at the same time; assuming a manual container-runtime pull perfectly reproduces the kubelet credential path; resuming the rollout without checking affected nodes and healthy service capacity; and closing the incident without communication, root-cause learning, owners, and prevention.

Interview tip

Present the answer as a safe decision tree: preserve healthy service first, gather evidence without exposing secrets, test image existence, authentication, authorization, and node connectivity separately, then make one evidence-backed correction. Finish by explaining how you verify Kubernetes-controlled pulls on affected nodes and how CI/CD checks, immutable references, credential controls, least-privilege permissions, and alerts prevent recurrence.

Interviewer may ask next
What would you do if ImagePullBackOff happens only on one node pool while Pods on other nodes pull the same image successfully?

I would treat that pattern as strong evidence that the common image reference and registry-side configuration may be valid while the failing node path needs investigation. I would compare registry DNS resolution, TCP connectivity, TLS trust, proxy configuration, firewall and egress rules, relevant network policy, node runtime configuration, and any node-pool-specific registry identity or credential-provider behavior. I would keep healthy replicas serving and avoid moving more workload onto the failing pool. After correcting the confirmed difference, I would schedule or recreate a replacement Pod on that node pool and verify that Kubernetes pulls the image, the Pod reaches Ready, pull-related events stop, and service capacity remains healthy before restoring normal rollout behavior.

How would you handle a suspected expired registry credential without exposing the credential during the incident?

I would first confirm that the Pod or ServiceAccount references the intended imagePullSecret name without reading the Secret contents. I would then use the approved secret-management or registry administration path to check credential validity or rotation status. If the credential is confirmed expired, I would rotate or replace it through that controlled path while keeping permissions limited to the required repository. I would never paste tokens into shell history, tickets, screenshots, or chat. After the credential correction, I would verify a Kubernetes-controlled image pull on an affected node, confirm the replacement Pod reaches Ready, monitor rollout status and events, and add credential rotation or expiry monitoring to prevent recurrence.

55. How would you diagnose a CI pipeline that hangs until its timeout?Incident Response And TroubleshootingMedium

Question Details

A pipeline job produces no progress after beginning an external dependency step and is terminated by its configured timeout. The job timestamps, last log line, runner CPU and memory, process tree, network connection state, dependency status, and retry history are available. Show how you cancel or isolate the run, classify runner deadlock versus remote wait, mitigate safely, prove the cause, validate the next run, and add bounded timeouts or observability. Separate run containment, bounded mitigation, root-cause classification, successful-rerun verification, and timeout or telemetry prevention.

Short Interview Answer (30-60 seconds)

I would isolate the hanging run, preserve evidence, classify runner-local blocking versus a remote dependency wait using process and network evidence, apply bounded timeouts and only safe limited retries, prove the cause by correlation, validate a successful rerun, and add telemetry to prevent recurrence.

Detailed Explanation

This question asks how you would handle a work task that starts waiting on another system, then stops making visible progress and is ended because it takes too long. You need to show that you would first stop the stuck work from causing more problems, collect facts before changing anything, decide whether the problem is inside the machine doing the work or in the outside system it is waiting for, try only safe temporary actions, prove what caused the delay, check that the next run finishes normally, and make future delays easier to detect and limit.

Useful Questions to Ask the Interviewer
  1. Is only one pipeline run affected, or are multiple runs and runners hanging?
  2. Is the external dependency known to be slow, degraded, rate-limited, or unavailable during the same time window?
  3. Can I cancel or isolate the hanging run without affecting another deployment or shared environment?
  4. Were the runner CPU and memory, process tree, and network connection state captured while the job was still hanging?
  5. Are retries already enabled, and is the external operation safe to retry without duplicate side effects?
  6. What timeout currently terminates the job, and are separate connection, read, or step-level timeouts already configured?
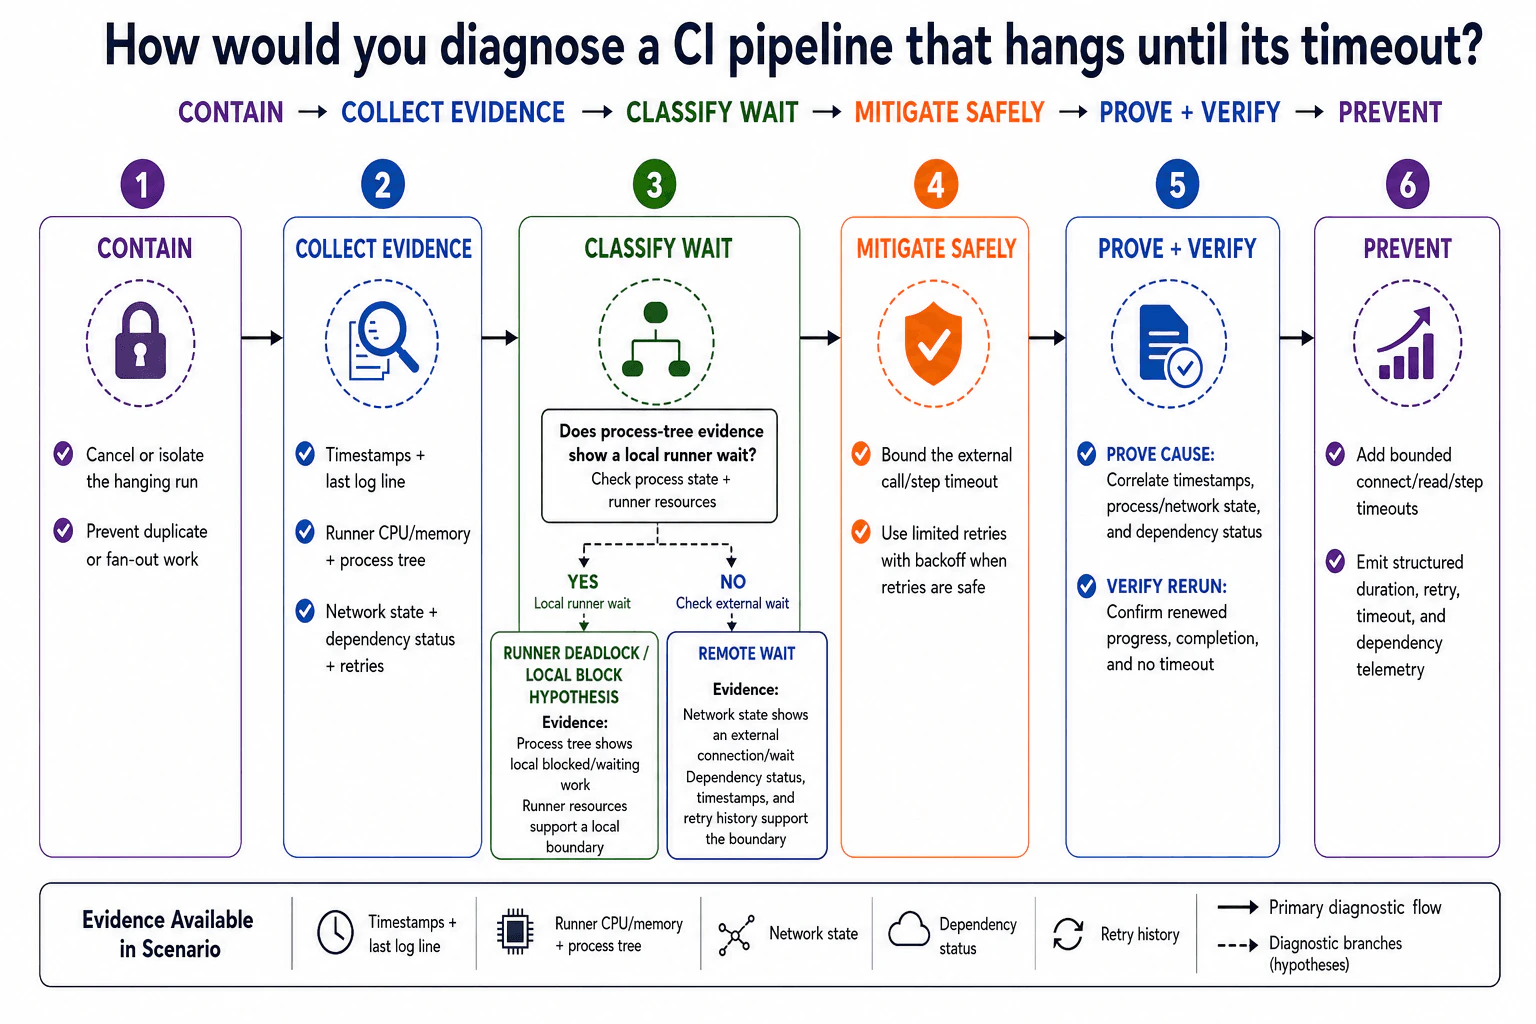
How would you diagnose a CI pipeline that hangs until its timeout? diagram
How to Explain It in an Interview

I would explain the investigation as six connected stages: CONTAIN → COLLECT EVIDENCE → CLASSIFY WAIT → MITIGATE SAFELY → PROVE + VERIFY → PREVENT.

1. Contain

First, I would cancel or isolate the hanging run. I would also prevent duplicate or fan-out work so repeated executions do not consume more runner capacity or create side effects. If this is an active delivery incident, I would establish scope, severity, ownership, a communication path, and a timestamped action log. I would preserve evidence before changing anything and avoid exposing secrets or personal data.

2. Collect Evidence

I would align the job timestamps and last log line with runner CPU and memory, the process tree, network connection state, dependency status, and retry history. The last log line tells me where visible progress stopped, but it does not prove the cause. CPU or memory values are also supporting evidence rather than a diagnosis.

3. Classify Wait

I would first ask whether process-tree evidence shows a local runner wait. If the process tree shows blocked or waiting local work, and runner-resource evidence supports a local boundary, I would keep a RUNNER DEADLOCK / LOCAL BLOCK HYPOTHESIS.

If local process evidence does not support that boundary, I would check the external wait. I would examine whether network state shows an external connection or wait, then correlate that with dependency status, timestamps, and retry history. If those signals align with the stalled period, they support a REMOTE WAIT hypothesis.

Neither path is proven by one signal alone. Low CPU does not prove deadlock, high CPU does not prove useful progress, and an established connection does not by itself prove the dependency caused the timeout.

4. Mitigate Safely

For the external dependency step, I would bound the external call or step instead of letting the entire job wait until its global timeout. I would configure an appropriate operation timeout. I would use only a limited number of retries with backoff, and only when retrying is safe. For a non-idempotent operation, meaning an operation that may create a duplicate effect when repeated, I would not retry unless duplicate effects are prevented.

The mitigation is separate from the root cause. A timeout can restore runner availability without proving why the dependency or runner stalled.

5. Prove + Verify

To prove the cause, I would correlate the same time window across timestamps, process state, network state, and dependency status. For a local block, the process evidence should show local waiting or blocked work. For a remote wait, network and dependency evidence should align with the stalled interval. I would avoid changing many variables at once because that would make causality harder to prove.

Then I would rerun safely with equivalent inputs. I would verify renewed progress, successful completion, and that the run does not reach the timeout. I would also confirm that downstream stages continue normally and monitor subsequent runs for recurrence.

6. Prevent

I would add bounded connect, read, and step-level timeouts where supported. I would emit structured telemetry for duration, retry count, timeout count, and dependency behavior. A correlation or run identifier can tie the evidence together without exposing secrets.

I would also update the incident record with the confirmed cause, mitigation, verification result, corrective actions, owners, and follow-up date. If the incident affected delivery, I would communicate recovery and complete a blameless review.

The main tradeoff is timeout length. A timeout that is too short can fail healthy but slow work, while one that is too long wastes runner capacity and delays recovery. Retries have the same balance: too few may fail on harmless transient problems, while too many can increase dependency load and extend the incident. I would choose values from observed healthy behavior and dependency expectations, then adjust them using the new telemetry.

Technical Approach
  1. Cancel or isolate the hanging run and prevent duplicate or fan-out work.
  2. Preserve timestamps, last log line, runner CPU and memory, process tree, network state, dependency status, and retry history.
  3. Correlate the evidence within the same time window.
  4. Ask whether the process tree shows a local runner wait; if so, keep a runner deadlock or local block hypothesis.
  5. If not, inspect network state and dependency status for evidence of an external wait.
  6. Treat both paths as hypotheses until multiple signals agree.
  7. Apply the smallest bounded mitigation: an external-call or step timeout, plus limited backoff retries only when retrying is safe.
  8. Prove the cause by correlating process, network, dependency, and timing evidence.
  9. Rerun safely and verify renewed progress, completion, downstream execution, and no timeout.
  10. Add bounded connect, read, and step timeouts plus structured duration, retry, timeout, and dependency telemetry.
  11. Monitor subsequent runs and record corrective actions, owners, and follow-up work.
Practical Insights

The computer cost of this diagnosis is usually small because most steps read evidence that already exists. The larger cost is engineer time spent matching several signals from the same period. More telemetry adds some storage and processing cost, so only useful fields should be retained. Shorter timeouts free runner capacity sooner but may stop healthy slow work. Longer timeouts tolerate slow dependencies but delay failure and waste runner time. Retries can recover temporary failures, but each retry adds delay and dependency load. Timeout values, retry limits, alerts, and runbooks also need maintenance as normal pipeline behavior changes.

Why Interviewers Ask This

Interviewers want to see whether you can contain a stuck CI run safely, preserve evidence before changing the system, distinguish a runner-local block from an external dependency wait, avoid treating one signal as proof, use bounded and reversible mitigation, confirm causality, validate recovery, and prevent recurrence. The scenario specifically supplies timestamps, the last log line, runner CPU and memory, process-tree information, network state, dependency status, and retry history for that evidence-driven diagnosis.

Common interview mistakes

Common mistakes are waiting for the global job timeout instead of bounding the external step, rerunning immediately without preserving evidence, assuming low CPU proves deadlock, assuming an established network connection proves the external dependency is at fault, changing several things before proving the boundary, using unlimited retries, retrying a non-idempotent operation without duplicate protection, restarting the runner as a reflex, deleting failed-run evidence, declaring success after one rerun, and adding verbose or secret-bearing logs instead of focused structured telemetry.

Interview tip

Present the answer in the same six-stage order as the diagram: contain, collect evidence, classify wait, mitigate safely, prove and verify, prevent. Emphasize that CPU, process state, network state, dependency status, and retry history are evidence rather than conclusions. Explain why retries are bounded, why retry safety matters, and how you would prove the fault boundary before naming a root cause.

Interviewer may ask next
What would you do if the network connection is established but the dependency never returns a response?

I would treat that as a remote-wait hypothesis rather than immediate proof. I would correlate the connection state and wait duration with dependency status, timestamps, and retry history. I would check whether the client remains blocked waiting for response data and whether the dependency shows matching degradation. The safe mitigation is a bounded read or operation timeout. If the operation is safe to repeat, I may use a small retry limit with backoff. I would then rerun and verify either successful completion within the bound or a controlled timeout with enough structured telemetry to identify the external boundary.

How would you choose timeout and retry values without making the pipeline too fragile?

I would start from observed healthy step duration and the dependency's expected behavior rather than selecting arbitrary numbers. The step timeout should allow normal variation but still expire well before the overall job timeout. When supported, I would separate connection and read or operation limits because they represent different waits. Retries should be few, use backoff, and run only when repeating the operation is safe. After the change, I would measure duration, retry, and timeout behavior and adjust the bounds if healthy jobs are being rejected or failed jobs still consume excessive runner time.

56. How would you troubleshoot a Kubernetes application that cannot reach an external database?Incident Response And TroubleshootingMedium

Question Details

Application Pods are Ready, DNS lookup for the database name can be tested, and connection attempts fail before any SQL is executed. You may inspect DNS results, routes, egress NetworkPolicies, firewall or security-group logs, database listener state, TLS errors, and connection-pool logs. Separate traffic containment, temporary restoration, layer-by-layer diagnosis, end-to-end verification, and a durable network or certificate control. State containment, temporary connectivity mitigation, proven root cause, end-to-end verification, and durable prevention independently.

Short Interview Answer (30-60 seconds)

I would contain impact, preserve evidence, and test from an affected Pod toward the database one layer at a time. I would find the first failing boundary, use only a narrow temporary mitigation if needed, apply the smallest correction, verify TCP/TLS plus an application query, and monitor before making the control permanent.

Detailed Explanation

See the Code while reading this explanation.

This question asks how I would find why a running application cannot communicate with the separate system that stores its information. The application itself appears healthy, but communication fails before it can request any information. I should first limit harm and save useful evidence. Then I should check each part of the communication path in order instead of guessing. If service must be restored quickly, I should use a narrow temporary change. Finally, I must prove what caused the failure, confirm normal operation, watch for new problems, and prevent the same failure from returning.

Useful Questions to Ask the Interviewer
  1. Is the failure affecting every Pod, one namespace, one node, or only part of the traffic?
  2. Did the problem begin after a NetworkPolicy, firewall, security-group, route, NAT, VPN, DNS, certificate, or database change?
  3. Does DNS return the expected database address from an affected Pod?
  4. Is the database reached through public Internet egress, private routing, VPN, peering, or another controlled path?
  5. Is there an active incident process, and what temporary connectivity changes are approved during recovery?
  6. Do we have CNI or node firewall evidence, cloud firewall or security-group logs, database listener logs, TLS errors, and connection-pool logs?
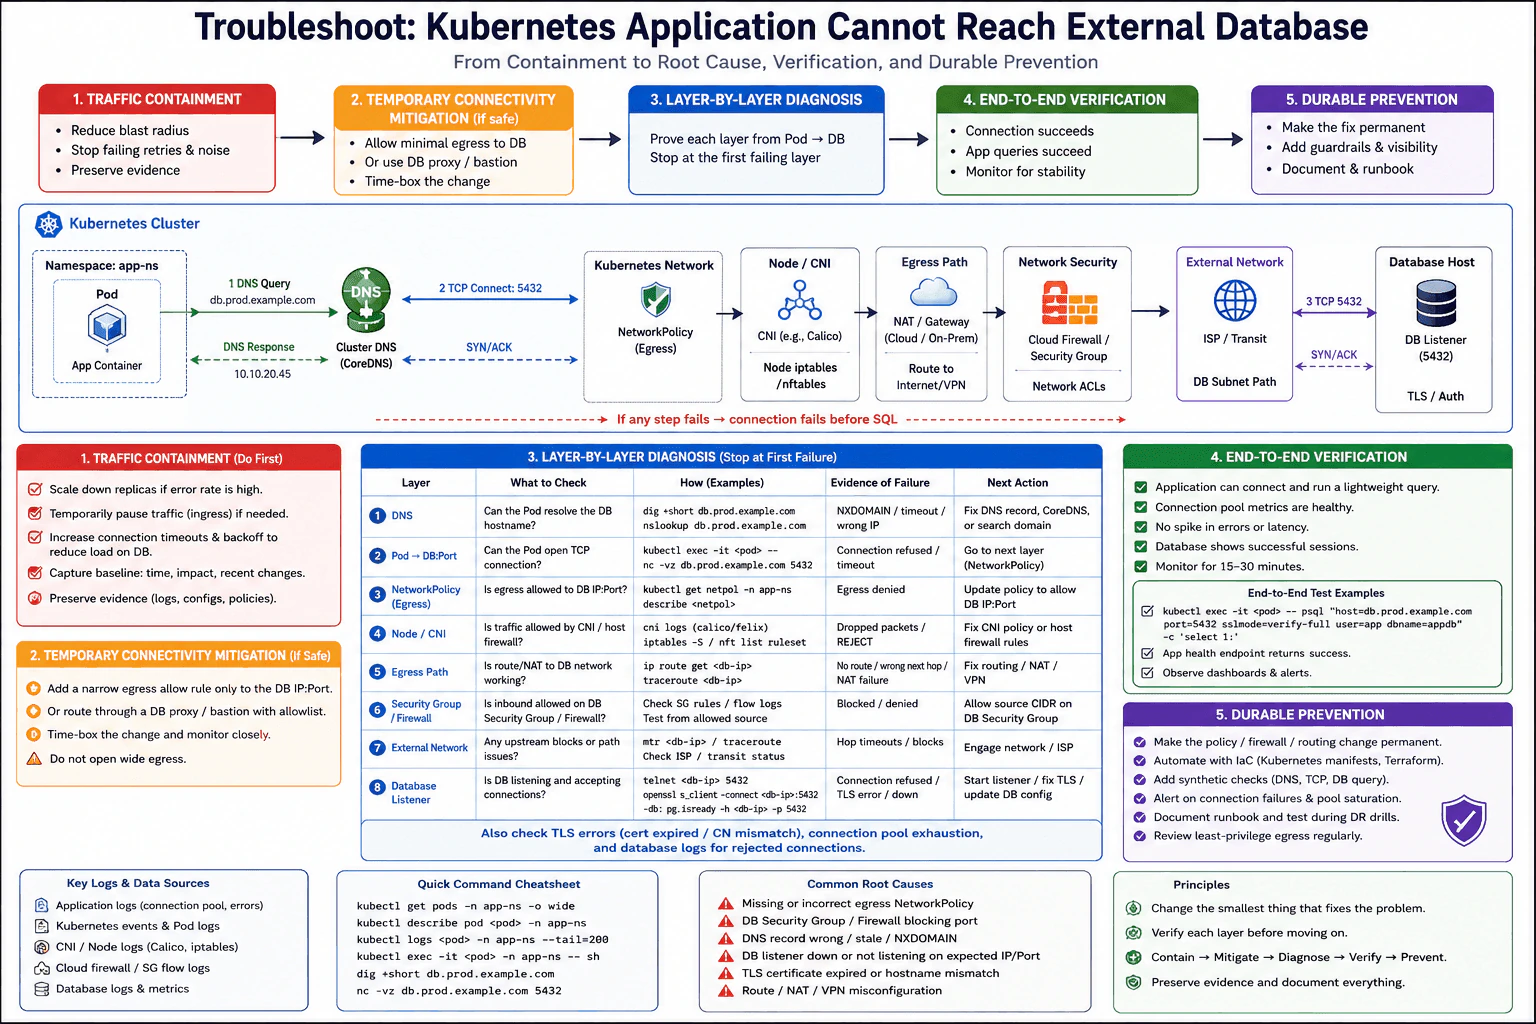
How would you troubleshoot a Kubernetes application that cannot reach an external database? diagram
How to Explain It in an Interview

I would separate containment, temporary restoration, diagnosis, proven root cause, verification, and durable prevention.

1. Contain traffic and preserve evidence

First I establish severity, blast radius, ownership, an incident communication channel, and a timestamped action log. I preserve Pod state, application and connection-pool logs, NetworkPolicies, relevant Kubernetes events, route information, CNI or node firewall evidence, firewall or security-group logs, database listener state, and TLS evidence before making changes. I avoid restarting Pods, broadly opening egress, or changing several layers at once because those actions can hide evidence or increase risk.

If retries are creating extra load or noise, I reduce retry pressure or incoming traffic in a controlled way. Scaling down replicas is not a default action; I would consider it only when excessive concurrent retries are making the incident worse, with an explicit success condition and rollback plan.

2. Use temporary connectivity mitigation only when it is necessary and safe

If service restoration is urgent and policy permits it, I use the smallest reversible exception. For example, I can temporarily allow only the required database destination and TCP port, or use an approved proxy or bastion path with an allowlist. I time-box the exception, record who approved it, define success and rollback criteria, monitor while it is active, and remove it after the permanent correction is deployed. I would not open unrestricted egress.

3. Diagnose layer by layer from the affected Pod

I begin from an affected running Pod because it represents the application's real namespace, identity, policies, CNI path, node, and egress behavior.

First I test DNS. I verify that the database name resolves and that the returned address is the expected database address. Successful DNS resolution proves only name resolution. It does not prove that a TCP connection can reach the database.

Next I test the database TCP port. A timeout, refusal, or successful handshake provides different evidence. A timeout commonly suggests that packets or replies are being dropped somewhere along the path. A refusal usually means the destination was reached but nothing accepted that connection on the tested address and port, although intermediate devices can sometimes reject traffic too.

Then I inspect egress NetworkPolicy. I determine whether a policy selects the Pod and whether its egress rules permit the expected database destination and TCP port. A Ready Pod can still be denied egress.

If Kubernetes policy permits the traffic, I inspect the CNI and node networking boundary. I look for packet drops or rejects in CNI or host firewall evidence and confirm that the Pod-to-node path is behaving as expected. I distinguish Pod network evidence from node-level routing because a route visible inside the Pod does not by itself prove that the node, NAT gateway, VPN, or external path is correct.

Next I inspect the egress path. I verify the expected route, next hop, NAT or gateway behavior, VPN or private-network path, and any relevant external transit. A missing route, incorrect next hop, or NAT failure can stop the connection before it reaches the database network.

Then I correlate firewall, security-group, or network ACL evidence with the actual source address seen at that boundary, the database destination, and the required port. I account for source NAT because the database-side firewall may see a node, gateway, or NAT address rather than the Pod IP.

If traffic reaches the database host, I verify that the database listener is running and accepting connections on the expected interface and port. A healthy server does not prove that the database process is listening correctly.

If TCP succeeds but the application still cannot establish the database session, I move to TLS and connection setup. I check certificate validity, trust chain, hostname or SAN matching, and server-name handling. I also inspect connection-pool logs for stale connections, saturation, repeated failures, or slow recovery after connectivity returns.

4. State the proven root cause independently

I do not name a root cause until evidence identifies the first failing boundary. Valid examples include an egress NetworkPolicy that denies database traffic, a security group or firewall that blocks the required source or port, a wrong or stale DNS result, a route or NAT misconfiguration, a database listener that is down or listening on the wrong address or port, or a TLS certificate or hostname mismatch. The proven root cause is the specific condition demonstrated by the tests and supporting evidence, not merely the first plausible hypothesis.

5. Apply the smallest safe correction

The correction must match the proven failure. I might add the specific database destination and port to an egress NetworkPolicy, correct a route or NAT configuration, allow the required source in the appropriate firewall or security group, restore or correct the database listener, or renew or replace the TLS certificate. I change one relevant control at a time so the result remains attributable and rollback remains simple.

6. Verify end to end

I repeat the checks from an affected Pod. DNS should return the expected address. TCP should connect. If TLS is required, the handshake and hostname validation should succeed. The application should obtain a healthy pooled connection and execute a lightweight query successfully. I verify successful database sessions, normal connection-pool behavior, and the absence of a new spike in connection errors or latency. I monitor for a sustained period rather than declaring recovery after one successful connection.

7. Make prevention durable

I replace any temporary exception with an explicit least-privilege network or certificate control. I keep egress policy, firewall, routing, and related infrastructure changes in version-controlled infrastructure as code where possible. I add appropriate synthetic DNS, TCP, and lightweight database connectivity checks, alert on connection failures and pool saturation, automate certificate lifecycle management, document allowed database destinations and ports, update the runbook, test controls during disaster-recovery exercises, and complete a blameless review with corrective actions, owners, and due dates.

Key Insight / Why This Solution Works
  1. Establish severity, blast radius, ownership, communication, and a timestamped action log.
  2. Reduce harmful retry or traffic pressure only when it is contributing to impact.
  3. Preserve Pod, policy, CNI, routing, firewall, listener, TLS, and connection-pool evidence.
  4. If urgent restoration is required, use a narrow, approved, time-boxed connectivity exception with explicit rollback.
  5. From an affected running Pod, verify DNS resolution and the returned address.
  6. Test the database TCP port.
  7. Inspect egress NetworkPolicy.
  8. Inspect CNI and node firewall evidence.
  9. Verify routes, next hops, NAT or gateway behavior, VPN, and external transit.
  10. Correlate firewall, security-group, or ACL evidence with the actual source, destination, and port.
  11. Verify the database listener.
  12. If TCP succeeds, verify TLS certificate validity, trust, and hostname matching.
  13. Inspect connection-pool behavior.
  14. Identify the first failing boundary and prove it with supporting evidence.
  15. Apply the smallest correction that addresses that boundary.
  16. Verify DNS, TCP/TLS, application query, connection pool, database sessions, and monitoring signals.
  17. Remove temporary exceptions, make the permanent control explicit, document the result, and complete prevention actions.
Code
from __future__ import annotations

import argparse
import subprocess
from collections.abc import Sequence


def run(command: Sequence[str]) -> None:
    """Run one diagnostic command and stream its output."""
    subprocess.run(command, check=True)


def main() -> None:
    parser = argparse.ArgumentParser(
        description="Run read-only Kubernetes-to-database connectivity diagnostics."
    )
    parser.add_argument("--namespace", required=True)
    parser.add_argument("--pod", required=True)
    parser.add_argument("--db-host", required=True)
    parser.add_argument("--db-port", required=True)
    parser.add_argument("--db-ip", required=True)
    args = parser.parse_args()

    # Read-only: record current Pod placement, Pod IP, node, and readiness before changing anything.
    # Intent: establish scope and preserve the current state for the incident timeline.
    # Expected evidence: affected Pods, their nodes, Pod IPs, and readiness status.
    # Safety: this command does not modify cluster state; save relevant output with timestamps.
    run(["kubectl", "get", "pods", "-n", args.namespace, "-o", "wide"])

    # Read-only: inspect the affected Pod and its recent Kubernetes events.
    # Intent: collect configuration, labels, container state, addresses, and event evidence.
    # Expected evidence: current Pod specification and events that may reveal environment or runtime differences.
    # Safety: redact secrets or personal data before copying evidence outside approved systems.
    run(["kubectl", "describe", "pod", args.pod, "-n", args.namespace])

    # Read-only: list egress NetworkPolicies in the namespace.
    # Intent: identify policies that may select the affected Pod and restrict outbound database traffic.
    # Expected evidence: policy names and selectors to inspect against the application's labels.
    run(["kubectl", "get", "networkpolicy", "-n", args.namespace])

    # Read-only: inspect NetworkPolicy rules in detail.
    # Intent: verify whether selected policies permit the expected database destination and TCP port.
    # Expected evidence: podSelector, policyTypes, egress destinations, and permitted ports.
    # Important reasoning: Pod readiness and working DNS do not prove database egress is allowed.
    run(["kubectl", "describe", "networkpolicy", "-n", args.namespace])

    # Read-only: test DNS from the affected application context when nslookup is available in the container.
    # Intent: verify that the database name resolves and compare the returned address with the expected destination.
    # Expected evidence: A or AAAA answers; success proves name resolution only, not TCP connectivity.
    # Safety: use only the database hostname, never credentials or connection strings containing secrets.
    run(
        [
            "kubectl",
            "exec",
            "-n",
            args.namespace,
            args.pod,
            "--",
            "nslookup",
            args.db_host,
        ]
    )

    # Read-only: test the database TCP port from the same Pod when netcat is available.
    # Intent: determine whether the TCP connection can be established before any SQL is attempted.
    # Expected evidence: success, refusal, or timeout; each narrows the fault boundary but does not alone prove root cause.
    # Safety: this opens only a short TCP test to the intended database host and port and does not send SQL.
    run(
        [
            "kubectl",
            "exec",
            "-n",
            args.namespace,
            args.pod,
            "--",
            "nc",
            "-vz",
            "-w",
            "5",
            args.db_host,
            args.db_port,
        ]
    )

    # Read-only: inspect the route visible inside the Pod when the ip command is available.
    # Intent: record the Pod namespace's selected next hop and interface for the database IP.
    # Expected evidence: the Pod-visible route toward the destination.
    # Limitation: this does not prove the node route, NAT gateway, VPN, external transit, or firewall path is correct.
    run(
        [
            "kubectl",
            "exec",
            "-n",
            args.namespace,
            args.pod,
            "--",
            "ip",
            "route",
            "get",
            args.db_ip,
        ]
    )

    # Read-only: inspect recent application and connection-pool logs.
    # Intent: correlate network and TLS tests with connection creation, retry, timeout, or pool behavior.
    # Expected evidence: timestamps and structured connection errors that can be matched to network tests.
    # Safety: redact credentials, tokens, connection strings, customer information, and other sensitive data.
    run(["kubectl", "logs", "-n", args.namespace, args.pod, "--tail=200"])

    # Read-only: if TCP works and TLS is expected, inspect the TLS handshake when openssl is available.
    # Intent: verify certificate presentation, server-name handling, and handshake behavior above the TCP layer.
    # Expected evidence: handshake status and certificate details for the requested database hostname.
    # Important reasoning: a successful TCP connection does not prove certificate trust or hostname validation.
    run(
        [
            "kubectl",
            "exec",
            "-n",
            args.namespace,
            args.pod,
            "--",
            "openssl",
            "s_client",
            "-connect",
            f"{args.db_host}:{args.db_port}",
            "-servername",
            args.db_host,
            "-brief",
        ]
    )

    # No state-changing command is intentionally included in this diagnostic sequence.
    # Any temporary NetworkPolicy, firewall, route, listener, proxy, or certificate change requires approval.
    # Safety for a state-changing mitigation: scope it to the minimum database destination and port, time-box it, record the owner, and monitor it.
    # Rollback: remove the temporary exception or restore the previous reviewed configuration if the mitigation fails or creates new risk.
    # Verification after an approved correction: repeat DNS, TCP, and TLS checks, then run the application's lightweight query or health check and confirm connection-pool and database-session recovery.


if __name__ == "__main__":
    main()
Why Interviewers Ask This

This question tests whether the candidate can troubleshoot a Kubernetes-to-external-database connectivity failure systematically and safely instead of guessing or changing application code too early. It evaluates incident containment, evidence preservation, DNS and TCP knowledge, Kubernetes egress controls, CNI and host networking, routing and NAT, cloud firewall or security-group controls, database listener and TLS diagnosis, temporary restoration, connection-pool recovery, end-to-end verification, stakeholder communication, and durable prevention.

Common interview mistakes

Common mistakes include treating Pod readiness as proof of external connectivity; assuming a successful DNS lookup proves the database is reachable; changing application code before proving the failing network boundary; restarting or scaling Pods reflexively and losing evidence; opening unrestricted egress as a quick fix; checking only Kubernetes NetworkPolicy while ignoring CNI, host firewall, routing, NAT, VPN, security groups, ACLs, external transit, or the database listener; treating a timeout and a connection refusal as equivalent; forgetting that source NAT can change the address seen by the database-side firewall; ignoring TLS after TCP succeeds; declaring an unproven hypothesis to be the root cause; forgetting connection-pool recovery; and leaving a temporary exception in production.

Interview tip

Present the investigation as one ordered path: contain and preserve evidence, temporarily mitigate only when necessary, then test DNS, TCP, NetworkPolicy, CNI and node networking, route/NAT, firewall or security group, external transit, database listener, TLS, and connection pool. Clearly separate temporary restoration from the proven root cause, then finish with end-to-end verification and a durable least-privilege network or certificate control.

Interviewer may ask next
DNS resolves correctly, but the TCP connection to the database port times out. What would you check next?

I would treat DNS as confirmed and move to the TCP path. From the affected Pod I would confirm the destination IP and port, inspect any selecting egress NetworkPolicies, check CNI and node firewall evidence, verify the expected route and NAT or gateway path, and correlate cloud firewall, security-group, or ACL logs with the source address actually seen at that boundary. I would also check VPN or other external transit if it is part of the expected path. If those layers permit the flow, I would verify whether traffic reaches the database host and whether the database listener is accepting connections. A timeout suggests packets or replies may be dropped, but it does not identify which boundary is responsible. I would prove the first failing layer before changing it.

TCP connectivity succeeds, but the application still cannot establish the database connection. How does your troubleshooting change?

Successful TCP connectivity moves the fault boundary above basic routing and port reachability. I would inspect the TLS handshake, certificate validity, trust chain, server-name handling, and hostname or SAN matching. I would verify that the database listener expects the protocol and port being used, then review application and connection-pool logs for failed handshakes, stale connections, saturation, or repeated retries. I would apply only the smallest correction supported by evidence, such as renewing or correcting the certificate or listener configuration. Then I would verify TLS, a lightweight application query, healthy pool behavior, successful database sessions, and sustained monitoring before closing the incident.

57. How would you investigate uneven Kubernetes node utilization and unscheduled Pods?Incident Response And TroubleshootingMedium

Question Details

Some nodes are heavily utilized while others have spare capacity, and a subset of Pods stays Pending. Available evidence includes Pod requests, node allocatable resources, taints and tolerations, node selectors, affinity rules, topology-spread constraints, scheduler events, and autoscaler decisions. Explain immediate risk reduction, placement correction, proof of the binding constraint, post-change validation, and prevention through scheduling and capacity policy. Show immediate risk containment, placement mitigation, root-cause proof, scheduling verification, and preventive policy or capacity work.

Short Interview Answer (30-60 seconds)

I would contain immediate risk, collect Pending Pod and node evidence, and prove the exact scheduling constraint. Then I would make the smallest safe change to requests, placement rules, topology, or eligible capacity and verify the affected Pods become Ready, scheduling failures stop, and node utilization becomes healthier.

Detailed Explanation

See the Code while reading this explanation.

Some machines doing the work are much busier than others, while some work cannot start at all. I would first protect the most important services and reduce pressure if there is a risk of disruption. Then I would gather facts before changing anything. I would find out why the waiting work cannot use the spare machines, prove which rule or shortage blocks it, make the smallest safe correction, and watch the system afterward. Finally, I would improve placement and capacity rules so the same imbalance is less likely to happen again.

Useful Questions to Ask the Interviewer
  1. Are critical workloads affected now, or are only lower-priority Pods Pending?
  2. Did this start after a deployment, resource-request change, scheduling-policy change, node-pool change, or autoscaler change?
  3. Are the Pending Pods concentrated in one workload, namespace, availability zone, or node pool?
  4. Is Cluster Autoscaler enabled, and are eligible node groups allowed to grow?
  5. Do any workloads require specialized labels, taints and tolerations, affinity rules, or topology placement?
How would you investigate uneven Kubernetes node utilization and unscheduled Pods? diagram
How to Explain It in an Interview

I would treat this as both an incident-risk problem and a Kubernetes scheduling problem.

First, I would establish severity, blast radius, incident ownership, a communication channel, and a timestamped action log. If hot nodes threaten critical workloads, I would pause risky changes and create safe headroom by reducing non-critical demand or temporarily adding eligible capacity. I would not drain, restart, or move healthy workloads automatically because that can increase disruption. PodDisruptionBudgets and workload availability must be respected if workloads are moved.

Next, I would collect evidence before changing configuration. I would list the affected Pending Pods and inspect their FailedScheduling events. I would compare each Pod's CPU and memory requests with node allocatable resources and also inspect current node utilization. This distinction is important: the scheduler primarily decides whether a Pod fits by using resource requests and scheduling constraints. A node that looks lightly utilized from metrics can still be unable to accept a Pod.

I would then inspect the complete placement inputs shown in the diagram: Pod requests and limits, node allocatable resources, node labels and taints, Pod tolerations, node selectors, required and preferred affinity or anti-affinity rules, topology-spread constraints, scheduler events, and autoscaler decisions.

I would prove the binding constraint instead of guessing. If scheduler events indicate insufficient CPU or memory, I would confirm that no eligible node has enough remaining allocatable capacity for the Pod's requests. If a taint is involved, I would verify the Pod lacks the required toleration. If a node selector or required affinity rule is involved, I would compare it with labels on candidate nodes. If topology spread is involved, I would verify that another placement would violate the configured topology rule. More than one rule can combine to eliminate all candidate nodes, so I would look at the intersection of constraints rather than checking them independently and stopping at the first suspicious item.

I would also review Cluster Autoscaler decisions. I would determine whether the Pending Pod is considered unschedulable in a way that adding a node could solve, whether an eligible node group exists, and whether that group is allowed to grow. Adding capacity does not help if new nodes would still fail the Pod's labels, taints, affinity, topology, or resource requirements.

After the binding constraint is proven, I would make the smallest safe correction. If requests are materially above measured demand, I would right-size requests carefully. If the placement configuration is unintended, I would correct selectors, affinity, tolerations, or topology-spread rules. If the policy is correct but eligible capacity is insufficient, I would increase the appropriate node-pool capacity or autoscaler bounds. I would move already-running workloads only when necessary because the normal Kubernetes scheduler places new Pods but does not continuously rebalance existing running Pods simply because utilization becomes uneven.

For verification, I would confirm the affected Pods schedule onto appropriate nodes and become Ready. I would verify new FailedScheduling events stop, node utilization becomes more balanced, and no new hotspot or availability problem appears. I would continue monitoring Pending Pods, node saturation, evictions, and autoscaler activity for a suitable stability period before declaring recovery.

For prevention, I would standardize resource requests, labels, taints and tolerations, affinity rules, and topology-spread policy. I would review node-pool sizing, autoscaler minimum and maximum bounds, and buffer capacity. LimitRange and ResourceQuota can provide admission-time resource guardrails; PriorityClasses can express workload priority; PodDisruptionBudgets can protect availability during voluntary disruptions. These controls support prevention and safe mitigation, but they do not replace scheduler-event evidence when proving why a specific Pod cannot be placed. I would add alerts for persistent Pending Pods, FailedScheduling spikes, node saturation, and autoscaler failures, then record corrective actions, owners, and follow-up work in a blameless incident review.

Key Insight / Why This Solution Works
  1. Establish severity, blast radius, incident owner, communication channel, and a timestamped action log.
  2. Protect critical workloads and create safe headroom only if node saturation threatens service.
  3. Identify affected Pending Pods and collect their FailedScheduling events.
  4. Compare Pod CPU and memory requests with allocatable resources on candidate nodes; use utilization metrics as supporting evidence, not as the scheduler's fit calculation.
  5. Inspect node labels and taints plus Pod tolerations, node selectors, affinity or anti-affinity, and topology-spread constraints.
  6. Evaluate the intersection of hard placement rules to determine why every candidate node is filtered out.
  7. Review autoscaler decisions to determine whether the Pending Pods can trigger scale-up and whether an eligible node group can grow.
  8. Prove the binding constraint with scheduler and configuration evidence before changing production state.
  9. Apply the smallest safe correction: right-size inaccurate requests, correct unintended placement rules, adjust topology policy when appropriate, or add eligible capacity.
  10. Rebalance already-running workloads only when necessary, with disruption budgets and workload availability protected.
  11. Verify affected Pods become Ready, FailedScheduling stops, utilization becomes healthier, and no new hotspot appears.
  12. Prevent recurrence through scheduling standards, resource guardrails, node-pool capacity policy, autoscaler bounds, alerts, and owned follow-up actions.
Code
import os
import subprocess


def run(command: str) -> None:
    """Run one diagnostic shell command and stream its output."""
    subprocess.run(command, shell=True, check=True)


# Read-only diagnostic scope: list Pending Pods across all namespaces so we know exactly which workloads currently cannot schedule.
run("kubectl get pods -A --field-selector=status.phase=Pending -o wide")

# Read-only evidence: FailedScheduling events contain the scheduler's placement reasons; preserve timestamps before making any change.
subprocess.run(
    "kubectl get events -A --sort-by=.lastTimestamp | grep -E 'FailedScheduling|Warning' || true",
    shell=True,
    check=False,
)

# Read-only node inventory: show each node and its allocatable CPU and memory, which are relevant to Pod request fit.
run(
    "kubectl get nodes -o "
    "custom-columns='NAME:.metadata.name,"
    "CPU_ALLOCATABLE:.status.allocatable.cpu,"
    "MEMORY_ALLOCATABLE:.status.allocatable.memory'"
)

# Read-only supporting telemetry: current node usage helps identify hotspots, but it does not replace request-versus-allocatable scheduler checks.
# This command requires a working Kubernetes Metrics API such as metrics-server.
run("kubectl top nodes")

# Set these values to one affected Pod and one candidate node before the next read-only checks; assigning shell variables changes no cluster state.
NAMESPACE = os.environ.get("NAMESPACE", "replace-me")
POD = os.environ.get("POD", "replace-me")
NODE = os.environ.get("NODE", "replace-me")

# Read-only Pod evidence: describe output includes recent scheduling events and the Pod's requests, selectors, tolerations, and placement configuration.
run(f'kubectl describe pod -n "{NAMESPACE}" "{POD}"')

# Read-only exact specification: YAML exposes requests/limits, nodeSelector, affinity, tolerations, and topologySpreadConstraints for correlation with node eligibility.
run(f'kubectl get pod -n "{NAMESPACE}" "{POD}" -o yaml')

# Read-only node evidence: inspect labels, taints, allocatable resources, and currently allocated requests on a candidate node.
run(f'kubectl describe node "{NODE}"')

# Read-only cluster placement map: labels reveal whether selectors, affinity, and topology keys can match candidate nodes.
run("kubectl get nodes --show-labels")

# Read-only autoscaler discovery: find a Cluster Autoscaler deployment if this cluster uses one; absence is evidence that this specific command path does not apply.
autoscaler_result = subprocess.run(
    "kubectl -n kube-system get deployment -o name | grep -m1 'cluster-autoscaler' || true",
    shell=True,
    check=False,
    capture_output=True,
    text=True,
)
AUTOSCALER_DEPLOYMENT = autoscaler_result.stdout.strip()

# Read-only autoscaler evidence: review recent decisions only when the deployment exists; this helps confirm whether scale-up was attempted, skipped, or blocked.
if AUTOSCALER_DEPLOYMENT:
    run(f'kubectl -n kube-system logs "{AUTOSCALER_DEPLOYMENT}" --tail=200')
else:
    print(
        "Cluster Autoscaler deployment not found in kube-system; "
        "inspect the cluster-specific autoscaling implementation instead."
    )

# Safety and rollback: every command above is read-only against Kubernetes objects and logs, so no production rollback is required.
# Preserve collected evidence and timestamps. Perform any state-changing mitigation separately with approval, narrow scope, success criteria, and rollback to the previous workload or node-pool configuration if validation fails.
Why Interviewers Ask This

This question tests whether the candidate can distinguish visible utilization from schedulable capacity, reduce production risk before diagnosis, use Kubernetes scheduler evidence systematically, prove the binding placement constraint, choose a minimal and reversible correction, validate recovery, communicate during an incident, and prevent recurrence through scheduling and capacity policy.

Common interview mistakes

Common mistakes include assuming low measured CPU means a node is schedulable; ignoring Pod requests and node allocatable resources; looking at each placement rule separately instead of their combined effect; adding nodes before confirming new nodes would actually be eligible; removing taints, selectors, affinity, or topology rules merely to force scheduling; changing several variables at once; treating autoscaling as guaranteed to solve every Pending Pod; draining or restarting nodes reflexively; assuming Kubernetes automatically rebalances already-running Pods; declaring success when a Pod only leaves Pending without checking readiness and node balance; and failing to add preventive scheduling, capacity, monitoring, ownership, and follow-up actions.

Interview tip

Present the answer as an evidence chain: contain risk, inspect Pending Pod events, compare requests with eligible-node capacity, test the intersection of placement constraints, confirm the autoscaler decision, make one minimal correction, and verify both scheduling and node balance. A strong phrase to use is: apparent spare capacity is not always schedulable capacity.

Interviewer may ask next
What would you do if the cluster has plenty of total free CPU and memory, but Pods still remain Pending?

I would not assume the cluster needs more nodes. I would inspect the Pods' FailedScheduling events and determine which nodes are actually eligible. I would compare the Pods' requests with allocatable resources on those nodes, then check taints and tolerations, node selectors, required affinity or anti-affinity, and topology-spread constraints. Total cluster capacity can be misleading because a Pod needs at least one node that satisfies all hard constraints at the same time. Resource fragmentation can also matter: several nodes may each have some spare capacity while none has enough remaining allocatable CPU or memory for the Pod's requests. I would correct only the constraint proven by the evidence.

What if Cluster Autoscaler is enabled but it does not add nodes for the Pending Pods?

I would inspect the autoscaler's decision rather than increasing limits blindly. I would confirm that the Pods are unschedulable for a reason that adding a node could solve, that an eligible node group exists, and that the group is allowed to grow. I would verify that a new node from that group would satisfy resource requests, labels, taints and tolerations, affinity, and topology rules. If configured bounds or capacity policy block a legitimate scale-up, I would adjust them only after proving the requirement. If a new node would still be ineligible, I would correct the placement constraint instead of adding ineffective capacity.

58. How would you recover when an automated rollback also fails?Incident Response And TroubleshootingHard

Question Details

A deployment breached its health gate and the rollback job then failed before restoring all instances. Both immutable artifacts exist; the deployment controller state, job logs, target inventory, configuration revisions, and per-instance health are available. Explain how you freeze automation, establish actual fleet state, restore service without compounding partial changes, verify convergence, determine why both paths failed, and test the repaired rollback mechanism. Separate automation containment, manual mitigation, dual-failure root cause, convergence verification, and rollback-prevention testing.

Short Interview Answer (30-60 seconds)

I would freeze deployment and rollback automation, establish the real state of every target from available evidence, restore the known-good artifact and configuration in small verified cohorts, verify fleet convergence, investigate both failed paths, repair confirmed causes, and prove rollback works before re-enabling automation.

Detailed Explanation

A new release caused problems, and the automatic attempt to return to the previous version also stopped before every machine was restored. I would first stop more automatic changes so the situation does not become more confusing. Then I would find out exactly what version and settings each machine is using. I would restore service gradually with the last known good version, checking each small group before continuing. After service is stable, I would find out why both attempts failed, repair the confirmed problems, and prove the recovery process works before allowing automatic changes again.

Useful Questions to Ask the Interviewer
  1. Is customer traffic currently affected, and what is the severity and blast radius?
  2. Can I assume the controller state, job logs, target inventory, configuration revisions, per-instance health, and both immutable artifacts are trustworthy and accessible?
  3. Is there enough capacity to drain affected instances and recover them in small cohorts without creating another outage?
  4. Is there an established incident commander and communication channel, or should I establish them during containment?
  5. What health-gate and service-recovery criteria must pass before traffic and automation can be restored?
How would you recover when an automated rollback also fails? diagram
How to Explain It in an Interview

I would treat this as a compound failure: the deployment breached its health gate, and the rollback also failed before the fleet returned to one known state. My first goal is control, not deep diagnosis.

1. Contain automation

I would establish incident severity, blast radius, ownership, a communication channel, and a timestamped action log. Then I would pause deployment and rollback jobs and lock controller-driven changes that could continue changing the fleet. I would preserve the current controller state and job logs before further state-changing work. This stops automation from compounding the partial changes while keeping evidence available.

2. Establish the actual fleet state

I would not assume the controller's intended state matches reality. I would reconcile controller intent with the six evidence sources shown in the recovery diagram: controller state, deploy and rollback job logs, target inventory, configuration revisions, per-instance health, and immutable artifacts. For every target, I want to know which artifact and configuration it actually has, whether it is healthy, and whether that observed state agrees with controller intent. This produces the ground truth for recovery.

3. Perform controlled manual mitigation

After identifying the known-good immutable artifact and configuration, I would restore service incrementally. I would drain or isolate a small affected cohort, restore that cohort to the known-good artifact and configuration, run the required health checks, and return it to traffic only after those checks pass. Then I would repeat with the next cohort. Small cohorts limit blast radius and make it easier to stop if the mitigation causes another problem. I would avoid a fleet-wide restart or another uncontrolled rollback because either could worsen the mixed state.

4. Verify convergence

Recovery is complete only when the intended fleet has converged. I would confirm that every target is running the expected artifact and configuration and passes the required health gates before normal traffic restoration. I would also compare observed fleet state with controller intent so the control plane and running instances agree. I would continue monitoring long enough to confirm that the recovered state remains stable rather than treating one successful health check as proof of recovery.

5. Determine why both paths failed

Once service is stable, I would correlate the deployment and rollback logs with controller state and the incident timeline. I would test two classes of hypotheses: shared causes that could affect both paths and path-specific causes that affect only the deployment or only the rollback. A hypothesis remains a hypothesis until evidence confirms it. I would not label configuration, permissions, infrastructure, dependencies, or the rollback job itself as the root cause merely because those are common failure modes.

The key diagnostic question is whether the rollback failed because the same condition affected both deployment paths, or because the rollback mechanism had an independent failure. The controller state, deploy and rollback logs, target inventory, configuration revisions, per-instance health, and artifact identities provide the evidence needed to distinguish those cases.

6. Repair and test the rollback mechanism

I would apply the smallest correction that addresses each confirmed cause. Then I would exercise the repaired rollback mechanism in an isolated production-like environment using representative configuration and the immutable artifact pair involved in the recovery path. I would test both a normal rollback and a controlled partial-failure case because the incident demonstrated that interrupted rollback behavior matters. Success means the mechanism reaches the intended fleet state and its health gates pass; a job reporting success by itself is not enough.

Only after the repaired rollback mechanism is proven would I re-enable automation in a controlled manner and watch the first automated operations closely.

Communication and learning

Throughout the incident, I would give timestamped updates about impact, current fleet state, mitigation progress, remaining risk, and the next decision point. After recovery, I would run a blameless review that separately documents the deployment failure and rollback failure, identifies their confirmed contributing factors, assigns corrective actions and owners, and adds measurable tests or safeguards for the repaired rollback path.

The main tradeoff is speed versus control. A fleet-wide action may appear faster, but during a partial rollback it can destroy healthy capacity or make the true fleet state harder to understand. Small verified cohorts require more operational effort, but they provide safer recovery boundaries and continuous evidence that each step is working.

Technical Approach
  1. Establish incident severity, blast radius, ownership, communication, and a timestamped action log.
  2. Pause deployment and rollback jobs and lock controller-driven changes while preserving evidence.
  3. Reconcile controller intent with controller state, deploy and rollback logs, target inventory, configuration revisions, per-instance health, and immutable artifacts.
  4. Identify the known-good immutable artifact and configuration as the recovery target.
  5. Drain or isolate a small affected cohort, restore it to that known-good state, run health gates, and return it to traffic only after it passes.
  6. Repeat cohort by cohort until every intended target converges on the expected artifact and configuration.
  7. Verify health and agreement between controller intent and observed fleet state before declaring recovery.
  8. Correlate deployment and rollback evidence and test shared and path-specific hypotheses.
  9. Apply the smallest correction for confirmed causes only.
  10. Exercise the repaired rollback in an isolated production-like environment, including a controlled partial-failure case.
  11. Re-enable automation only after rollback testing and convergence verification succeed, then monitor closely.
  12. Complete a blameless review with corrective actions, owners, and prevention tests.
Practical Insights

The operational work grows mainly with the number of deployment targets because each target's artifact, configuration, controller state, and health must be reconciled. Recovering in small cohorts normally takes longer than changing the whole fleet at once, but it reduces the amount of service that can be harmed by one bad step. Logs and state snapshots also require storage and retention during the investigation. The process needs more human coordination for mitigation, verification, communication, and testing. Maintaining rollback tests and runbooks adds ongoing work, but it reduces future recovery risk.

Why Interviewers Ask This

This question tests whether a DevOps Engineer can remain controlled during a compound deployment failure instead of repeatedly triggering automation. The interviewer wants to see safe containment, evidence-based fleet reconciliation, incremental service restoration, explicit convergence checks, separation of mitigation from root-cause analysis, investigation of both deployment and rollback paths, disciplined communication, and proof that the repaired rollback mechanism works before automation is trusted again.

Common interview mistakes

Common mistakes are repeatedly triggering the failed rollback, allowing controllers or deployment jobs to continue changing instances during investigation, trusting desired state without checking the actual fleet, changing every instance at once, changing multiple variables together, restoring traffic before artifact, configuration, and health convergence are verified, declaring a familiar failure mode as the root cause without evidence, mixing mitigation with root-cause analysis, testing only the rollback happy path, re-enabling automation before the repaired mechanism is proven, losing the incident timeline, and failing to communicate impact and recovery status.

Interview tip

Present the answer as six phases that match the recovery flow: contain automation, establish actual fleet state, perform controlled manual mitigation, verify convergence, investigate the dual failure, and test rollback before re-enabling automation. Emphasize evidence over assumptions and keep service restoration separate from root-cause analysis.

Interviewer may ask next
What would you do if the fleet is so inconsistent that you cannot confidently identify which instances are safe to keep serving traffic?

I would keep automation frozen and treat uncertain instances as unsafe until their state is established. I would use controller state, deploy and rollback logs, target inventory, configuration revisions, immutable artifact identities, and per-instance health to classify every target. Capacity that is clearly healthy and on the known-good state would remain available unless there is a reason to drain it. Unknown or unhealthy targets would be isolated and restored in small cohorts to the known-good artifact and configuration. Each cohort would pass the required health gates before returning to traffic. I would continue until every intended target has a known artifact, known configuration, healthy state, and agreement with controller intent.

How would you prove that the repaired rollback mechanism will not leave another partially restored fleet?

I would test it in an isolated production-like environment using representative configuration and the immutable artifact pair used by the rollback path. First I would verify that a normal rollback reaches the expected target state. Then I would exercise a controlled partial-failure case and verify that the mechanism handles or reports the incomplete state safely instead of claiming successful convergence. I would compare controller intent with actual target state and confirm the expected artifact, configuration, and health gates across all test targets. Production automation would remain disabled until these tests pass and the confirmed incident causes have been corrected.

59. How would you lead the first hour of a critical overnight outage?Incident Response And TroubleshootingHard

Question Details

At 03:00 the public service is unreachable from independent probes in every region, while the incident cause is unknown. The change timeline, dependency status, DNS and load-balancer health, platform metrics, logs, traces, and on-call contacts can be queried; no single signal is yet authoritative. Define command and communication, containment choices, reversible mitigation, evidence-driven diagnosis, recovery verification, handoff, and follow-up ownership. Use explicit sections for containment, reversible mitigation, root-cause determination, recovery verification, and preventive follow-up.

Short Interview Answer (30-60 seconds)

I would establish incident command, confirm the global blast radius, and collect evidence in parallel. I would contain impact using the smallest reversible action, diagnose from the traffic path inward, verify recovery from multiple regions, communicate factual updates, and hand off remaining work with named owners.

Detailed Explanation

At 03:00, the public service is unavailable everywhere, but nobody yet knows why. My job in the first hour is to organize the response, reduce harm, and restore service without making the situation worse. I need one person coordinating decisions, clear communication, and a written record of actions. I must collect facts from several sources instead of trusting one clue. I should make only safe changes that can be undone. After service returns, I must confirm that users can really use it, explain the current status, hand over remaining work, and make sure prevention tasks have owners.

Useful Questions to Ask the Interviewer
  1. Are people or data at immediate risk, or is the impact limited to service unavailability?
  2. Do independent probes confirm that every region is affected, including from outside our cloud or network?
  3. Was there a recent deployment, configuration change, DNS change, certificate change, feature-flag change, or infrastructure change?
  4. Do we have an established SEV-1 process, incident commander role, status page, and communication channel?
  5. Are known-safe rollback, failover, traffic-shift, or feature-disable procedures available?
  6. Which dependencies are required for the public request path, and can their health be queried independently?
How would you lead the first hour of a critical overnight outage? diagram
How to Explain It in an Interview
1. Command and communication — 0 to 5 minutes

I would acknowledge the alert and confirm the symptom using independent external probes. Because probes fail in every region, I would treat this as a critical, broad-impact incident and declare SEV-1 according to the organization's incident process.

I would start one incident bridge and one incident channel. I would assign an Incident Commander to coordinate decisions, a technical lead to investigate, a communications lead to provide updates, and a scribe to maintain a timestamped action log. Other responders can own specific investigation threads. Clear ownership prevents several people from making unrelated production changes at the same time.

I would establish one source of truth containing the current impact, confirmed facts, hypotheses, actions, owners, timestamps, and outcomes. Stakeholders should receive short factual updates roughly every 15 to 30 minutes, or whenever the situation materially changes. I would separate confirmed facts from hypotheses and avoid speculation.

2. Triage and evidence collection — 5 to 15 minutes

Before changing production, I would gather high-value evidence in parallel. I would reconfirm the widespread blast radius, identify when the outage began, and compare that time with the recent change timeline.

I would examine the request path from the outside inward: DNS resolution and TTL behavior, certificates where relevant, CDN or edge health if present, load-balancer health and target status, network connectivity, application and platform health, and required dependencies such as databases, caches, queues, APIs, or third-party services.

In parallel, I would review platform metrics for request rate, errors, duration, saturation, CPU, memory, I/O, and node or workload health; structured application, proxy, ingress, system, and audit logs; distributed traces for request paths and latency boundaries; dependency status; active alerts; recent incidents; and maintenance windows.

No single signal proves the cause. Metrics show service and resource behavior, logs record events and structured context, and traces show request paths and latency boundaries. I would correlate evidence by timestamp and affected request path instead of trusting one signal.

3. Containment — about 15 to 30 minutes

Containment means reducing current user harm before the complete root cause is known. I would choose a containment action only when evidence identifies a plausible failing boundary.

If a recent change strongly correlates with the outage and a known-safe rollback exists, I would consider rolling it back. If a specific traffic path is unhealthy, I could route around it or drain traffic from it. If a dependency is failing, I might isolate it, use an existing circuit breaker, or activate an already-designed graceful-degradation path. If saturation is confirmed, I could shed non-critical load or increase capacity within established safe limits. If abusive traffic is causing the failure, existing rate limits or WAF controls may reduce impact.

I would not restart, scale, fail over, roll back, block traffic, or disable controls as a reflex. These actions can destroy evidence, overload another component, expand the blast radius, or hide the real failure. Before a state-changing action, I would record the reason, expected result, success criteria, safety boundary, and rollback path.

4. Reversible mitigation — about 15 to 30 minutes

After choosing containment, I would prefer the smallest reversible mitigation that reduces impact. Examples include reverting a verified recent configuration change, switching off a problematic feature through an existing feature flag, shifting traffic away from an unhealthy path, temporarily reducing non-critical work, or returning to a known-good version.

I would make one meaningful change at a time. After each change, I would check independent probes and the relevant error, latency, saturation, traffic, and dependency signals. If the expected improvement does not occur, I would undo the change when appropriate and reject that hypothesis rather than stacking additional changes on top of it.

The objective of mitigation is to stabilize the service. A successful mitigation does not by itself prove the root cause.

5. Root-cause determination — about 30 to 45 minutes

Once the system is stable enough to investigate safely, I would narrow the fault boundary. I would work from the client-facing edge through DNS, load balancing or ingress, network connectivity, application health, dependencies, and platform infrastructure.

For each hypothesis, I would define a test that can confirm or reject it. If I suspect a recent deployment, I would compare its timestamp with the first failure and determine whether affected production instances actually run that version. If I suspect DNS, I would compare resolution results and authoritative configuration instead of relying only on an application error. If I suspect a dependency, I would check its independent health and correlate dependency latency or errors with failed requests.

I would correlate changes, metrics, structured logs, and traces rather than treating one source as authoritative. I would call something the root cause only when the evidence consistently explains the observed outage and fault boundary. When evidence disproves a hypothesis, I would mark it rejected and move on.

If the precise root cause cannot be proven during the first hour, I would not invent one. I would state what is confirmed, what remains unknown, which mitigation restored service, and which evidence still requires investigation.

6. Recovery verification — about 45 to 60 minutes

Service recovery is not proven just because one dashboard turns green. I would verify the system from the outside in again.

Independent synthetic probes from multiple regions should succeed. Important user journeys should work. Error rate, latency, traffic, saturation, and other key service indicators should return to expected operating ranges. Load-balancer targets, platform workloads, and required dependencies should remain healthy. Where stateful operations may have been affected, I would perform appropriate consistency checks and look for new critical alerts.

I would monitor for regression before declaring the incident stable. If the service becomes unhealthy again, I would reopen the relevant investigation path rather than claiming recovery prematurely.

7. Stakeholder communication

My updates would be short and factual: what users are experiencing, what is confirmed, what mitigation is being attempted, whether service is improving, and when the next update will occur. I would avoid publishing an unproven root cause.

After recovery is verified, I would communicate that service has been restored, describe the mitigation at an appropriate level, identify remaining risks, and explain that root-cause analysis will continue if the underlying cause is not yet proven.

8. Handoff

Before the first-hour response ends or responders rotate, I would create a clear handoff. It would include the incident timeline, confirmed evidence, actions taken and their outcomes, current service health, rejected and remaining hypotheses, known risks, monitoring requirements, and unfinished work.

Every remaining item would have a named owner and a next check-in time. That prevents context from being lost when the overnight team changes.

9. Preventive follow-up

After the incident, I would run a blameless review focused on how the system and response process behaved rather than blaming individuals. We would determine the root cause and contributing factors, evaluate detection and response, and identify concrete corrective actions.

Follow-up items should have owners and due dates. Depending on the evidence, they may include better alerts and dashboards, stronger deployment or rollback safeguards, improved dependency isolation, capacity changes, better runbooks, automated recovery checks, resilience tests, or game days.

The operating principles are simple: put user impact first, use facts instead of guesses, minimize blast radius, prefer reversible changes, communicate clearly, preserve evidence, and verify recovery end to end.

Technical Approach
  1. 0-5 minutes — Detect and declare: confirm widespread impact with independent probes, declare SEV-1 according to the incident process, start the bridge, assign roles, and create a timestamped incident record.
  2. 5-15 minutes — Triage and collect evidence: confirm blast radius and collect the change timeline, DNS and load-balancer status, platform health, metrics, structured logs, traces, dependency status, and alerts in parallel.
  3. 15-30 minutes — Contain: choose one evidence-supported action that reduces user impact while protecting people, data, and diagnostic evidence.
  4. 15-30 minutes — Apply reversible mitigation: make the smallest safe change, record its expected result and rollback path, and measure the result before another change.
  5. 30-45 minutes — Determine root cause: narrow the boundary from client through DNS, load balancing, application, dependencies, and platform; test hypotheses and reject those contradicted by evidence.
  6. 45-60 minutes — Recover and verify: validate independent multi-region probes, important user journeys, service indicators, platform health, dependencies, and regression monitoring.
  7. Throughout — Communicate: provide short factual updates every 15 to 30 minutes or on material change, and keep one source of truth.
  8. Before handoff — Document current state, remaining risks and hypotheses, actions taken, and assign owners and next check-in times.
  9. After the incident — Conduct a blameless review and create measurable preventive actions with owners and due dates.
Practical Insights

The main cost is operational rather than algorithmic. Several responders can investigate different evidence sources in parallel, which saves time but requires strong coordination. Metrics, logs, and traces may contain large amounts of data, so searches should be narrowed by incident time, affected service, request path, and correlation identifiers when available. State-changing mitigations carry risk, so each needs clear success and rollback criteria. Maintaining one incident log and clear ownership adds a small communication cost but reduces duplicate work, conflicting changes, and lost context. Follow-up work may require engineering time for monitoring, automation, resilience, and runbook improvements.

Why Interviewers Ask This

This question tests whether I can lead a high-severity outage without guessing. The interviewer wants to see clear incident command, communication, evidence-driven troubleshooting, safe containment, reversible mitigation, disciplined root-cause determination, recovery verification, and accountable follow-up. It also tests whether I can separate restoring service from proving the underlying cause and avoid risky production changes simply because the outage is severe.

Common interview mistakes

Common mistakes include guessing the root cause from the first alert, allowing several engineers to make unrelated production changes, restarting or scaling systems without evidence, rolling back only because a deployment happened recently, confusing mitigation with root cause, failing over without checking capacity and dependency risks, trusting one dashboard as proof of recovery, destroying useful evidence, exposing secrets or customer data in incident channels, giving stakeholders speculative explanations, making several changes before measuring each result, and ending the response without a documented handoff, named follow-up owners, or regression monitoring.

Interview tip

Present the answer as a sequence of decisions, not a list of tools. Walk through the first hour: command, evidence, containment, reversible mitigation, root-cause determination, recovery verification, communication, handoff, and prevention. Explicitly separate confirmed facts from hypotheses and explain that restoring service does not automatically prove the root cause.

Interviewer may ask next
What would you do if a deployment happened just before the outage, but the evidence does not yet prove it caused the failure?

I would treat the deployment as a high-priority hypothesis, not a confirmed cause. I would compare its timestamp with the first failures, confirm which production instances or workloads actually received it, and correlate the relevant health signals, logs, and traces. If rollback is known to be safe, fast, reversible, and has explicit success and rollback criteria, it may still be a reasonable mitigation because user impact is severe. I would document that rollback is a mitigation test, verify its effect with independent probes and service indicators, and avoid claiming the deployment was the root cause unless the evidence supports that conclusion.

What if your mitigation restores service but you still cannot determine the root cause within the first hour?

I would keep the service on the stable mitigation, continue regression monitoring, and clearly separate confirmed facts from unknowns. The handoff would include the timeline, evidence collected, mitigation and its observed effect, rejected hypotheses, remaining hypotheses, current risks, and preservation requirements for logs, traces, metrics, and change data. I would assign an owner and next check-in for continued root-cause investigation. Stakeholders would be told that service is restored but the underlying cause remains under investigation. The later blameless review would complete root-cause and contributing-factor analysis and create corrective actions with owners and due dates.

60. How would you roll back a production release that introduces a critical defect?Incident Response And TroubleshootingHard

Question Details

A newly deployed application version causes user-visible failures, but the previous artifact is available and the database migration was designed to remain backward compatible. Versioned error rates, deployment events, feature flags, and data-integrity checks are available. Design exposure reduction, rollback or flag choice, compatibility validation, recovery criteria, root-cause work after stabilization, and corrective release safeguards. Differentiate user-impact containment, rollback mitigation, defect root cause, recovery verification, and release-control prevention.

Short Interview Answer (30-60 seconds)

I would reduce exposure, preserve evidence, and choose the smallest safe reversible mitigation. If a feature flag isolates the defect, I would disable it; otherwise I would validate backward compatibility and restore the previous artifact. Then I would verify recovery before investigating root cause and preparing a guarded corrective release.

Detailed Explanation

This question asks how I would respond when a new production release starts causing failures that users can see. The first goal is to stop the harm quickly without creating a second problem. I need to understand who is affected, save useful information about what changed, and choose the safest way to return to working behavior. I must also protect stored information, confirm that important user actions work again, and only after the service is stable investigate why the release failed and how to prevent a similar problem in the future.

Useful Questions to Ask the Interviewer
  1. Is the defective behavior fully controlled by a feature flag, or does it affect the whole release?
  2. Has the previous application artifact been validated against the migrated database schema?
  3. Which user paths and operational signals define successful recovery for this service?
  4. Are any writes or background operations at risk of producing invalid data while the defect is active?
  5. What controlled deployment mechanism is available for restoring the previous artifact?
How would you roll back a production release that introduces a critical defect? diagram
How to Explain It in an Interview

I would separate the response into user-impact containment, rollback mitigation, recovery verification, root-cause analysis, and release-control prevention.

First, I would establish the incident severity and blast radius, assign incident ownership, open the communication channel, and keep a timestamped action log. Before making major production changes, I would preserve the highest-value evidence that is already available: the deployment event, affected application version, versioned error rates, current feature-flag state, and data-integrity results. Evidence should not expose secrets or customer data.

Next, I would reduce exposure using the smallest safe reversible action. The main decision is whether the defect is cleanly isolated behind a feature flag. If it is, I would disable that flag and verify that the user-visible failures actually stop. This is usually less disruptive than rolling back the whole release because unrelated changes can remain deployed.

If the feature flag does not isolate the defect, I would prepare to restore the previous known-good artifact. Before doing that, I would validate the scenario's key safety assumption: the database migration is backward compatible. Backward compatible means the previous application version can still operate correctly against the current migrated schema and data. I would verify that assumption using the available compatibility information and data-integrity checks instead of trusting the migration design alone.

If compatibility is confirmed, I would deploy the previous artifact through the normal controlled release mechanism. During the rollback, I would watch the versioned error signal and data-integrity checks. I would keep the failed artifact and preserved incident evidence for later investigation rather than deleting them.

If compatibility is not confirmed, I would stop the ordinary artifact rollback path because an old application against an incompatible schema could create another outage or corrupt data. I would keep exposure minimized and use the safest forward-compatible mitigation available while preparing a corrective change that works with the current schema.

Recovery must be demonstrated with evidence rather than an invented percentage or arbitrary fixed wait time. I would confirm that the versioned errors associated with the failed release return to their normal operating level, important user paths work, and data-integrity checks pass. I would then communicate that the service is stabilized, including the impact, mitigation used, current state, and remaining investigation work.

A successful rollback shows that restoring the previous behavior mitigated the incident. It does not prove the defect's root cause. After stabilization, I would reproduce the failure safely outside production, correlate it with the release changes and preserved evidence, test competing hypotheses, and identify the actual defect.

I would then build and test the corrective release, including regression coverage for the discovered failure when practical. I would deploy the correction through staged exposure with explicit success criteria rather than immediately sending it to every user. Finally, I would complete a blameless review, assign corrective actions and owners, and add measurable release safeguards. The key distinction is that containment reduces immediate user impact, rollback mitigates the defective release, root-cause analysis explains why it failed, recovery checks prove restoration, and release controls reduce recurrence or future blast radius.

Technical Approach
  1. Establish severity, blast radius, incident ownership, communication, and a timestamped action log.
  2. Preserve the deployment event, affected version, versioned error rates, feature-flag state, and data-integrity results before major production changes.
  3. Reduce user exposure using the smallest safe reversible action available.
  4. Decide whether a feature flag cleanly isolates the defect. If yes, disable it and verify that exposure is removed.
  5. If the flag does not isolate the defect, validate that the previous application version can safely operate with the migrated database schema and current data.
  6. If compatibility is confirmed, restore the previous known-good artifact through the normal controlled deployment path.
  7. If compatibility is not confirmed, do not perform a blind artifact rollback; keep exposure minimized and use a forward-compatible mitigation or corrective change.
  8. Verify recovery using versioned error behavior, critical user paths, and data-integrity checks, then communicate stabilization.
  9. After stabilization, reproduce the failure safely, test hypotheses, and identify the actual defect.
  10. Build and test the corrective release, deploy it progressively with explicit success criteria, and complete the blameless review with owned prevention actions.
Practical Insights

The rollback action itself may be fast, but the operational cost depends on deployment speed, compatibility checks, traffic exposure, and how much evidence must be reviewed. Keeping a previous artifact ready reduces recovery time. Feature flags can make containment faster, but they add configuration and testing work. Backward-compatible database changes make application rollback safer, but teams must maintain that discipline across releases. Monitoring and data-integrity checks require storage and engineering effort. Staged releases take longer than an immediate full rollout, but that extra time reduces blast radius and makes recovery safer.

Why Interviewers Ask This

This question tests whether a candidate can restore production safely under pressure without confusing mitigation with diagnosis. Interviewers want to see controlled exposure reduction, evidence preservation, a sound feature-flag-versus-rollback decision, database compatibility awareness, objective recovery checks, clear incident ownership and communication, disciplined root-cause work after stabilization, and safeguards that reduce the chance or impact of another defective release.

Common interview mistakes

Common mistakes include rolling back immediately without checking database compatibility; assuming a feature flag removes the defect without verifying user impact; changing several production variables at once; deleting or overwriting useful evidence; treating lower error rates alone as proof of recovery without checking important user paths and data integrity; inventing arbitrary recovery thresholds; declaring root cause simply because rollback restored service; spending too long debugging while users are still affected; exposing secrets or customer information in incident records; failing to assign incident ownership or communicate status; and deploying the corrective release to all users without staged validation.

Interview tip

Present the response in a strict sequence: contain user impact, preserve evidence, choose feature flag or artifact rollback, validate database compatibility, verify recovery, then investigate root cause and prevent recurrence. Explicitly say that rollback is mitigation rather than proof of root cause. That distinction demonstrates strong production judgment.

Interviewer may ask next
What would you do if the previous application version turned out not to be compatible with the migrated database schema?

I would not deploy the previous artifact because that could cause another outage or damage data. I would keep user exposure minimized with the safest available reversible containment, such as disabling the defective feature if that control is valid. Then I would prepare a forward-compatible mitigation or corrective application change that works with the current schema. Any required data repair would be separately planned, tested, and verified. I would continue preserving evidence and incident communication and would use explicit user-path and data-integrity checks before declaring recovery.

How would you decide between disabling a feature flag and rolling back the entire release?

I would choose the smallest reversible action that safely removes the user-visible defect. If the failing behavior is completely isolated behind a feature flag and disabling it restores the known-good path, the flag change is usually lower risk because unrelated release changes can remain deployed. If the defect is outside the flag, affects shared release behavior, or the flag does not actually remove the impact, I would restore the previous known-good artifact after validating database compatibility. In either case, I would verify recovery with versioned error behavior, important user paths, and data-integrity checks.

More questions load as you scroll

Disclaimer: This interview guide is for educational and informational purposes only. It is designed to help readers prepare, but it does not guarantee any interview result, hiring decision, offer, or outcome. Interview questions, hiring criteria, and preferred answers can vary by employer, interviewer, industry, location, and time. The examples and explanations reflect the authors' research and judgment, are provided without warranties of any kind, and should not be treated as the only correct approach. Diagrams are simplified illustrations intended to highlight the main components and their interactions; actual systems and implementations may be more complex. Alternative approaches may be equally valid or better suited to a particular question, context, or interviewer. To the fullest extent permitted by applicable law, the author, contributors, and publisher are not liable for decisions made, actions taken, or losses incurred based on this guide.

Content Accuracy and Verification: To the fullest extent permitted by applicable law, we do not represent or warrant that interview guides, questions, answers, examples, or diagrams are accurate, complete, current, error-free, or suitable for any particular purpose. You are responsible for independently reviewing and verifying the information before relying on it.